-

Seth Golden posted an update 2 years ago
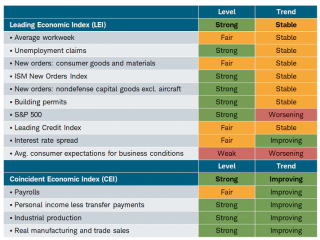
peeling back the LEI onion one layer exposes flags (a couple of red, otherwise mostly yellow) that are worth noting. Shown in the first portion of the table below are the 10 subcomponents of the LEI. While levels are generally healthy or fair (with the exception of average consumer expectations for business conditions), trends look less impressive.Key to watch will be the emergence of additional worsening trends. Historically, a consistent sea of red in the “trend” column has preceded weakness in the “level” column and, eventually, a deterioration in the Coincident Economic Index (CEI), which is shown in the bottom portion of the table.
Online Members
Recently Active Members
Recent Topics
-
Allocation to Short Vol – What is Reasonable %?
by 3 years, 10 months ago
-
TVIX May 2020 Uptrend or Downtrend
by 3 years, 11 months ago
-
WhatsApp India Payments
by
 4 years, 2 months ago
 -
Latest from JPM
by
4 years, 2 months ago
-
UBS 2020 PT
by
4 years, 3 months ago
-
Aegis ups to Street High Price target
by
4 years, 3 months ago
-
Taxes
by 4 years, 4 months ago
-
Credit Suisse on Q4 shipments
by
4 years, 4 months ago
-
Michael Hartnett BofAML
by
4 years, 4 months ago
-
Goldman on growth Rebound
by
4 years, 4 months ago
 MarketWatch.com – Top Stories
- Oil prices jump, U.S. stock futures sink on reports of explosions heard in Iran April 19, 2024Crude oil prices jumped and U.S. stock futures sank Thursday night following reports of explosions in a city in western Iran, amid fears of a wider conflict between Israel and Iran.
- Japan’s inflation marks two years above BOJ’s target as meeting looms April 19, 2024Japan’s consumer inflation has stayed above the Bank of Japan’s 2% target for two years, government data confirmed Friday, amid speculation over further interest-rate increases.
- Nordstrom confirms it’s looking to go private, with founding family interested in deal April 19, 2024Nordstrom Inc. has formed a special committee of independent directors to explore going private, the company said on Thursday — a move that arrives as clothing retailers struggle with subdued demand and pressure from investors for stronger profits.