
Welcome to our Finom Group August Monthly Macro-Market Recap
The Imperative of Discipline and Data in a Turbulent 2025 Market Landscape
August 2025 Monthly Macro Market Recap
Under the Big Top: Markets, Mandates & the Tightrope Ahead
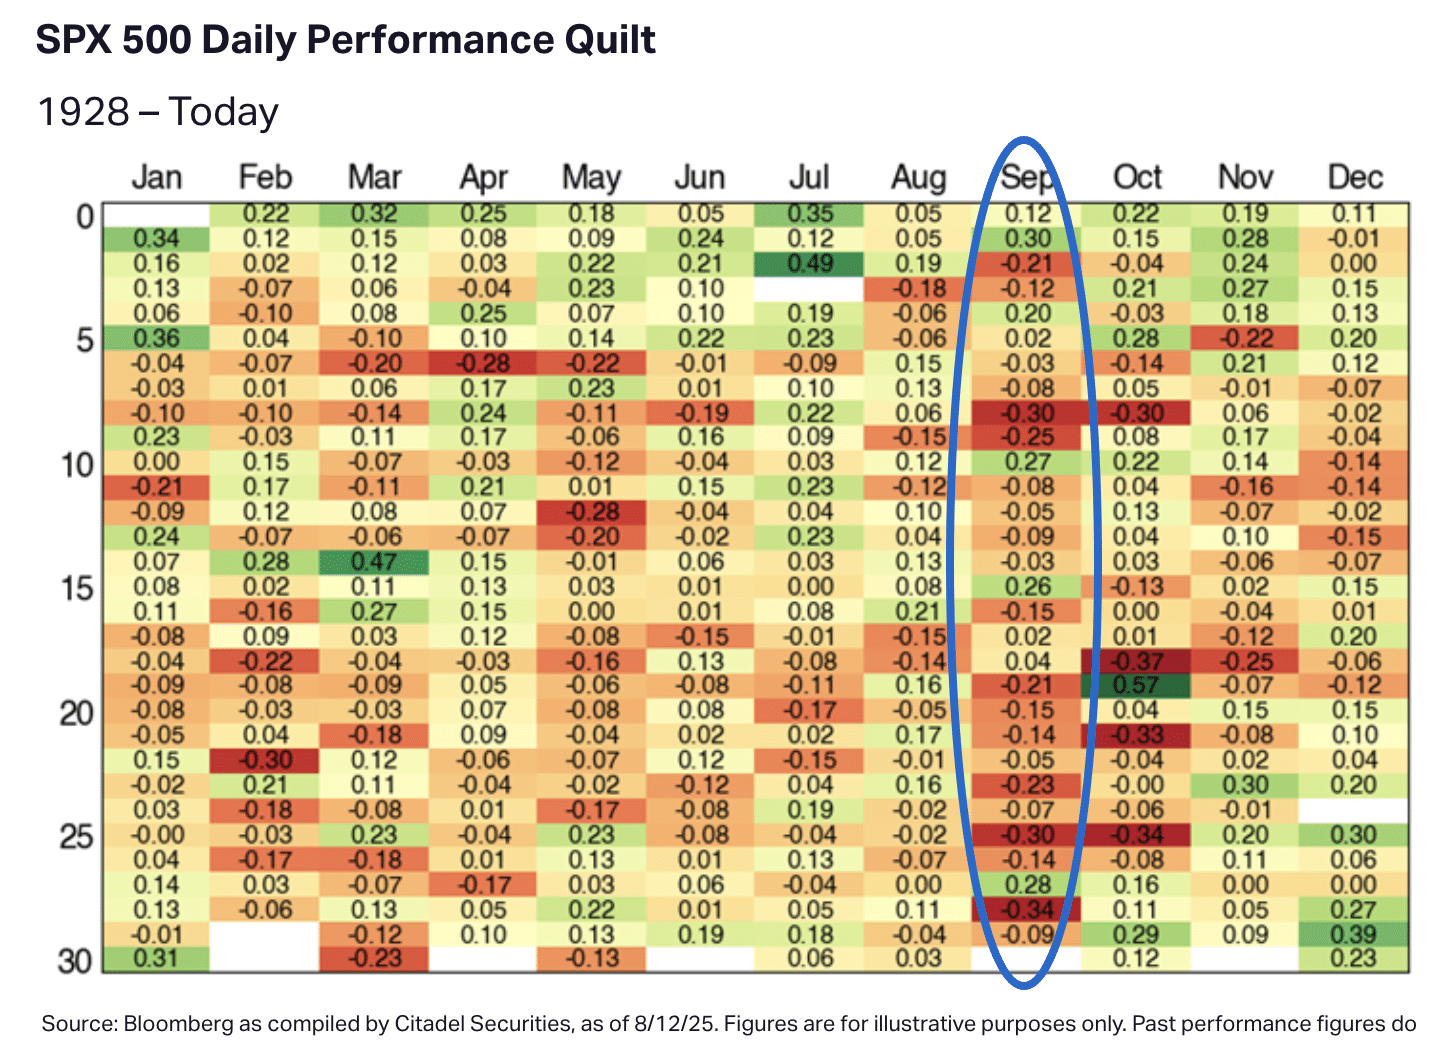
September has arrived—Wall Street’s most infamous month for volatility—and the market’s precarious balance act continues. Jerome Powell is still front and center, defending Fed independence against persistent White House pressure as headlines swirl about the fate of Lisa Cook and speculation mounts over a likely September 17th rate cut. Despite six consecutive meetings on pause, the latest Fed minutes and Jackson Hole speech hinted at a shift: the labor market’s softening and sticky inflation may finally push policymakers to act, with Fed Fund Futures markets now pricing in over 80% odds of a 25bp reduction. Some, though, still urge caution—September is never a lock for the bulls, either on rates or returns. (rate cut probability was 90%+ before Jackson’s Hole; night before FOMC (Sep 17th) whatever probability is 60% or greater has historically always been “a lock”).
Just two weeks ago, as headlines clustered around Trump’s high-profile calls for Fed and BLS changes and investors nervously awaited Powell’s Jackson Hole comments, we reiterated our “win-win” approach: buy dips with discipline, knowing that strong quants, resilient breadth, and a bullish trend supported higher prices for large-cap equities and the S&P 500. August’s close at 6,460 slightly bested the mid-month baseline, making for the tenth positive return in eleven years for this calendar window—another notch for the data-driven investor.
Yet, the crosscurrents are real. Even as July and August delivered new highs, technicals—from a rare four-month streak above the 50-DMA to head-and-shoulders patterns in tech and semiconductors—suggest September’s seasonality might finally bite. The probability of at least a -3% drawdown is high, and years featuring such extended runs without a 5% pullback have historically spelled mean reversion. Still, as the data from Wayne Whaley and other quants illustrates: these selloffs are rarely the end, and often lay the groundwork for robust Q4 rallies—especially if a Fed cut delivers the long-awaited “insurance” jolt.
On the macro front, the story is one of softening, not shrinking. Payroll and jobless claims signal tension but not crisis; consumer spending and personal income show slowing, but positive growth; and the much-feared “recession watch” hasn’t been triggered, as real leading indicators haven’t yet rolled over. Yes, continued tariff drama, a destabilized BLS, and looming court fights over Fed leadership keep nerves frayed, but dips have consistently been bought and volatility, while rising, is still below its long-run average for September.
So what gives? In short: don’t fear volatility, expect it. We’ve now clocked 20 S&P 500 all-time closing highs in 2025, and history says that streaks don’t just stop at 20. The quants leave room for another leg higher by year-end—especially if you keep your game plan adaptive, avoid storytelling for the sake of headlines, and use any September flare-up as a rebalancing and accumulation opportunity; not a time to panic.
For most investors, this is a market to stay nimble in, not to overreact. Ignore the circus and focus on quants, technical signals, policy shifts, and the steady drumbeat of earnings and breadth—a methodology validated time and again across the volatility of this cycle.
Stick to your plan. The show must go on.
This recap distills the most actionable insights from our team’s analysis and Seth’s commentary covering from August 2025. It is designed to connect current price action and macro signals directly with our previously published research so you can see not only what we forecast, but exactly how those views measure against what is actually happening in the market. To facilitate comprehension, I (Luis Solorzano) will omit any further personal commentary and present the information in a straightforward, concise manner. The necessary details are provided, and you are encouraged to conduct your own research and draw your own conclusions. As I do my best to show up on a daily basis, the concepts become more clear, which is why I am, again, here (hopefully not bothering 😅).
Whether you are a longtime member or discovering Finom Group for the first time, use this document as both a checkpoint and a compass. Let it clarify the prevailing trends, reaffirm the mindset and methods that work, and sharpen your perspective for the road ahead. This is a market that has rewarded discipline, punished indecision, and demanded focus on the facts beneath the noise.
You are now ready to dig into the key research, market evidence, and real-world context featured in the sections that follow.
Direct quote from Finom Group’s “Summer Setback and Autumn Fall″ Report (August 3rd, 2025):
Front and Center
If there were ever a time for a reminder, it’s probably after this past week’s market declines. How does the savvy investor navigate such troubling headlines, which almost always pervade the actions of the average investor?
“There’s nothing we can control about what the market is going to do next. If there was ever something to “Let go and let God”, as the saying goes, it’s overly worrying about what the market is going to do next. It’s simply out of our control, and knowing or fearing the bad things, which are far less frequent than the good things, is the very definition of self-induced anxiety. The one thing we can control as investors is our behavior, and that should always be the default consideration or kept front-of-mind.

Print it out, frame it, tap the sign if you must… but it’s alpha folks, it’s alpha! Most investors can never achieve a stable Emotional Quotient, and so they delve ever-deeper into studying the markets in search of ways to control risk as opposed to learning how to take risk. Investing is about learning how to take risk first and foremost. All else in the investing journey will be determined by how you behave.”
Direct quote from Finom Group’s “Summer Setback and Autumn Fall″ Report (August 3rd, 2025):
Now let us be reminded as to just a couple of the quants that inform of higher prices in the not too distant future, and September is not too distant at all in my book.

The quant reads and offers the following:
“You may recall that the S&P experienced an 18.9% selloff from the Feb 19th Close of 6144.15 to the April 8th Close of 4982.77, exceeding 20% if measured vs the April 8th intraday Low of 4910.42. From that 4982.77 Closing Low on April 8th, the S&P 500 has now advanced 26.0%, doing so in less than a Quarter, 86 calendar day (April 8-July 3) to be precise. Looking back through post 1950 history, I can only find five prior occasions in which the S&P 500 has advanced 25% in less than a Quarter and none of those five occasions were anywhere near an impending top. Certainly, one would prefer to have more than five data points from which to draw conclusions upon which to base one’s market exposure but the magnitude and uniformity of the advances across the following 12 months in those five cases appears worthy of our respect. All five cases were positive over the following 1 to 12 months, up at least +19.2% one year later, +31.7% on average. None of the five cases experienced a –4% drawdown as measured from the signal Date.”
Through Whaley’s quant, shallow pullbacks and higher-highs are the greatest probability. Indeed, the sample size is small, but not when paired with the former quant the build the bullish case both near and interim-term. Last, but not least, with some updated commentary as follows…
Since the quant triggered on July 3rd, the 2-month forward positivity rate is 100%, and considering August Republican Post-Election has never delivered a positive return, these 2 quants have a bit of a conflict and both are small sample sizes please at 6 and 4 samples respectively. 6,279 is the signal/date price. I’m of the opinion that if the White House Administration doesn’t lend endogenous headlines for the market to consider, the Whaley quant and price trend will overpower the August Post-Election quant performance.
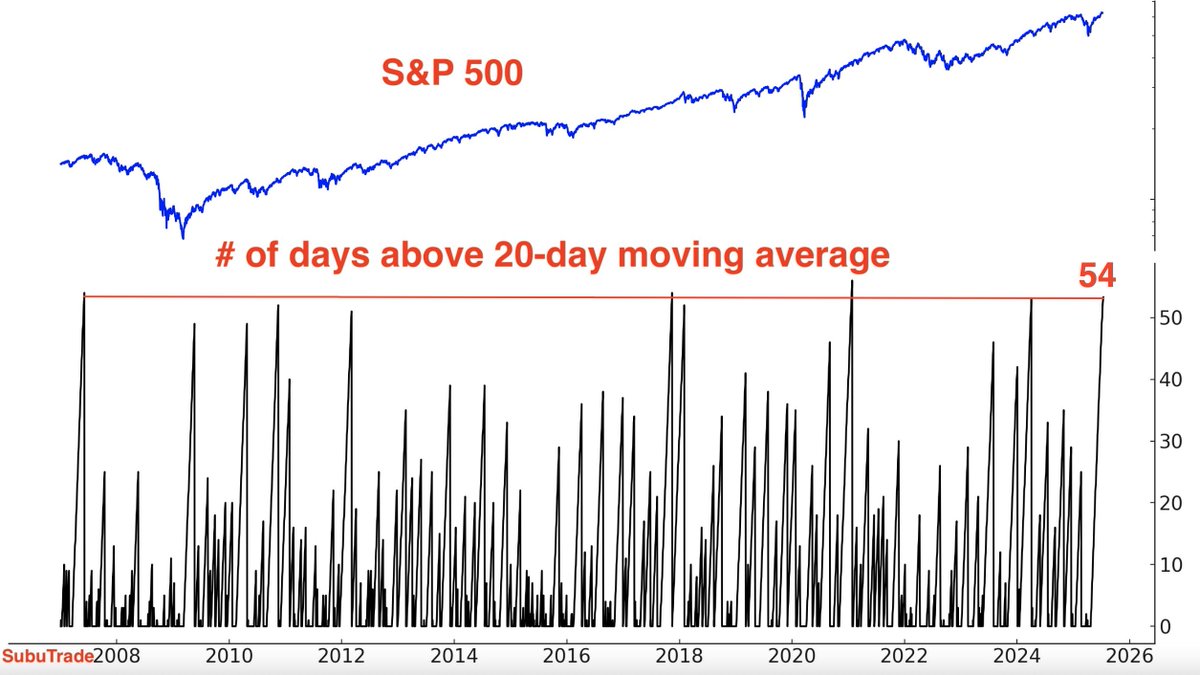
“S&P 500 is now above its 20-DMA for 58 straight days (as of July 18, 2025). Even the hottest bull markets don’t find SPX maintaining such overextended conditions without a pullback below the moving average in short order. This is a bullish signal overall, and over the forward 3-month period (October 2025). Higher 100% of the time per Subu Trade. S&P 500 closed at 6,296 on the signal date, anything below this price between July 18th and October 18th looks like a buying opportunity.”

Direct quote from Finom Group’s “Fall Months and Balancing Macro-Market Risks″ Report (August 10th, 2025):
Between now and October 18th I can certainly envision the S&P 500 falling back below the signal price of 6,296, and I expect it to do so. I’m content to maintain low expectations, and if the market wants to outperform those expectations, I’m long the market anyway. It’s a win-win state of mind. Maybe the inflation data to be disseminated by the BLS next week is too hot or maybe the Gamma expression from monthly OP/EX disrupts the bullish price trend near-term? If the Fed is on the sidelines at worst, cutting in the future at best, and earnings growth continues to update higher and higher each passing week…
… I remain a willing and able dip-buyer.
Direct quote from Finom Group’s “Reflation Concerns Prove Short-Lived” Report (August 17th, 2025):
So a couple of things regarding the Whaley/Subu Trades quant and looking for an August positive/negative return. The 2-month forward signal date would actually land in week 1 of September. But… the signal trigger price is 6,279 and only -.85% below the July 31st closing price. For which it would then have to rally quickly if the quant is to stay perfect from that first week of September to produce a positive return that same week, proving better than 6,279. If the market does indeed fall back to 6,279, that would represent nearly a -3% pullback, and well within the realm of probabilities outlined in a recent note from Goldman Sachs:
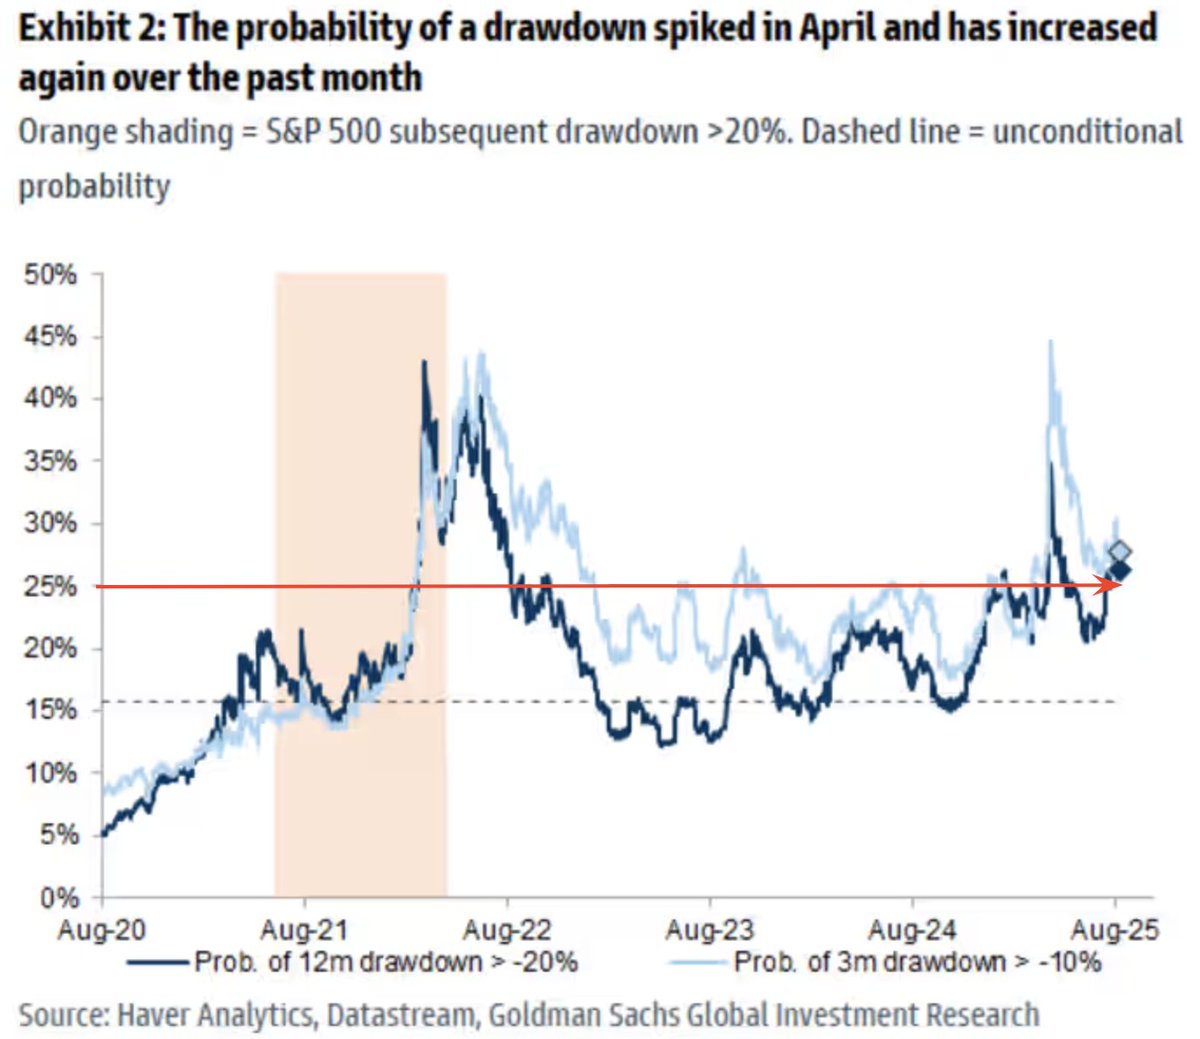
Goldman Sachs: “S&P 500’s Drawdown Probability Index has risen to highest level since April, at greater than 25%. While that may seem like a low probability, crossing this threshold has resulted in 3-5% pullback 85% of all occurrences.”
Pushing to the forefront the idea that a pullback greater than the more recent -2.3% and -2.5% pullbacks is the fact that the S&P 500 hasn’t achieved a -5% pullback in 81 days now. This speaks to the extended duration and magnitude of the bull market recovery since April 8th.
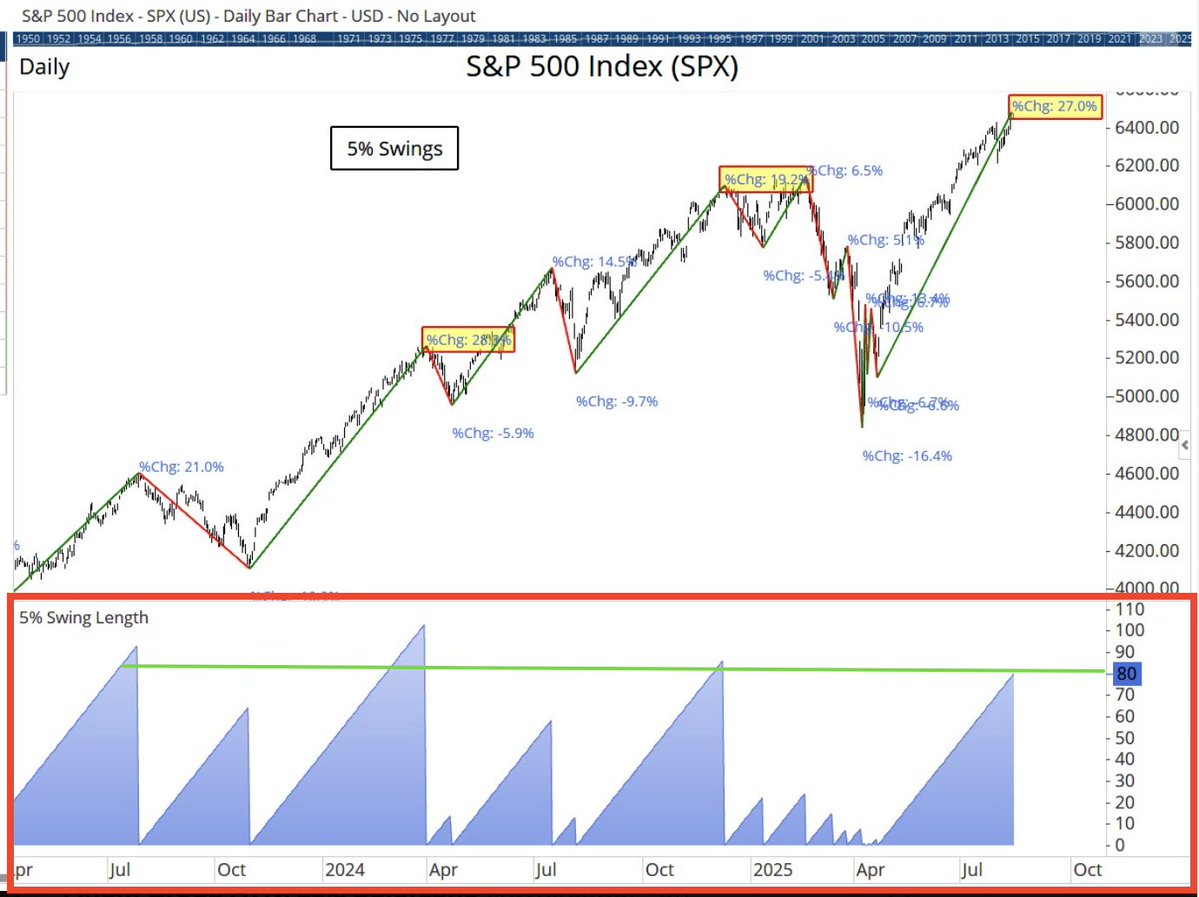
While it may seem daunting to read about the probabilities for a pull back often in this year’s macro-market Research Reports, the uptrend has been rare for both its strength and duration without a “meaningful” pullback. This is evidenced in the small sample size of the Wayne Whaley quant. In other words, it is what it is, out of our control and we should approach analysis with what the market delivers, not what we want to see or hear from the analytical exercise.
Moreover, as it pertains to the Optima chart above (bottom panel), over the last several years an 80+ day rally without a 5% pullback has usually been around the time period where one presents itself. The median 5% pullback occurred at 88 days with the longest period without a 5% pullback last 103 days.
Direct quote from Finom Group’s “Summer Setback and Autumn Fall″ Report (August 3rd, 2025):
If you are looking for signs of trouble brewing in the stock market, this is my favorite chart to watch.


Direct quote from Finom Group’s “Fall Months and Balancing Macro-Market Risks″ Report (August 10th, 2025):
Stay The Course 🧭 Don’t Fumble On The Goal Line 🏈
Good weekend folks! Recalling and reminding Finom Group investors/traders that we recently offered an updated S&P 500 price target objective of 6,475 by year-end 2025:

“To reiterate, the analysis continues to favor the bulls, and we continue to discover trend analysis and data that favors higher prices by year-end 2025. As such, we believe it is appropriate to solidify a new year-end S&P 500 price objective of 6,475. This may prove conservative, but also serves to recognize the propensity of the White House Administration to deliver endogenous impacts on the market/economy, beyond our control. As a reminder, price objectives are not guarantees, but guides predicated on the variables disseminated within our analytics.
This target objective was update at month-end August to reflect a 6-month price target objective of 6,800 or by Q1 2026-end!
Direct quote from Finom Group’s “Fall Months and Balancing Macro-Market Risks″ Report (August 10th, 2025):
Throughout the course of the trading year we are analyzing and tracking a plethora of quant data, consistent and correlated to the market price and/or economic activity. At some points and time during the calendar year, former quants will prove a lesser focus, ideally (because price has distanced from trigger date price positively). If we consider the Zweig Breadth Thrust signal triggered in the final week of April and then the accompanying deGraaf Breadth Thrust in May, the S&P 500 has advanced materially beyond the trigger date/price. As such, we simply recognize their individual price triggers as baselines for which the market should remain above in the forward 6 and 12-month periods.
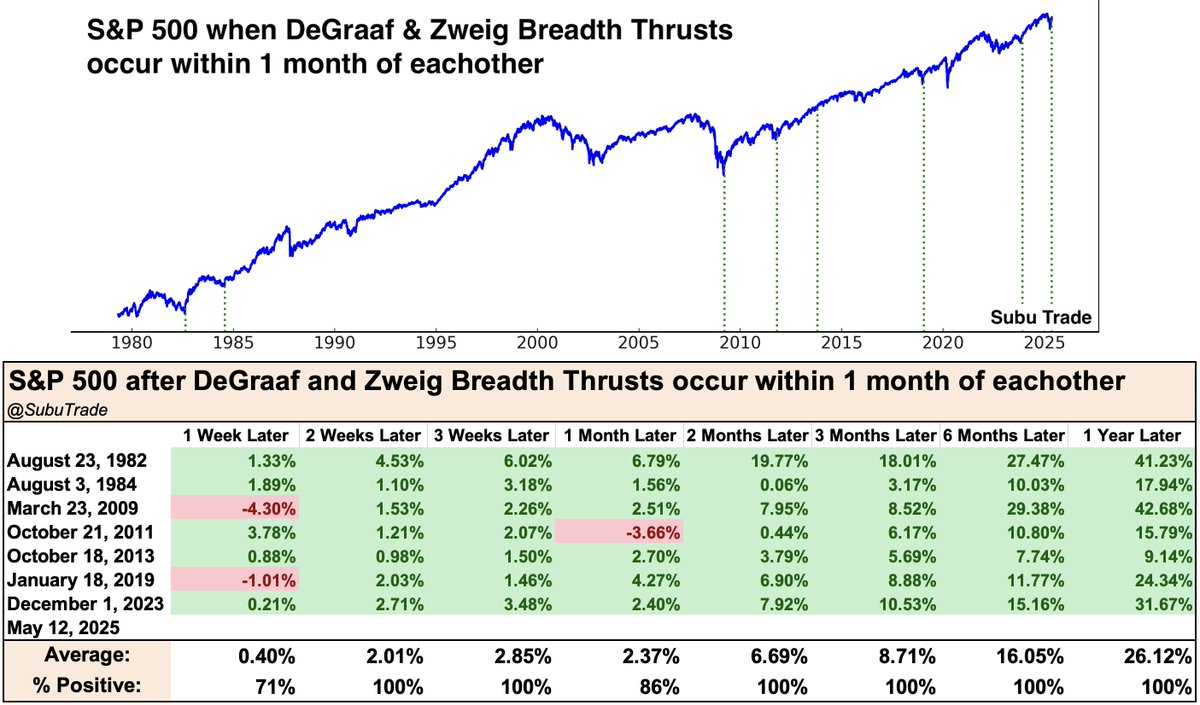
“As of May 12, 2025, both a deGraaf and Zweig Breadth Thrust were triggered during the market recovery cycle. One-month forward from the signal date and price, indeed, the S&P 500 delivered a positive return as of this past week and by finishing above the signal date price of 5,844 by Friday’s closing bell. In suggesting the downside could prove limited, the combined breadth thrust study here has a 100% positivity rate 2-months forward from the signal date, offering a 6.7% average return to boot. We’ll know more over the coming trading days whether or not this combined breadth thrust study will remain perfect.
Moreover and in looking at this combined quant study, it doesn’t speak to lower prices surviving 6-months forward, which takes the markets through year-end. The signal date price of 5,844 is ~7% below this past Friday’s closing price (6,279). Again, this is the best consideration as to how investors should perceive and behave when cheaper prices are presented between now and year-end.”
That 5,844 level is now just a baseline understanding of what investors should do if for some reason the S&P 500 dips underneath the level in the forward 6-12 months. Given the distance between the baseline price and this past week’s closing price, it doesn’t inform much about the near-term. Could the S&P 500 correct some -10% back down to 5,844? Certainly; but we have other quant data studied in past weekend reports suggesting even that is a low probability through year-end. So again, the former Breadth Thrust quants aren’t terribly informative or relevant near-term, but we know they are still “in play” should an endogenous/exogenous event beset markets.
Direct quote from Finom Group’s “Fall Months and Balancing Macro-Market Risks″ Report (August 10th, 2025):
While the shine comes off the Zweig Breadth Thrust given distance in price from the signal date/price as of the present day, we can’t overlook another fact of the Zweig Breadth Thrust which also lends to the macroeconomic outlook.

Unfortunately, when the financial media megaphones a negative/pessimistic narrative, investors allow such narratives to pervade greater, more historically accurate data. Referencing the Zweig Breadth Thrust quant study above:
The fact that markets express technical bear markets and not just recessionary bear markets allows the macro-tourists to lay claim to the old adage “markets have priced 9 of the last 4 recessions.” The problem with this type of attack on forward discounting markets and the accuracy of that pricing mechanism is that it DOES NOT work in the opposite direction, i.e. when markets price out continued economic expansion as opposed to recession. In this forward discounting operation, the market has NEVER BEEN wrong. If it has priced forward a 12-month economic expansion, and in post-WWII era, it has been right EVERY. SINGLE. TIME. (Zweig Breadth Thrust (ZBT)) With that, I have a saying that has also proven 100% accurate: “Everyone has access to the economic data, but not everyone can sequence and weigh the data properly and with respect to delivering an effective outlook. Sequencing/weighing is the upmost priority.”
Direct quote from Finom Group’s “Fall Months and Balancing Macro-Market Risks″ Report (August 10th, 2025):
Yes, the equity market is a good predictor of forward economic conditions when it is pricing positive economic outcomes. Additionally, even stock market quant data and trends can inform of economic peaks or the lack thereof a market peak in the case of the present bull market trend:
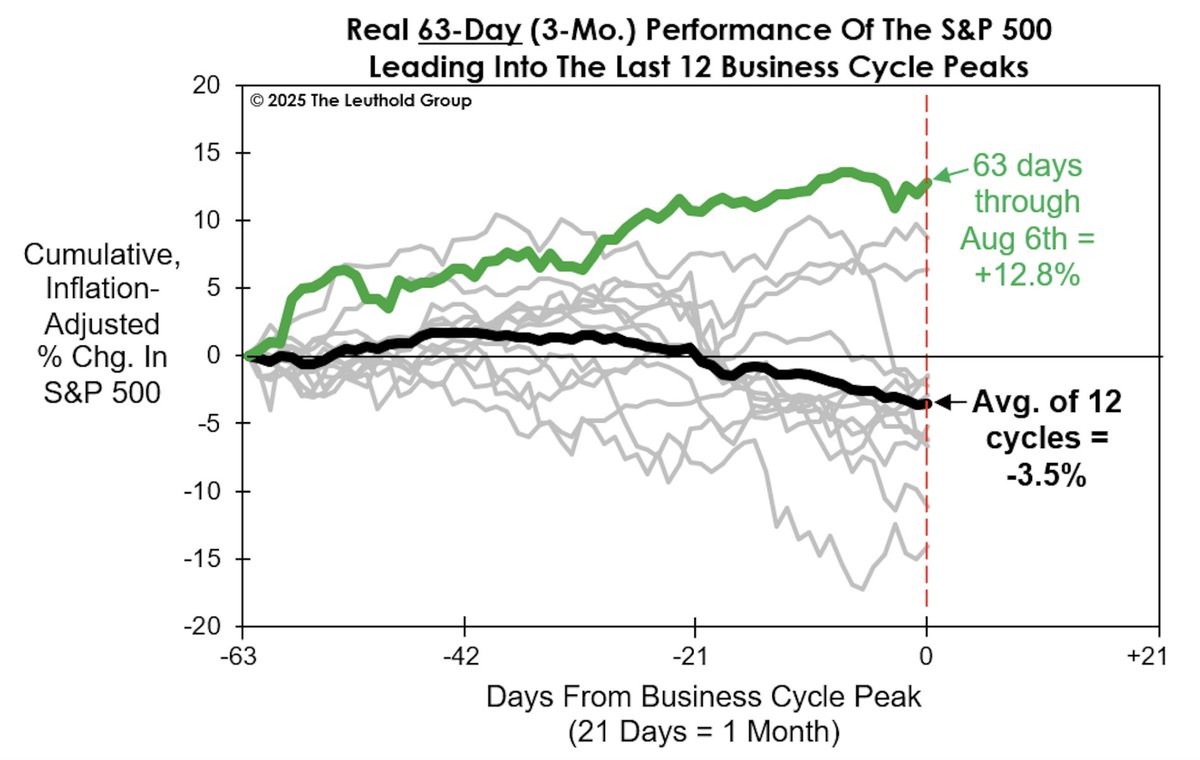
The S&P 500’s twelve-month momentum provides a good measure of the stock market wealth effect, and that stamina still looks sufficient to forestall an imminent slide into recession. At eleven of the past twelve business cycle peaks, the trailing one-year real performance of the S&P 500 was in the red (the lone exception being 2020). The argument that the stock market is too strong for an impending economic peak is also supported by its current short-term (three-month chart above) momentum. The “real” S&P 500 is up +12.8% over that span, putting it around 16% above the average path leading into the prior 12 cycle peaks.
The caveat is that, while the stock market is an excellent forecasting tool, it’s extremely myopic: The wealth effect that we believe is now the economy’s main source of nourishment can be cut off at any time. In other words, the only thing data and trends can’t predict is exogeny/endogeny.
Direct quote from Finom Group’s “Fall Months and Balancing Macro-Market Risks″ Report (August 10th, 2025):
The aforementioned is a bit of a teaching moment, and realized by the following quant study we review and push to the forefront through year-end:

There’s a highly opinionated, high probability that August proves a tumultuous month, but we encourage Finom Group investors/traders to focus on the facts within the macro-market data that is embedded within each quantitative study. As such, the July 23, 2025 trigger date/price of the study above remain a major focus through year-end 2025.
“With both the S&P 500 and NYSE Daily Advance/Decline Line having made 52-week highs this month (July), the historical odds for further gains through year-end are very, very good. Our technical and quantitative framework of data inform of higher-highs by year-end 2025. The S&P 500 has never had a July confirming signal and avoided higher-highs, with an average return of +6.4%. Even the lesser returns identified in the table would likely see the S&P 500 challenging the 6,400s. The big picture is more important than the next week or even the next month!✅ “
The S&P 500 has already challenged the 6,400s and found resistance, but the closing price for the S&P 500 on the trigger date of the quant was 6,358. Because this quant is more proximate, the price is also more relevant than former quants outlined. Recognizing that the positivity rate is 100% for the remainder of the year and the trigger price was 6,358, now informs that investors should be buyers of any dip below 6,358. This baseline price has already been breached to the downside once, found dip-buyers, and rewarded those dip-buyers all within the last 6 trading-days. I would be of the opinion that this baseline price level will be breached again by year-end, and reward dip-buyer activity all the same.

This is just one of several inputs that I had previously considered with respect to our recently updated 6,475 year-end price target objective for the S&P 500.
“If we take the technicals at face value and combine them with the approaching fund flow weakening period ahead, we should anticipate some consolidation near-term. The last time I said that the markets fell in the week ahead… by less than -.3%. I say this to reinforce that any pullback, ANY PULLBACK at all… be on your best behavior folks! The market message is UNAMBIGUOUSLY very bullish longer-term! Down is good, UP IS SIMPLY BETTER 💯🎯”
And if all of that wasn’t enough to inform of higher prices and a higher S&P 500 price target objective by year-end, we outline the quant informing about S&P 500 forward peaks after an NYSE A/D Line all-time high, recognizing breadth lead-times for bull market peaks and as follows (table not updated since 2024 will impact median and averages positively):
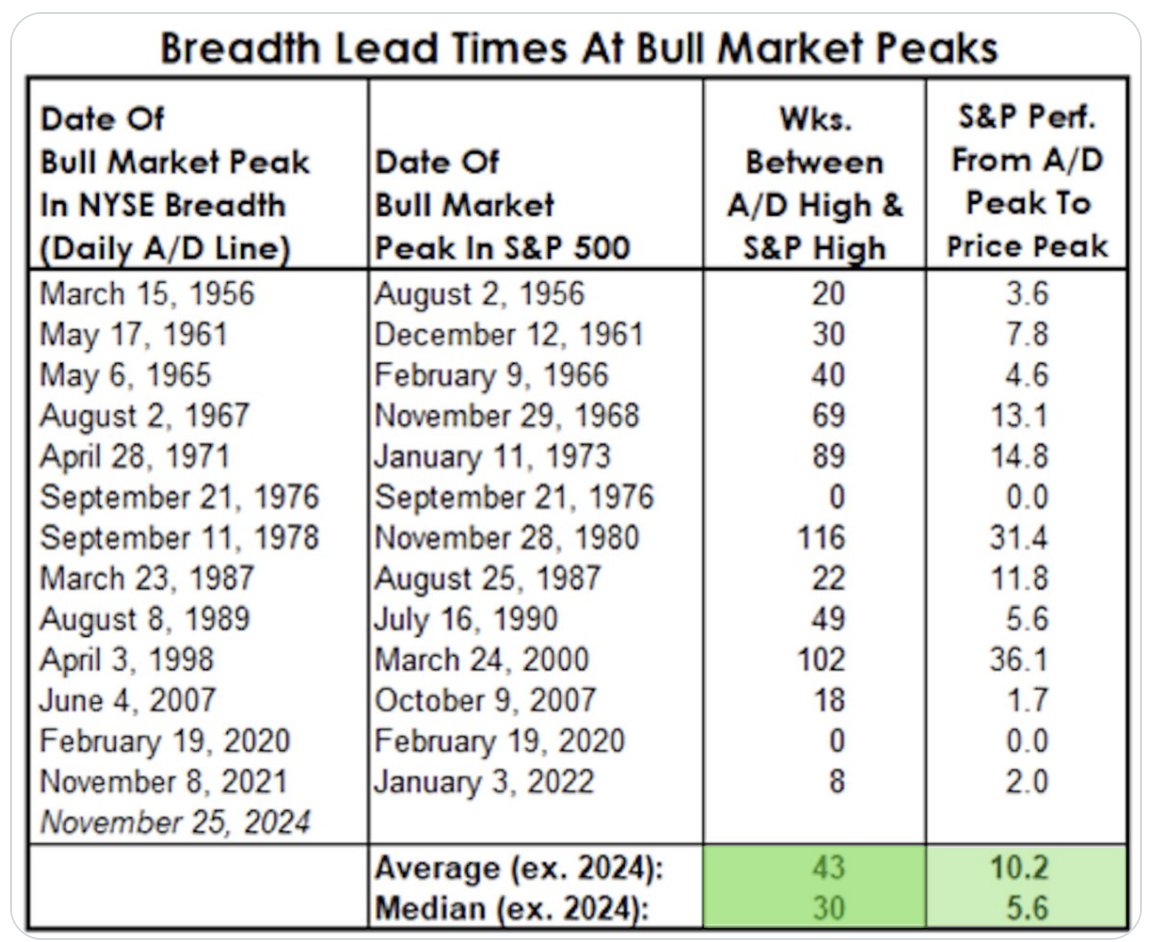
It’s not impossible, but it would be rare for the S&P 500 to express a top when the NYSE A/D Line just made an all-time high 3 days ago. The median lead time to the S&P 500 top is roughly 7 months or 30 weeks. For THE top to have occurred this past week would demand exogeny/endogeny. Moreover, the average return (after A/D Line High) to the S&P 500 ultimate top is 10.2% for which the S&P 500 is negative since the NYSE A/D Line recent all-time high. Keep in mind the new quant date price for NYSE A/D Line all-time high is 6,468 on the S&P 500 folks!
Direct quote from Finom Group’s “Fall Months and Balancing Macro-Market Risks″ Report (August 10th, 2025):
My hope, and on behalf of Finom Group, is that our members absorb the weekly macro-market Research Reports from the perspective of a student, while working on the job as an investor/trader. Ideally as an investor first, because our studies inform that all good traders trade with a long-term time horizon as a baseline premise. In other words, trade only what you are willing to own/invest. Generally, this is the best heuristic and mindset for proficient trading. Additionally, this expression offered is to humbly remind our members that none of our disseminations are meant to be braggadocios and always hope to “land the education plane” on open minds, eyes and ears! More on this in a moment as I would be remiss if I didn’t steady the plane with a Nasdaq quant recently having triggered at the end of July…

Something rare just happened for the Nasdaq Composite (COMPQ). In July, the Growth-heavy index achieved at least 10 new all-time highs. Something it has only done 3 other times. Each time in the past, the index fell in August, but 4 and 12 months later the index was higher EVERY. SINGLE. TIME 💯. The Nasdaq closing value for the month of July was 21,122, which is only a few percentage points below this past week’s closing value as we head into an inflation data and monthly Op/EX week. We’ll see if the Nasdaq can buck the trend and finish positive in August or if sample size limitations allow for the first positive monthly close come August 31st. Speaking of the Nasdaq and Growth stocks…
(*sample size is not controllable, as it would be in other industry studies)
The Nasdaq is a perfect 500 points above the signal date/closing price and 1-month forward positivity rate is 0%, in a relatively small sample size of occurrences as already noted. Nasdaq can, but would need to pullback roughly -2.5% to deliver a negative forward 1-month return, which has always been the expected outcome and why would actually welcome the pullback given the forward 4 and 12 months perfect outcomes 💯. On the whole, I would suggest that the QUANT data informs that a pullback should be the expectation and met with dip-buying behavior, but if one doesn’t come and as always, there is a message from Mr. Market being sent!
Direct quote from Finom Group’s “Fall Months and Balancing Macro-Market Risks″ Report (August 10th, 2025):
…what the leading sector and index are informing is that the bull market has transitioned to a later stage bull market cycle, whereby stock-picking is a lesser rewarded exercise. Investors would be wise to allocate new capital to sector/industry/index ETFs over stock-picking.
And then the largest industry and most heavily weighted within Technology sector is of course Semiconductors. I remain bullish on NVDA and the Semiconductor industry ETF (SMH), but would not be picking stocks from within the industry hence forth.


The stacked charts read no differently than the Technology sector, informing that stock-picking carries elevated risk that need not be taken when the Industry ETF still holds a bullish overall trend and quantitative support has compounded. Recall the former 50% Swing Up for Semiconductors disseminated within our June 29, 2025 report as follows:
“Read the below quantitative outline from Nautilus Research, which informs of 50% upswings in the Semiconductor ETF (SMH), after a bear market. The last time this 50% signal triggered was March of 2023. Semiconductors would go on to gain another +75% over the forward 12-month period.”
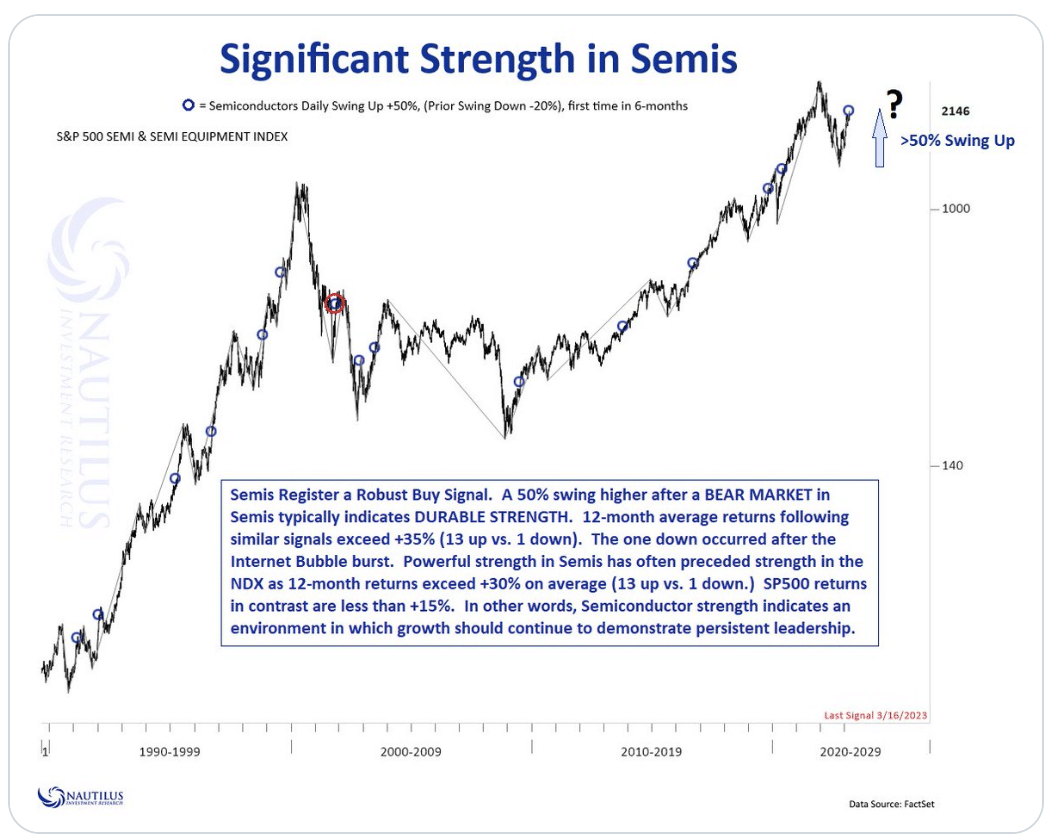
Since that quant was triggered, and the trend in Semiconductor leadership and outperformance hadn’t changed much at all, another quant triggered at the end of July. From Nautilus Research, I’m calling the combination of triggered quants the Big Semiconductor Bang Theory, after the popularized television show in syndicate.

At July’s-end, it proved the first time Semis have expressed a 4-month win streak in more than 6 months. History informs that EVERY. SINGLE. TIME. this has happened in the past (n = 18), Semis were higher 6-months forward. The average forward 6-month return was 13.55%, with the worst forward 6-month return generating slightly less than 1% in 2017. Given that SMH is slightly below the trigger date/price ($288), the ETF would be a buy until proven otherwise. There have been some pretty sharp drawdowns from the signal date/price in the past; plan accordingly!
“I still favor the Semiconductor ETF through year-end, but anticipate a bit larger pullback through the fall months. As such, I’ll wait patiently for such an outcome and allow SMH/SOXL to inform whether or not to adjust this game plan going forward and ahead of the all-important Nvidia’ earnings release to come. I have slowly been locking in profits in NVDA shares with a recent sale at $182, and would be looking to recapture exposure if $160s reappear. Otherwise, the remaining exposure will be maintained in the Golden Capital Portfolio.”
Direct quote from Finom Group’s “Fall Months and Balancing Macro-Market Risks″ Report (August 10th, 2025):
Further evidence of potentially modest pullbacks are the following quants from Nautilus Research, recognizing the abbreviated time period for which the S&P 500 and Nasdaq have achieved their recovery and new all-time highs:

- The S&P 500 gained 25% after falling at least 15%
- Bullish trigger 7/3/2025 and price 6,279
- 6-months forward SPX has never been lower i.e. 100% positivity rate.
- Average return from signal date = +8.17%
- If achieved, SPX would = 6,791
Direct quote from Finom Group’s “Reflation Concerns Prove Short-Lived” Report (August 17th, 2025):
Let’s see if we can explain what may be going on here and why the equity markets seemingly ignored the undeniably reflationary data. First, however, let’s consider something Seth had offered in the Finom Group Trading Room, publicly on X, and published by Luis in the Finom Group weekly Market Mania article, as follows:

“Are we going to get just the right amount of reflation, in just the right product/services categories where there remains the right amount of pricing power and the right amount of consumption slack to further fuel the right amount of accelerating earnings power?”
Good outcomes are more frequent than bad outcomes!”
~ Seth Golden, Chief Market Strategist at Finom Group
Direct quote from Finom Group’s “Reflation Concerns Prove Short-Lived” Report (August 17th, 2025):
And from a fundamental perspective…

Everything has to really take a giant poop💩🚽 in order to prove THE top is in and even a correction couldn’t recover to new highs by year-end! Or in collegiate graduate terms, the fundamentals, technicals and quants have to fail simultaneously.
Are valuations high? They are at all-time highs relative to history (ex-Dotcom), YES! But markets aren’t moved by the Price/Earnings (P/E) Ratio. That’s just for folks to complain about and usually those folks who missed a rather sizable market recovery to all-time highs, with the P/E Ratio following in hot pursuit.
The chart below evidences that the P/E ratio is not a constant variable but a static variable. Over time it expands/increases. The major “thing” that obscures this fact and understanding is the Dotcom bubble a decade thereafter, which would be labeled a secular bear market. Do you think you should base your whole understanding about how valuations impact markets based on an anomalistic time period in the market? Sadly, a goodly amount of investors do so, while compounding opportunity cost… with each passing year.

The best model for absorbing market functionality (Finom Group’s opinion) is: Earnings > Price > P/E. And the best model for absorbing P/E functionality in the market is: P/E fear = Volatility or VIX
Here is another chart from Bank of America that basically validates why investors who fear high P/E Ratios have reason to “complain”:
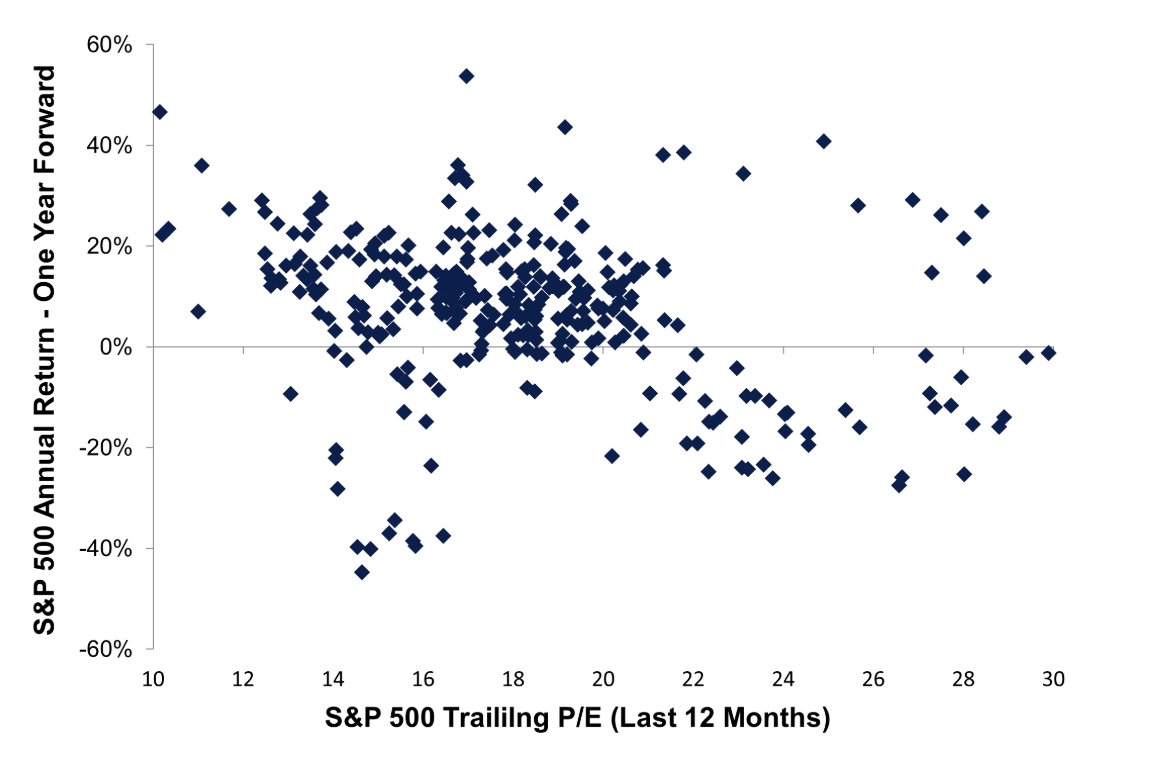
While P/E Ratios offer reasonable 10-year S&P 500 return probabilities, the 1-year forward P/E Ratios give you no idea of what to expect, none whatsoever. Reality is that looking at P/Es for 10-year returns is 2nd most useless measure of forward return expectations, 2nd… and I’m old enough to remember 😉 2023’s P/E Ratio of 20.5X was a deal breaker for investors.Today the S&P 500 forward 12-month P/E Ratio is 22.5X. A more mathematical detraction from the value of the P/E Ratio informs that the P/E Ratio and 1-year forward return has a -.15 correlation coefficient.
Direct quote from Finom Group’s “Reflation Concerns Prove Short-Lived” Report (August 17th, 2025):
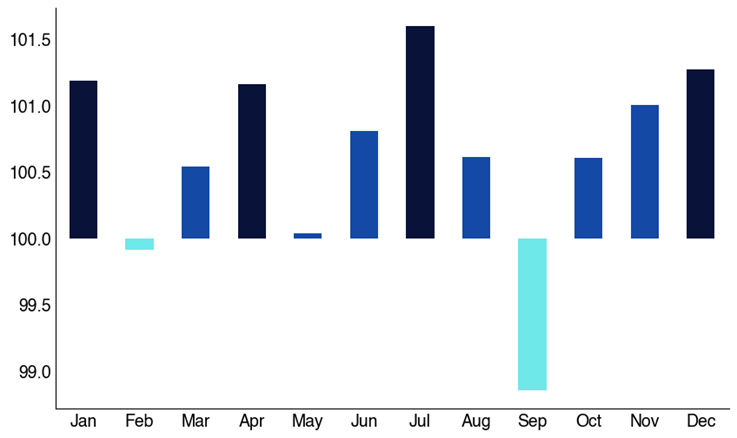
There’s a point I’d like to make as it pertains to the month of August probabilities. Recall this chart of July’s S&P 500 performance relative to the historic July monthly price path, offered inside our July 27, 2025 macro-market Research Report, as follows:

The 2025 performance deviated around the middle of the month, and never actually dipped until the final days of the month, culminating in an even bigger 1-day decline on August 1st (-1.25%) and by way of the July monthly Nonfarm Payroll report. The economic data within the Nonfarm Payroll report seemed bad enough to stir recession fears, as also evidenced in a big drop in the 10-year Treasury yield that day. The reason I bring this up is to connect the dots. So long as recession fears remain sidelined, the corporate/consumer fundamentals remain steady, and the reflation reality proves innocuous, investors/traders may not get “pullbacks greater than 3-5% through year-end. In other words, the bad inflation data this past week didn’t stoke recessionary fears like the former Nonfarm Payroll report had, and which was demonstrated in markets’ reactions, which otherwise reinforce strong corporate/consumer fundamentals and prove… “just the right amount of transitory inflation, in just the right products/services…” The price action in response to the data is a heuristic we think sends investors/traders a valuable message.
Direct quote from Finom Group’s “Reflation Concerns Prove Short-Lived” Report (August 17th, 2025):
All the data and analytics to-date still inform of higher prices and any dips are likely opportunities to compound returns through year-end. As such, I think investors are well-informed to fashion such an outlook and express such dip-buying behaviors when they present themselves.
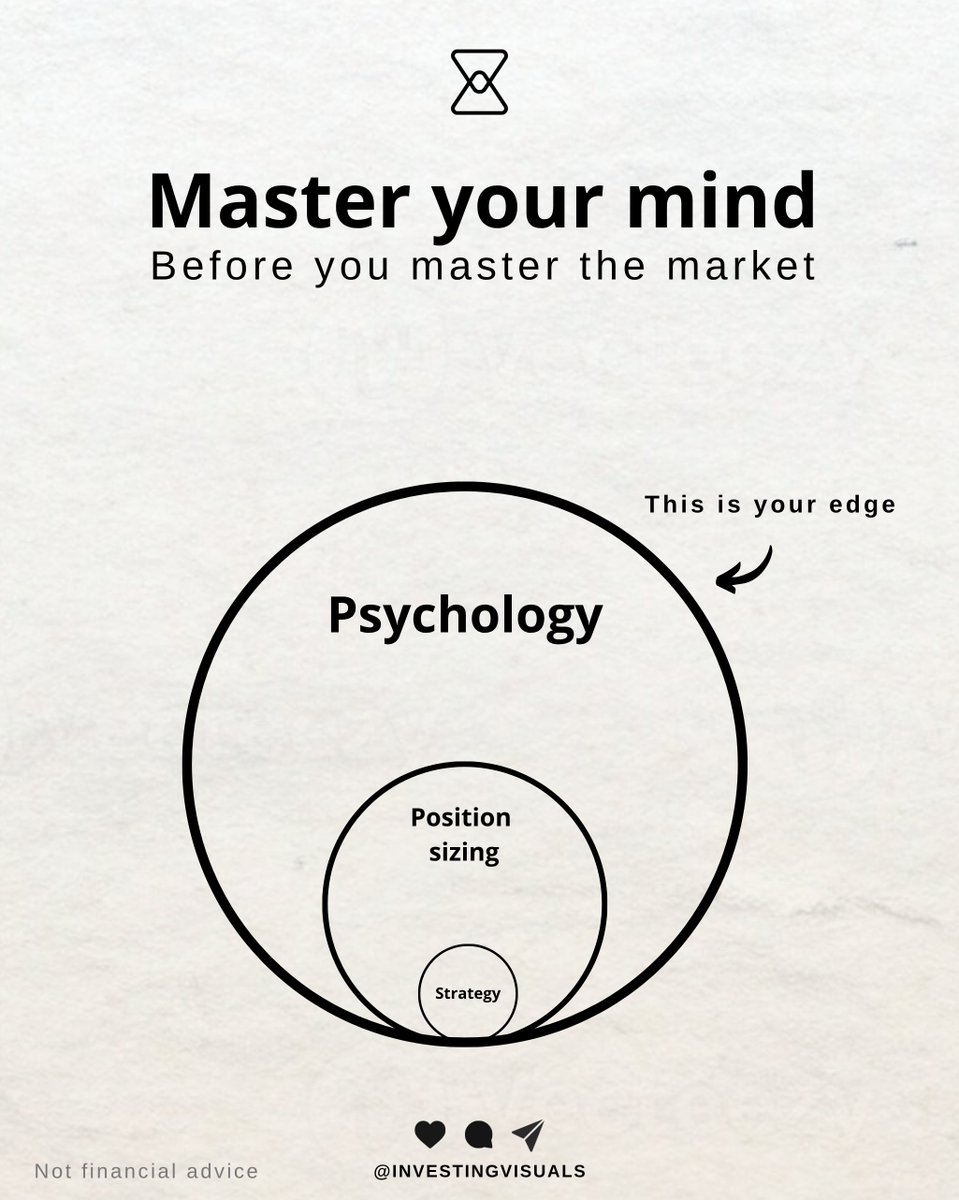
If you’re looking for trading tips and/or small wins daily/weekly, you’ve come to the right place as our Trade Alert service is unrivaled and expressed each week with a 90%+ hit rate. BUT, but your greatest value as a Finom Group member is absorbed through our education service provided with each weekly Research Report. Your answers to investing well are all within the compilation of reports that read and make part of your investing process. Don’t read the reports, don’t have the right investor psychology and emotional quotient. Read the reports, and you’ll have a time-tested process to get through all market conditions with profits, even if that means it will take time to realize those profits. The graphic above speaks volumes folks!
Where we will land on August 31st is a bit of a toss-up, but I’m a buyer of all dips regardless and lean in favor of a bullish August return (not a prediction, a sharing). If I’m wrong, then I’m buying with a longer-term mindset and finding desirable prices.
In 2024, August proved a rough month, and a more positive September return. Maybe the monthly price action flips in 2025, with a strong August and a rough, seasonally appropriate September “meaningful” pullback?
Direct quote from Finom Group’s “Reflation Concerns Prove Short-Lived” Report (August 17th, 2025):
From a big picture perspective and from what we consider a late cycle macro-bull market, the 8 Bellwether indicators still show 5 (now 7, just missing Russell 2000), in their defined bullish trend and only 3 with bearish divergences.
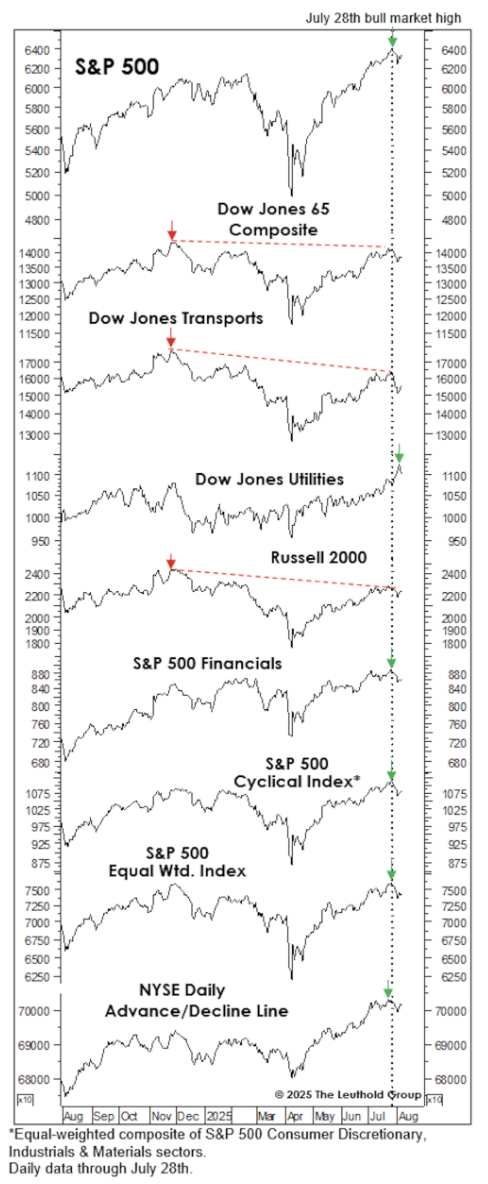
The stock market looks—perhaps superficially—better in late summer than it did at its “old” high on February 19th. It’s far from cheap but is no more expensive than in February. S&P 500 Forward EPS, Normalized EPS, Cash Flows, etc., have risen in stride with prices. Technically speaking, the S&P 500’s late-July highs were broader than those of February: The NYSE Daily Advance/Decline Line, Equal Weighted S&P 500, S&P 500 Financials, and S&P 500 Cyclical Composite all reached new bull market highs in late July. At the February highs, those same indexes (and a few others) were laggards.
However, seeing 3 “negative divergences” at the final bull market peak is typical. The table below shows that the least-well-telegraphed recent bull market peak was February 2020, when only 3 of the eight bellwethers diverged. That’s understandable: We wouldn’t expect those indexes to sniff out something as unfathomable as the COVID virus. However, at the 3 other pre-recessionary bull market peaks since 1990, a minimum of 7 of the 8 Warnings Flags were flying, like February 2025 throwing off a major warning signal.

The 8 Bellwethers suggest investors who are found skittish for buying dips in this bull market cycle demands little courage until at least 5 of the 8 Bellwethers offer a bearish divergence. In between now and then, buying index ETFs is a LOW RISK exercise, in moderation of course.
Direct quote from Finom Group’s “Reflation Concerns Prove Short-Lived” Report (August 17th, 2025):
Saving the best for last, maybe… and as it relates to confidently buying the dip and due diligence exercises? Check out the latest Wayne Whaley price trend quant study below:
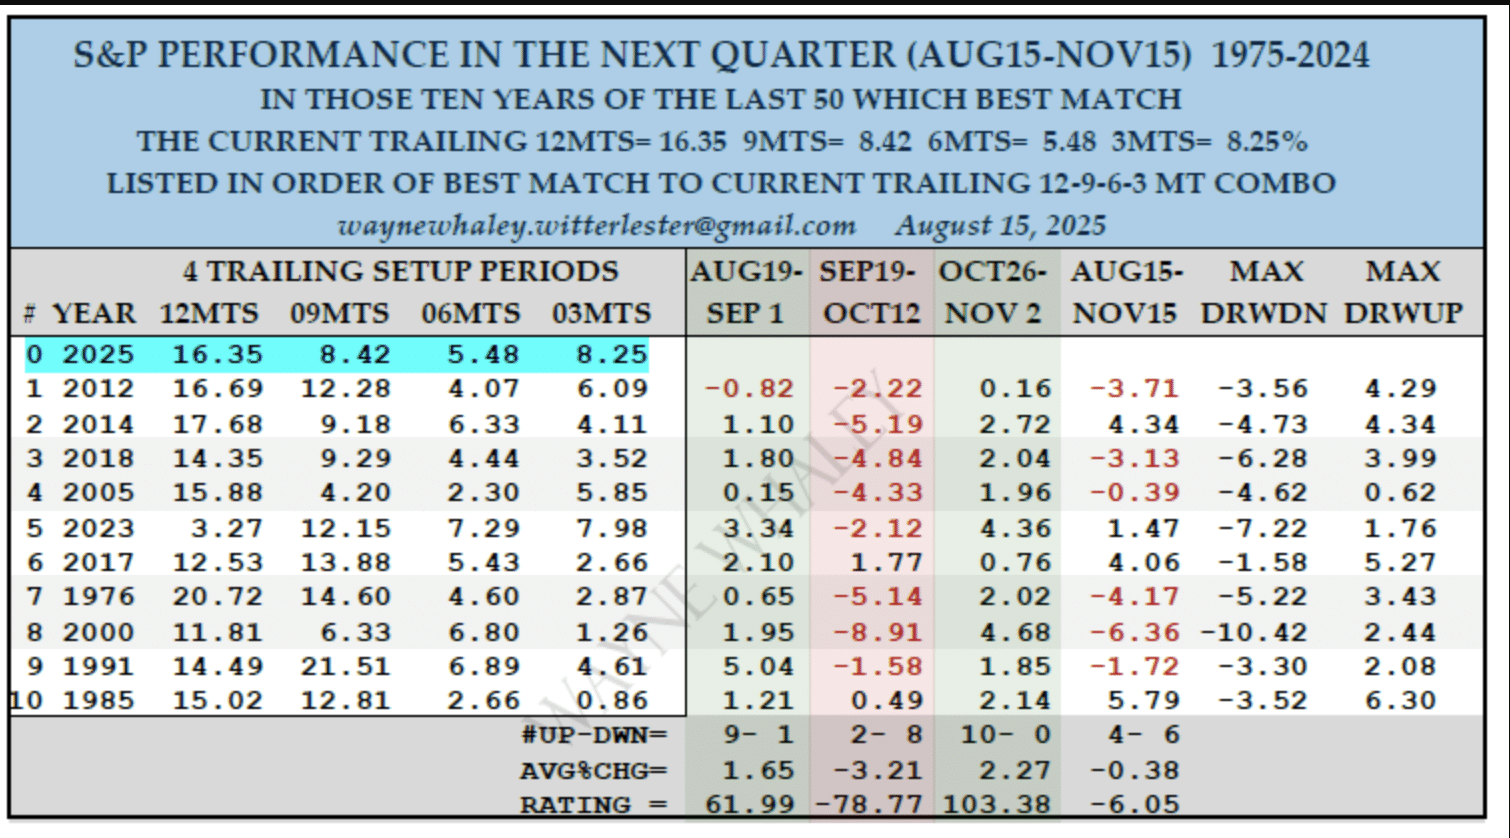
“This scan ranks the last 50 years in order of best match on the current day of the year to the current trailing 12, 9, 6 and 3 month performance. The current 16.35, 8.42, 5.48 & 8.25% trails look a lot like the 16.69, 12.28, 4.07 & 6.09% observed in 2012, as well as 2014 & 2018. The forward performance over the next Quarter in the top 10 matches was a very pedestrian 4-6 for an average 0.38% loss. However, the S&P 500 was 9-1 in the upcoming August 19 – September 01 timeframe for an average 1.65% gain. Don’t discard or forget the October 26 – November 2 week either at a perfect 10-0.”
Indeed, on August 18th, the day before the start of the forward time period, S&P 500 closed at 6,449. It traveled as high as 6,501 (closing basis) before settling the month of August at 6,460. While narrowly above the August 18th value, the positivity rate will now improve to 10-1 and having rewarded savvy investors who bought any price below 6,449 over the last couple of weeks (low closing value 6,370). In look at the next setup period from the quant above, it doesn’t speak well for much of September and into the first couple of trading weeks in October, but that specific time period relents to more favorable returns in the October 26 – November 2nd time period.
Direct quote from Finom Group’s “Reflation Concerns Prove Short-Lived” Report (August 17th, 2025):
Although we still see the window for cutting rates as open, it is no longer wide open, given the recent inflation data. Additionally, even if the Fed should cut rates at the September or November meetings, we can’t dismiss that this may not drive long-end Treasury yields lower, and did not do so the last cutting cycle from September of 2024.

The 10-year Treasury yield rose its greatest amount after the first rate cut of the cycle and since 1989. This was a rebuking of the rate cut by the bond market, and a rarity it at that. Should the Fed actually cut rates again and during a reflation period, it is difficult to “pin down” what the bond market reaction would prove to be under those conditions. Additionally, a not so fun fact evidences that a rate cut under the current inflation conditions is a LOW probability!
“The Fed has only cut rates when Core CPI was above 3%…. 1 time, just once and that one time Core CPI was declining in 1989… 1 time! Fed Fund Futures are purely sentimental until the night before the FOMC rate announcement!” ~Sonu Vargheese
Until proven otherwise, we would consider the least antagonistic and/or impactful action from the Federal Reserve would be that of sustaining the PAUSE, unless labor market conditions weaken.With a rangebound 10-year Treasury yield since the beginning of 2025, we think that is also the message from the bond market. I’m in buy-mode folks, and looking for dips to do so!
Direct quote from Finom Group’s “April to-date Markets Float Like A Butterfly; Here Comes The September Bee Sting?” Report (August 31st, 2025):
As shown, the Post GFC (red) bull market vs the Post Covid (green) bull markets look extremely similar, shy of a couple brief divergences that quickly aligned thereafter. If the analogue plays out like it has been to-date, the S&P 500 would finish the year around 6,650, which is where we feel more comfortable establishing an updated sentimental price objective(will cement a new price objective in September).
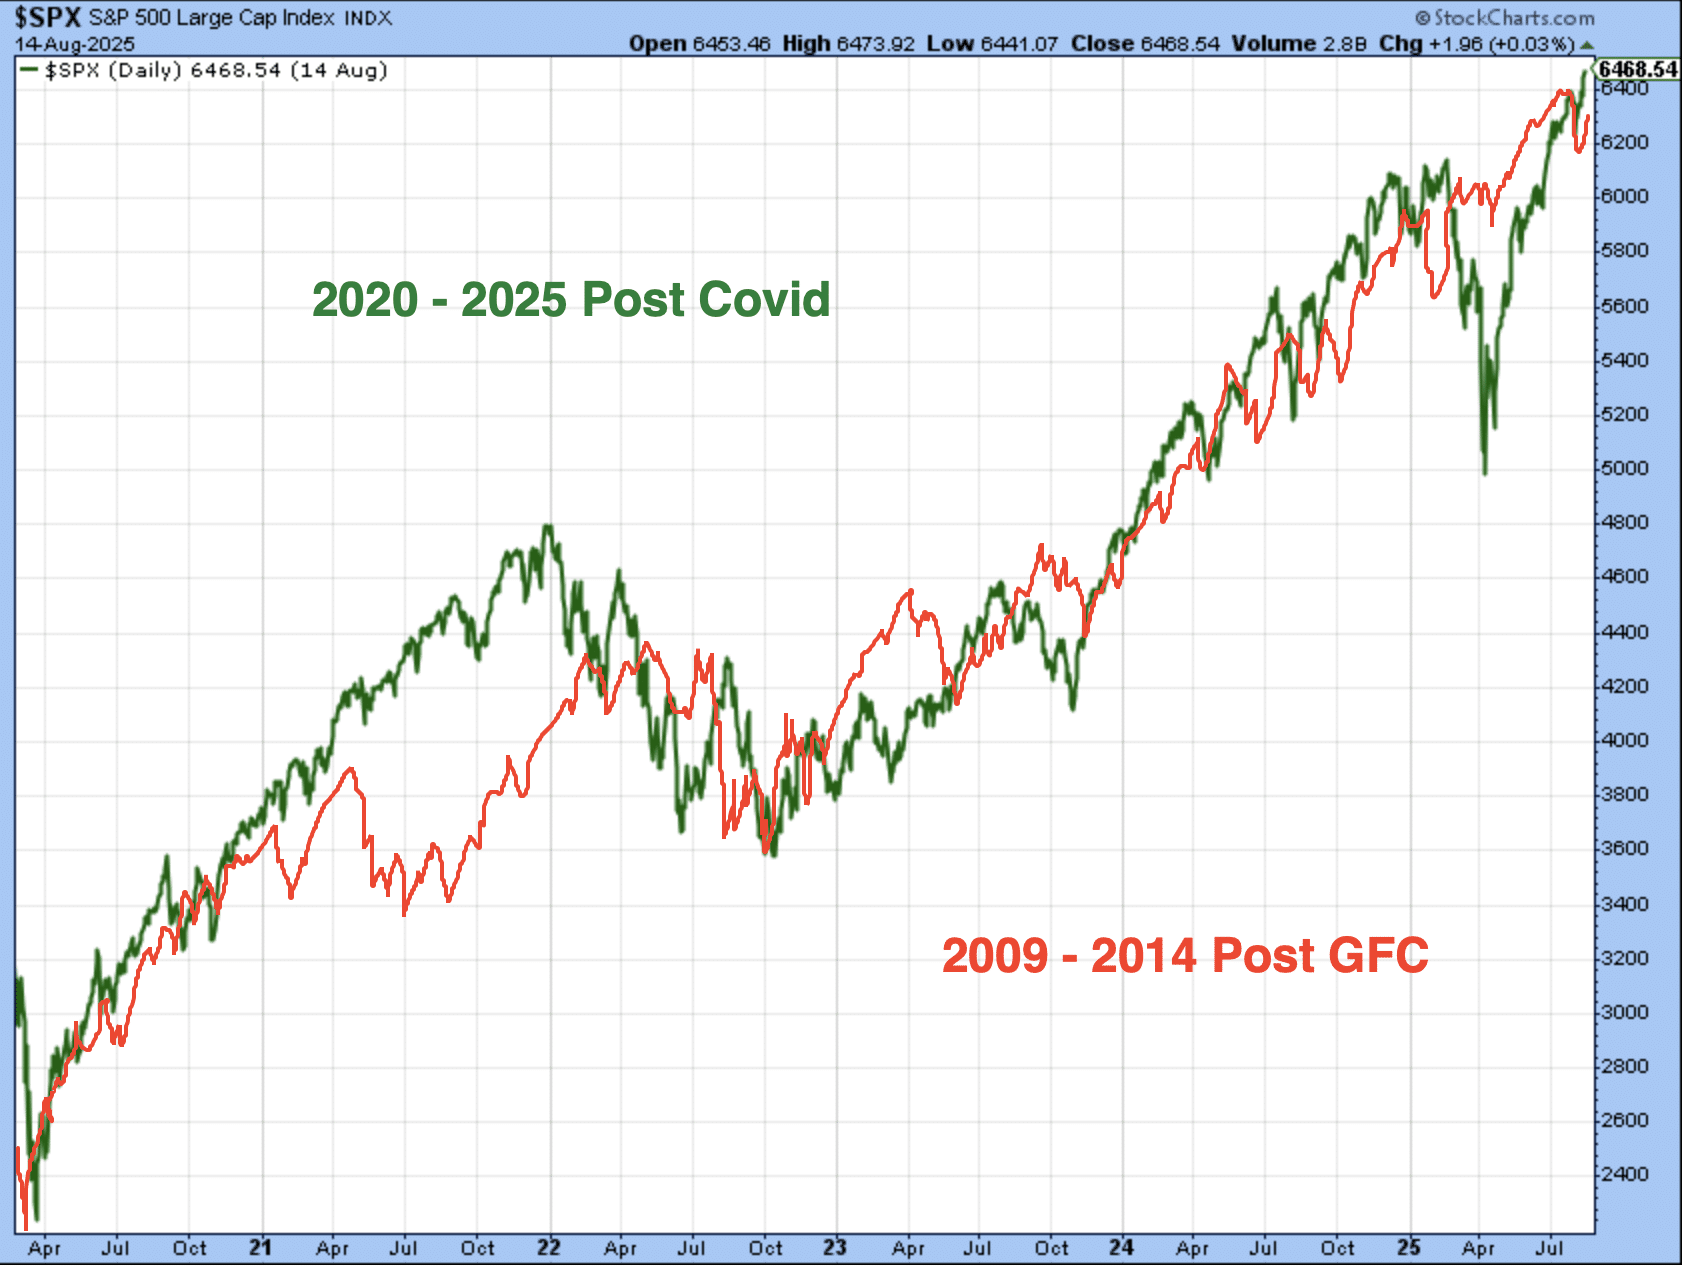
While many will view such analogues as coincidental at best and nonsense at worst, we choose to recognize such analogues as validation of scheduled fund flows and algorithmic investing. In other words, much of what we experience is validating both human behavior and pre-determined algorithmic, scheduled fund flows. With the dreaded “man-splaining” out of the way, the newly cemented S&P 500 price target objective of 6,800 satisfies the year-end time period and the Q1-end of 2026 time period. Within these time parameters, we believe the weight of the evidence which includes the current 22.5X forward 12-month EPS valuation, inform that the S&P 500 should achieve at least 6,800 and absent exogeny/endogeny; if not by year-end then by Q1-end of 2026. One could simply this outlook by simply recognizing it is a 6-month price target objective.
In speaking of the already elevated P/E levels of 2025, if we think of it this way:
“A 23X EPS tells us at least 2 things: interest rates and long-term earnings growth are all highly predictable. Bull markets are powered by degrees of predictability; the greater the predictability, the higher the P/E Ratio. Often markets miss-price through volatility, but not valuation.” ~Seth Golden
Direct quote from Finom Group’s “April to-date Markets Float Like A Butterfly; Here Comes The September Bee Sting?” Report (August 31st, 2025):
Combining the 4-month win streak for the S&P 500, with September, and with remaining overextended even if not overheated market conditions, investors should be prepared for a rocky ride in September. Indeed, I do think September will sting 🐝 investors who don’t find themselves with the appropriate expectations and/or are prone to visceral headline responses. It’s unlikely that a full -10% correction will be achieved in the September to early October period, but a -5% pullback would not be considered out of the norm.
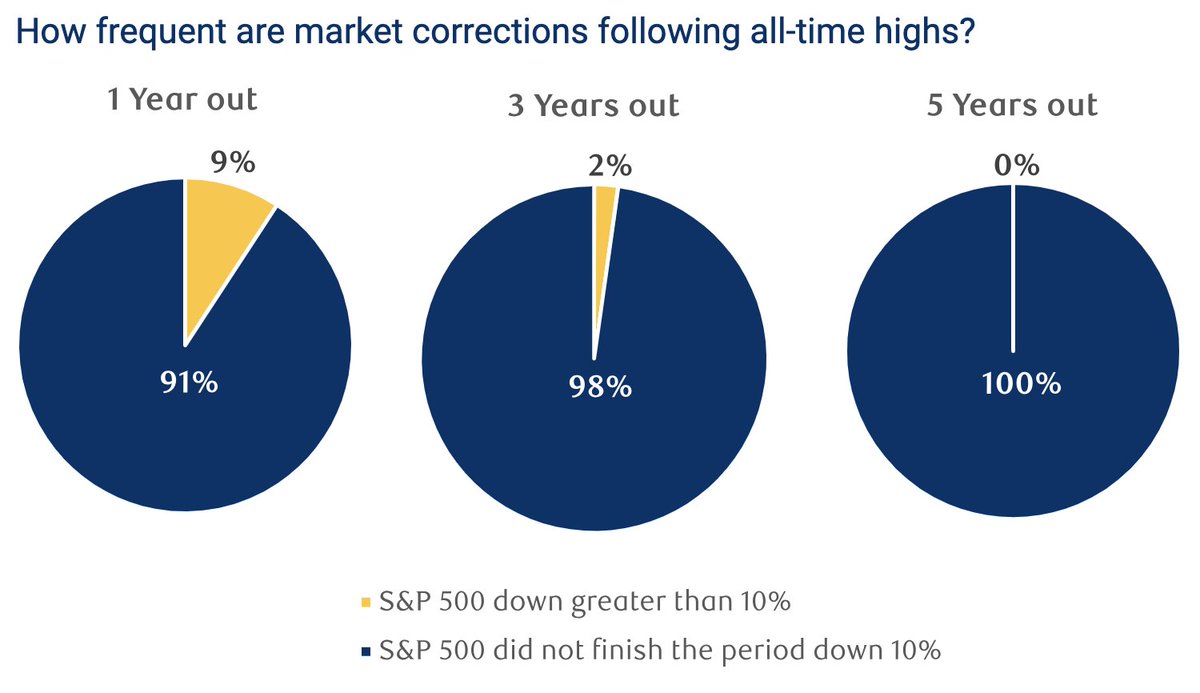
The chart above outlines how often the S&P 500 has corrected greater than -10% over various periods of time, following each of the ~1,270+ all-time highs since 1950. In other words, SPX rarely retests former lows or anything close to it once achieving an all-time high. It remains unlikely that we experience a 2H 2025 correction of -10% or greater, especially after expressing an 18.8% technical bear market in the calendar year (closing basis). With that being said, a pullback of -3 to -5% is a reasonable expectation if not probabilistic outcome. Not a guaranteed outcome, but probabilistic outcome.
Direct quote from Finom Group’s “April to-date Markets Float Like A Butterfly; Here Comes The September Bee Sting?” Report (August 31st, 2025):
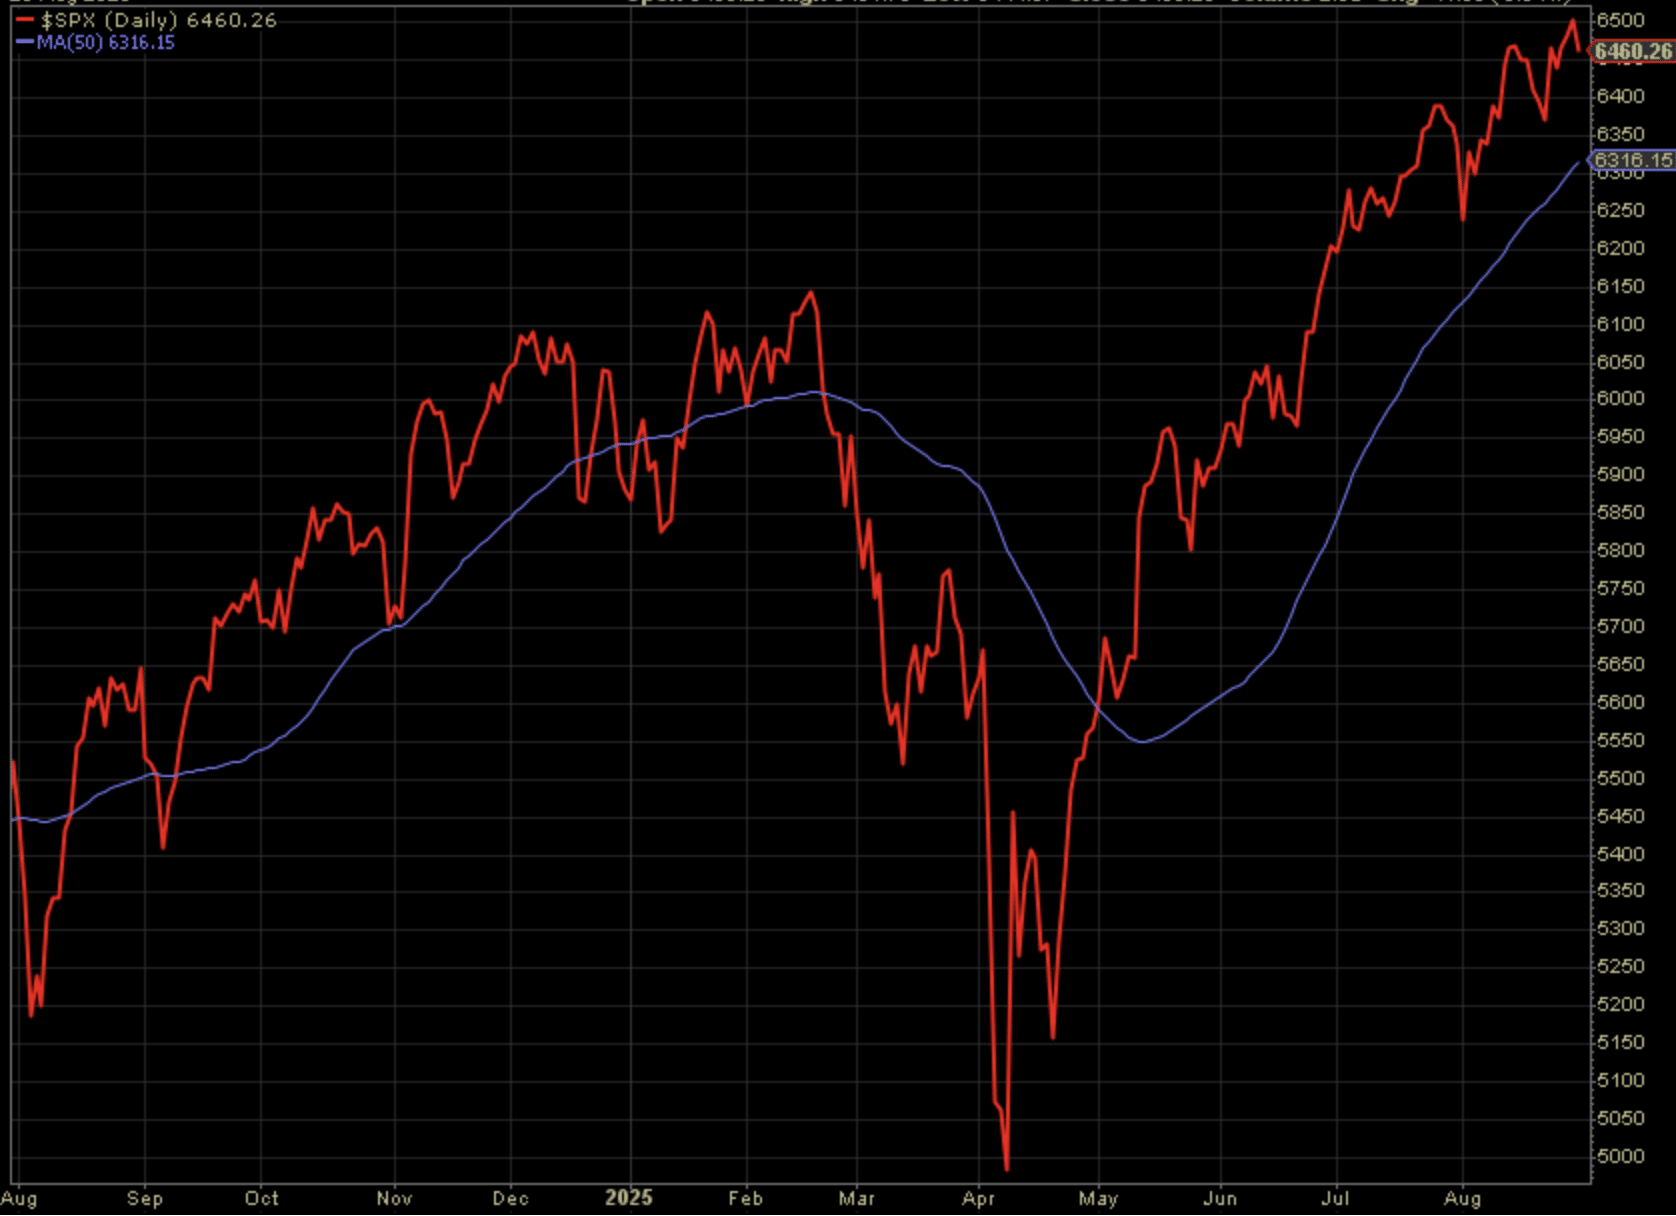
The S&P 500 has not revisited its 50-DMA for 89 trading days now. This is unusual for most bull markets, but not new bull markets, which one could argue was generated after the technical bear market ended on April 9th. The longevity for which the index has not checked back to its 50-DMA offers investors some insights on what they might expect in the near-term. Historically speaking, such streaks above the 50-DMA, without retesting the moving average for support, prove extended and come with a mean expiration date (88 days 😉)…
It’s important to focus on the fact that such streaks above the 50-DMA are interim and long-term bullish. For those who have been locking in profits with each new high and positive monthly return since May, you are likely seeing a pullback through a bullish lens. For more on the pullback probabilities, we outline the “MarketCharts” study pertaining to the same bullish streak under examination.
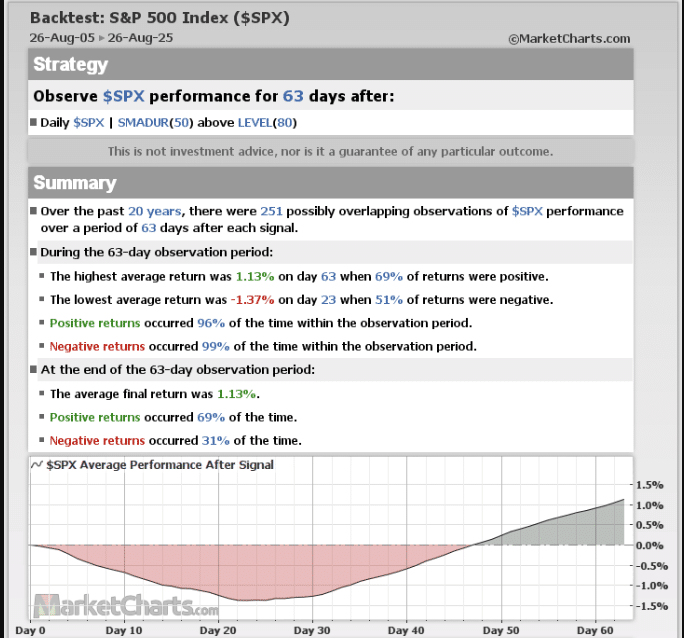
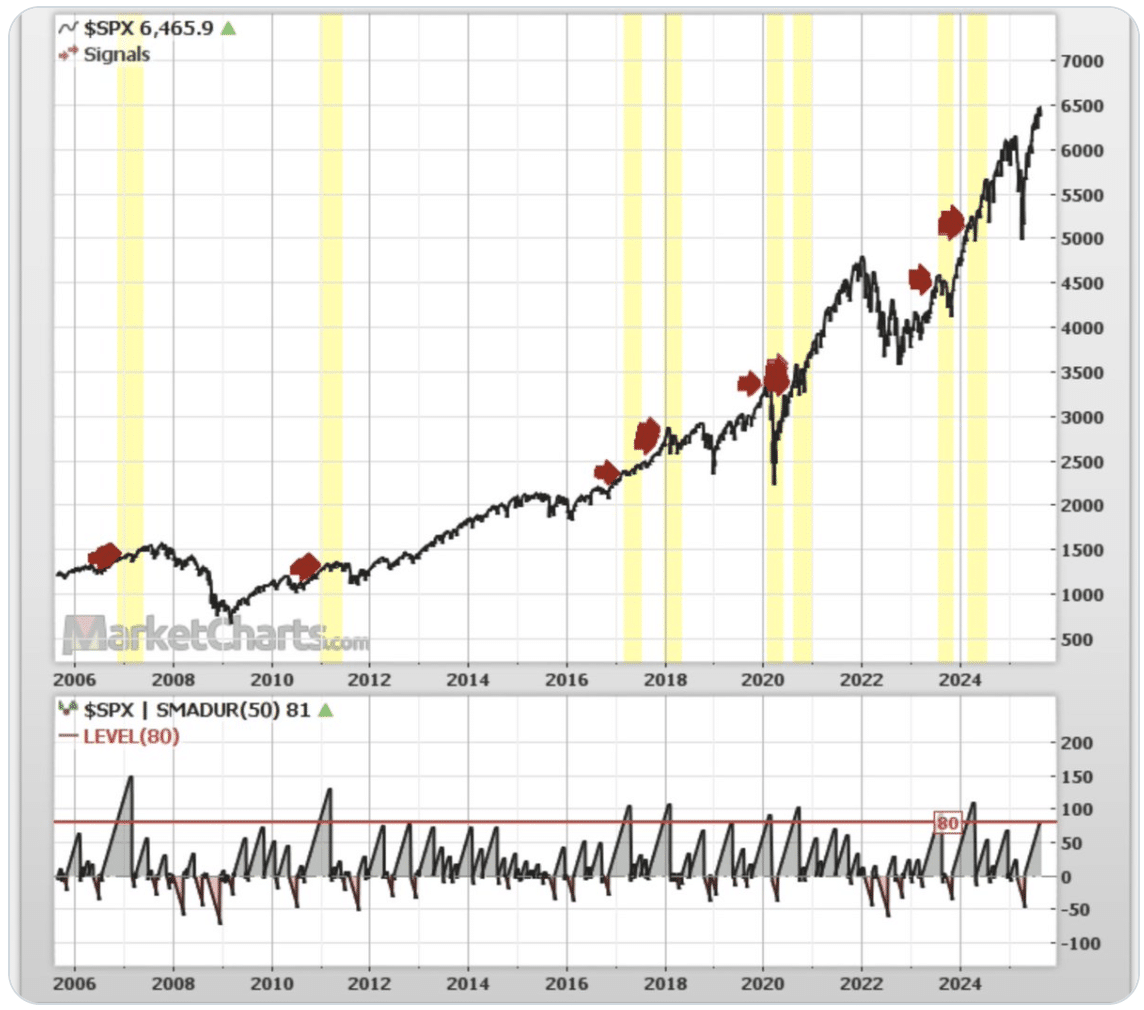
The study outlines forward 3-month returns (63 trading days) after SPX spends 80+ days above its 50-DMA, since 2006. Additionally, the study disseminates the 1 and 2-month returns, with an overwhelmingly negative 1-month return positivity rate…the 1-month return is negative with an average return of -5.54%. While we would only use the average return as a baseline expectation, the positivity rate is nearly nonexistent with just 2 of 251 occurrences producing a positive daily return.
Equally important to point out or consider, is that when markets perform outside of the baseline expectations, as they have done at certain points during the recovery period and to-date, be flexible with your approach to data signaling a pullback even one’s that seem all but certain. It’s for this reason that I have previously urged investors to be willing to buy even the slightest of pullbacks in Q2 and now Q3.
“If we take the technicals at face value and combine them with the approaching fund flow weakening period ahead, we should anticipate some consolidation near-term. The last time I said that the markets fell in the week ahead… by less than -.3%. I say this to reinforce that any pullback, ANY PULLBACK at all… be on your best behavior folks! The market message is UNAMBIGUOUSLY very bullish longer-term! Down is good, UP IS SIMPLY BETTER.”


Direct quote from Finom Group’s “April to-date Markets Float Like A Butterfly; Here Comes The September Bee Sting?” Report (August 31st, 2025):
Speaking of those technicals, and briefly as we don’t find the bullish overall market trend demanding too much in the way of “technical wanting”, two of the more important market driving charts also speak to the probability that Friday’s market sell-off of sorts was likely a sample of what’s to come in the month of September.
The chart of the Information Technology (top chart) and Semiconductor ETFs (bottom chart) are nearly identical. Semiconductors are the largest industry in the market, within the largest sector, Information Technology, in the market itself (SPX). Each of these charts tell the same exact story, in a rather unambiguous manner:
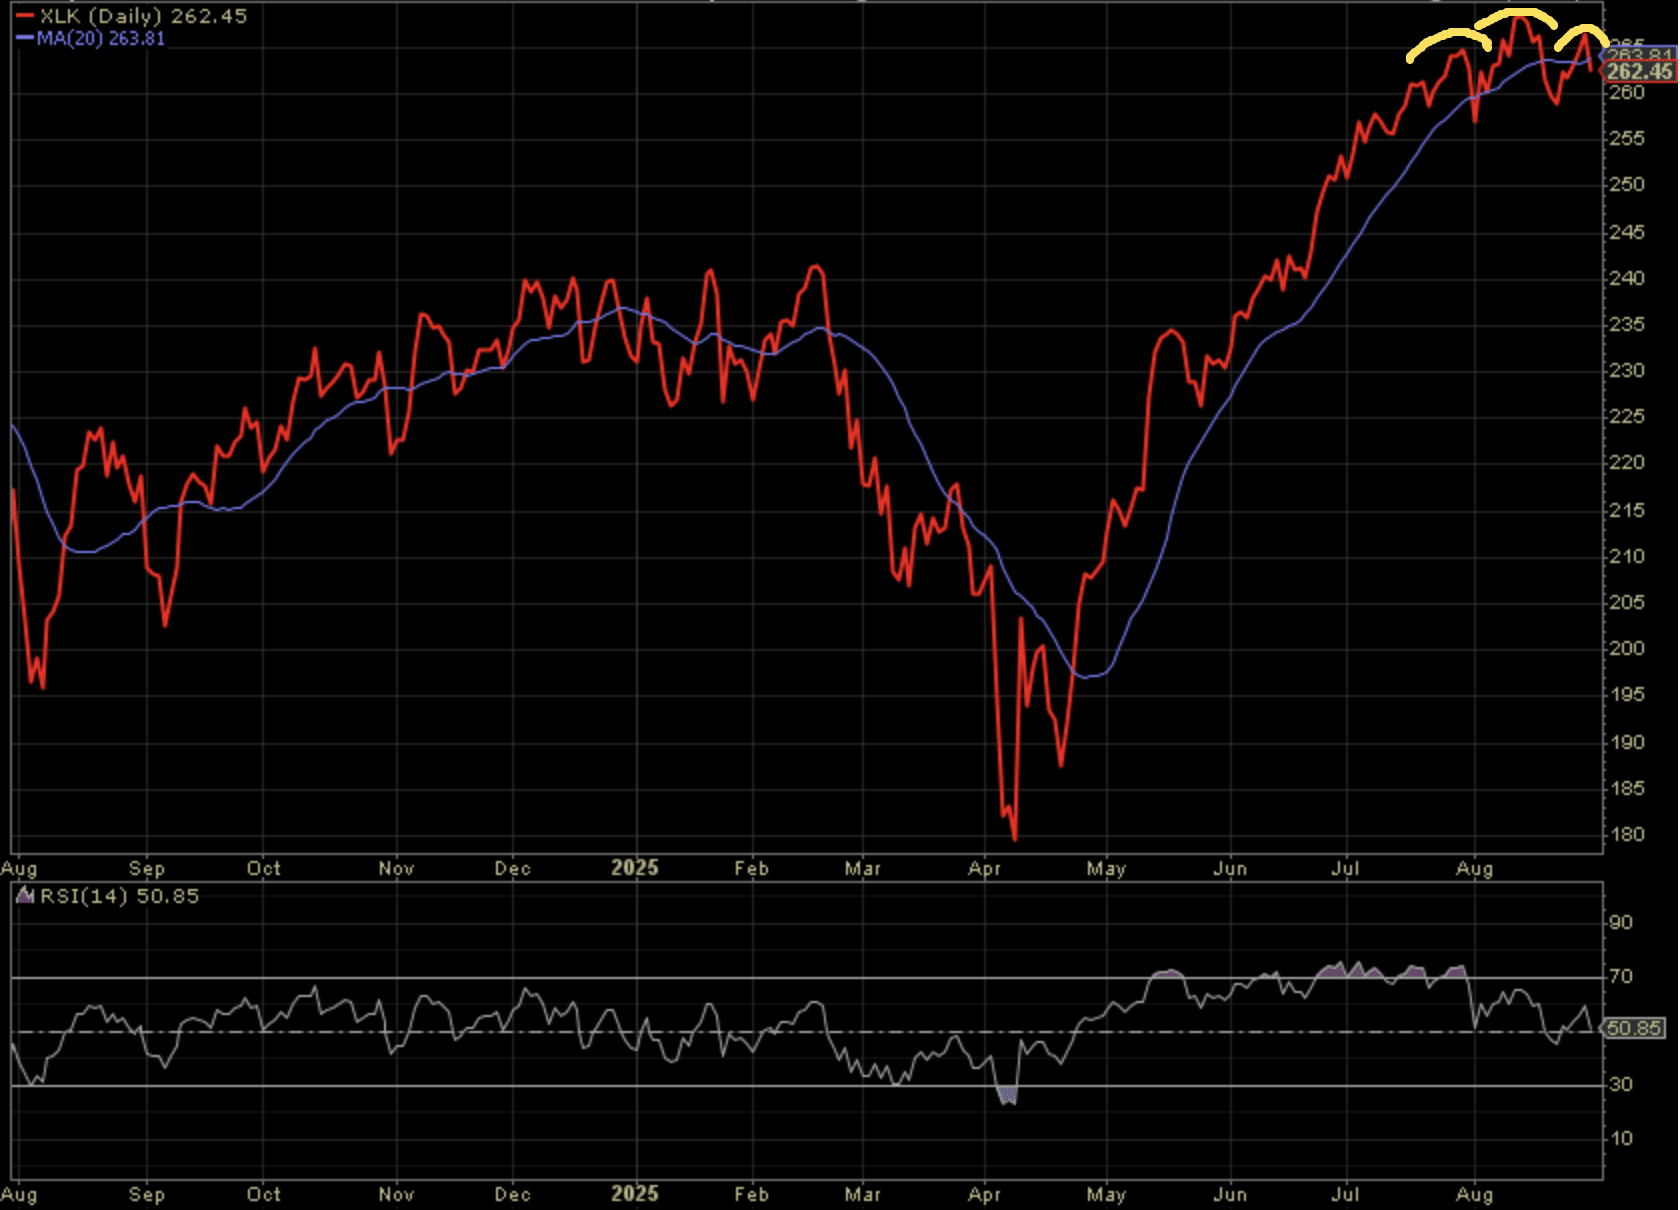
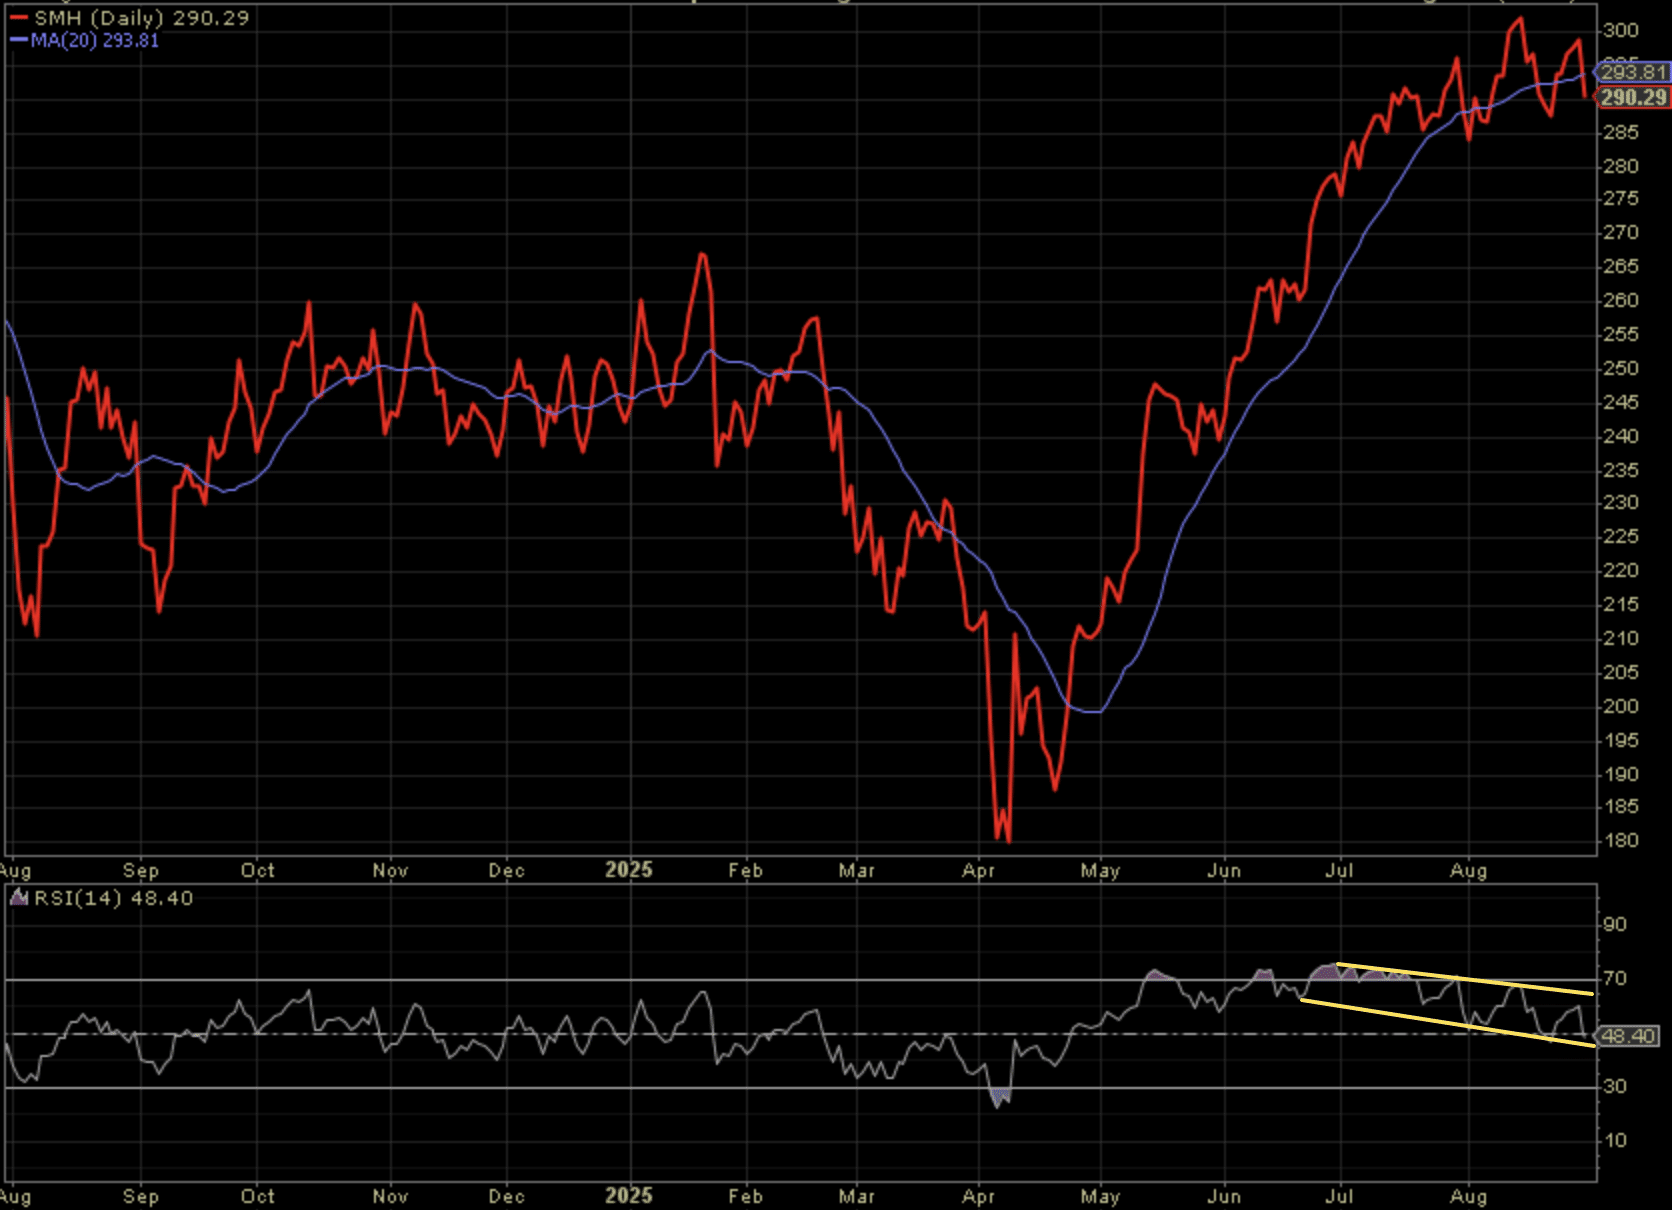
Both ETFs, which are the largest in the market place, have developed head n’ shoulders patterns and negative/bearish RSI divergences. Lastly, both finished just below their respective 20-DMAs this past week. This is not the ideal technical setup for the overall market, heading into the month of September, which is already found for fewer inflows and the worst of all monthly returns, historically.
Direct quote from Finom Group’s “April to-date Markets Float Like A Butterfly; Here Comes The September Bee Sting?” Report (August 31st, 2025):
If this aforementioned data and technical analysis sounds bearish to you and your first instinct is to start selling come Tuesday morning, or worse yet hedge your long exposure, you might need to recalibrate your mindset. Markets need a healthy bout of consolidation. It often helps to alleviate all the excuses many have missed out on the gains year-to-date while pulling new money into the market under the guise of what is typically, temporary cheaper prices. And keep in mind…
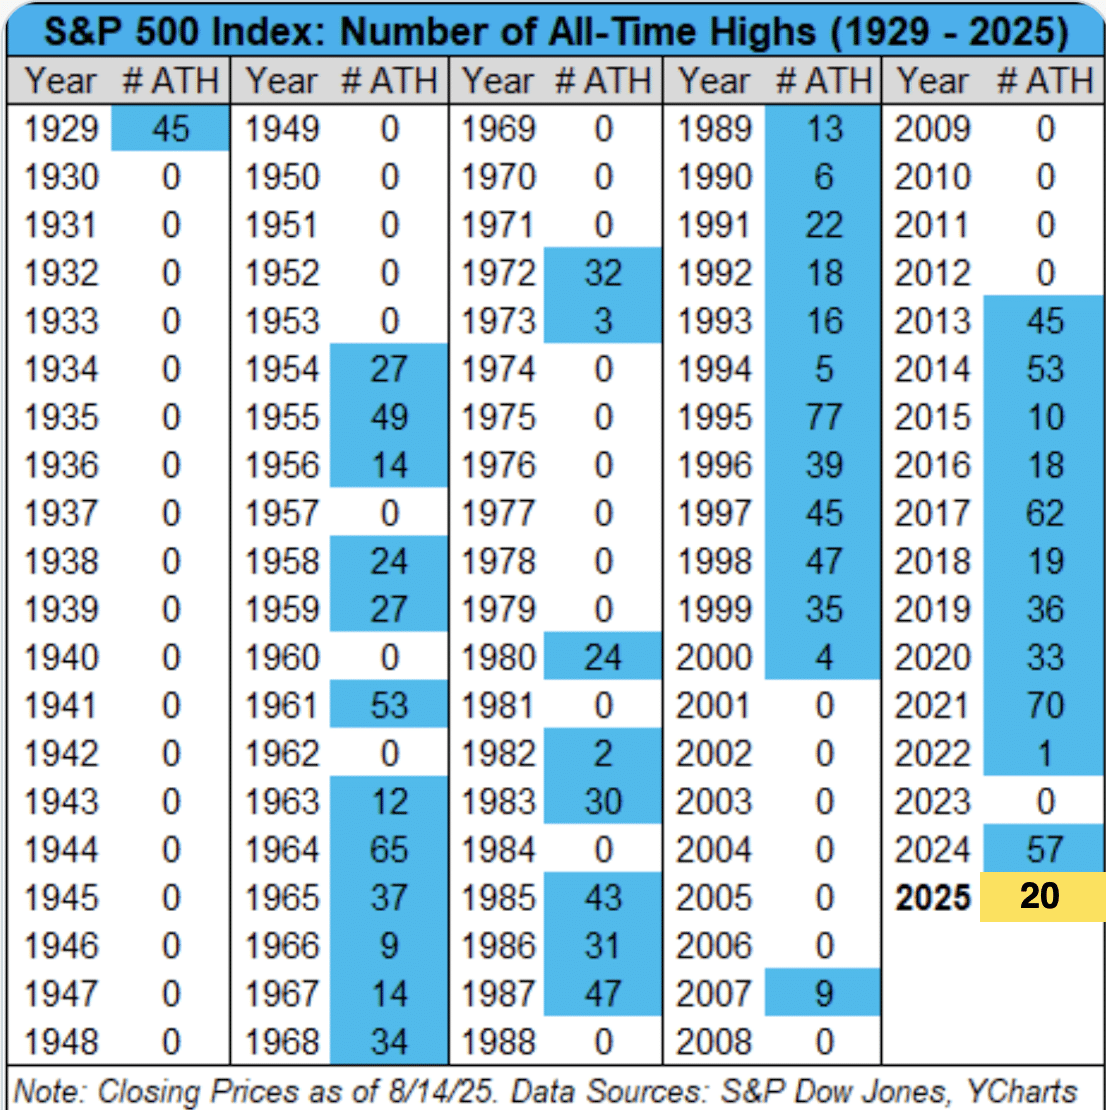
This past week’s all-time closing high of 6,501 was its 20th all-time closing high of the calendar year. The S&P 500 has never, EVER made 20 calendar year all-time highs and stopped on number 20. It has always gone on to achieve at least 2 more all-time highs in the calendar year, informing that there remains a 91.3% probability that 2 more all-time highs are achieved by year-end. We like those probabilities, and the fact that the market has only topped in the month of August 1 time, since 1980.

Direct quote from Finom Group’s “April to-date Markets Float Like A Butterfly; Here Comes The September Bee Sting?” Report (August 31st, 2025):

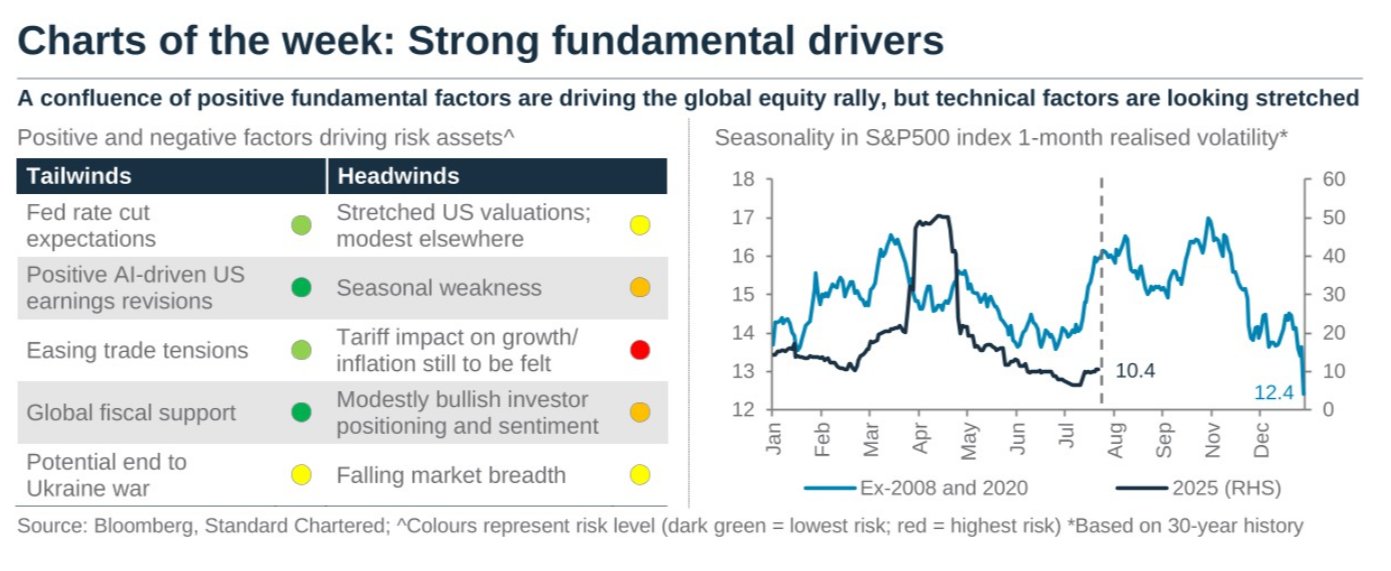
On average since 1990, the VIX has peaked in September and October, trading around 20. With the VIX near 15 now, history suggests that the risk/reward skews toward higher volatility in the weeks ahead. For short-VOL market participants, this is likely a more certain opportunity given that market disruptions can build momentum to the downside, but volatility has no ability to sustain protracted periods of upside. I will be looking to re-leverage the VXX short-VOL exposure within the Golden Capital Portfolio, and recoup some of, if not all, my losses from a failed Target (TGT) trade.
Moreover, the VIX had fallen for 4 straight months to end August. This is a rare streak, but also confirms our reasons to buy any dips henceforth, and as outlined in the following study from Subu Trade:

I’m not terribly concerned with the near-term and when reviewing VIX quant data, but the longer-term probabilities are even more compelling than the near-term, which are still quite positive. The S&P 500 positivity rate 2 weeks forward speaks to limited downside potential through mid-September and leading up to the September 17th FOMC rate announcement/meeting. With a 2-week forward positivity rate of 91%, it will prove difficult to not buy the dip in the coming weeks. Having said that, there’s a lot of green in the table and the forward 9-month positivity rate of 100% informs investors that should any near-term probabilities fail to achieve their higher probability outcome, simply wait longer. The S&P 500 signal date/price… 6,501! Don’t be afraid 😱 of a little increase in volatility ahead, embrace it and compound returns by year-end if not by May of 2026.
Direct quote from Finom Group’s “April to-date Markets Float Like A Butterfly; Here Comes The September Bee Sting?” Report (August 31st, 2025):
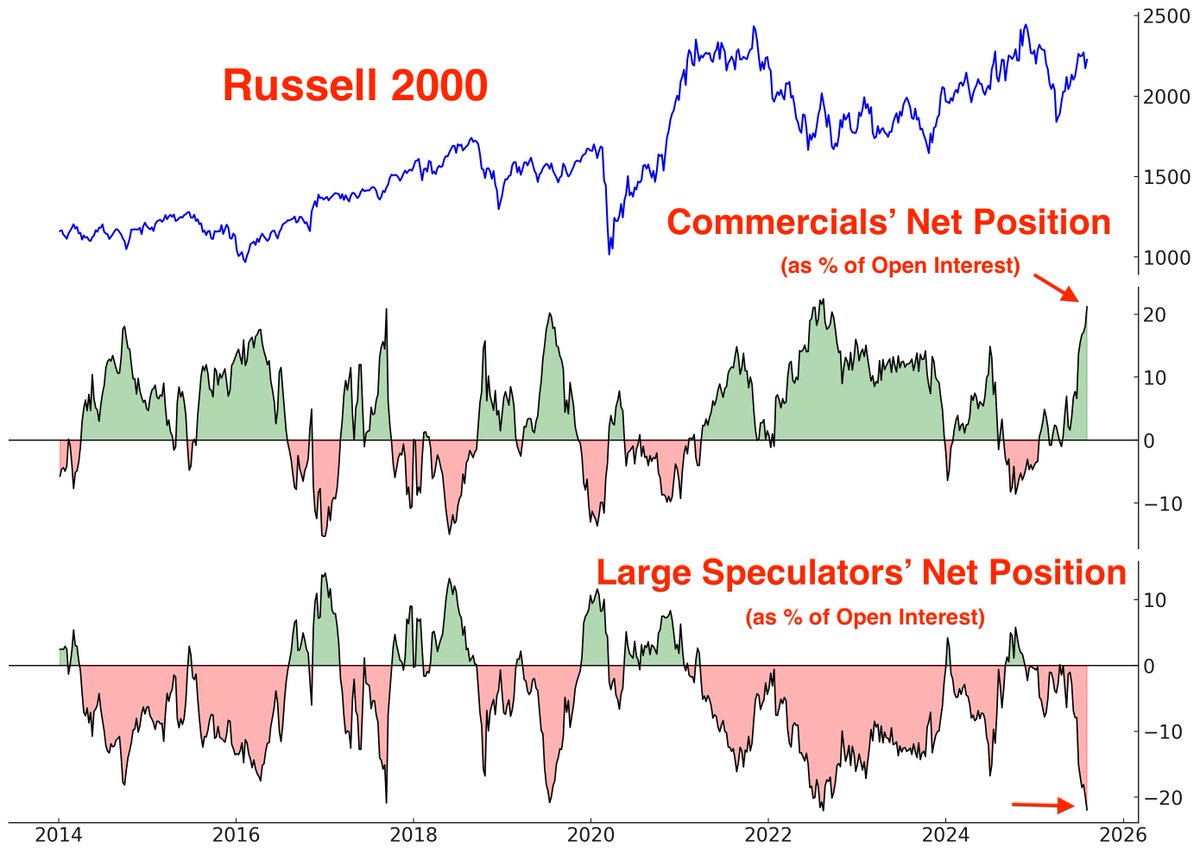
I have maintained, through the ups and downs, a core holding in shares of TNA for small-cap exposure. I’m of the opinion the significant strength expressed in the Russell 2000 since the April lows and through August, validates owning the cap-tier index ETF (IWM/TNA). The quantitative study from Bespoke Investment Group also lends positively to the small-cap outlook:

There may have been a “hint” that small-caps would outperform in early August. According to the COT Report: Commercials are almost record-long Russell 2000 futures. Meanwhile, Large Speculators/hedge funds are almost record-short (chart via Subu Trade). This is smart money (Commercials) vs. dumb money (Hedge Fund Speculators) folks, and this is also recognition that the heard of smart money is more often found “right” when compared to the heard of dumb money.
I’m not prepared to overweight small-caps, given I view the surge of late as more of a catch-up trade than anything else, least of all having anything to do with the prospectus for near-term rate cuts. Should small-caps do better with rate cuts? Yes! Better than large-caps? Not as likely! Historically, the only time small-caps outperform is during recessionary rate cutting cycles that find bear market bottoms and not rate adjustment cycles which this has all the signs for being.


Owning small-caps, yes, but overweighting small-caps we don’t yet see as the optimal positioning given the weight of the evidence approach to capital allocation. Probably time for a break, considering the word recession came into play in this segment, eh?
Direct quote from Finom Group’s “April to-date Markets Float Like A Butterfly; Here Comes The September Bee Sting?” Report (August 31st, 2025):
For now we think it more relevant to remind investors of what the quants define to be good dip-buying opportunities and likely to remain as leadership post any degree of price consolidation in September/October.
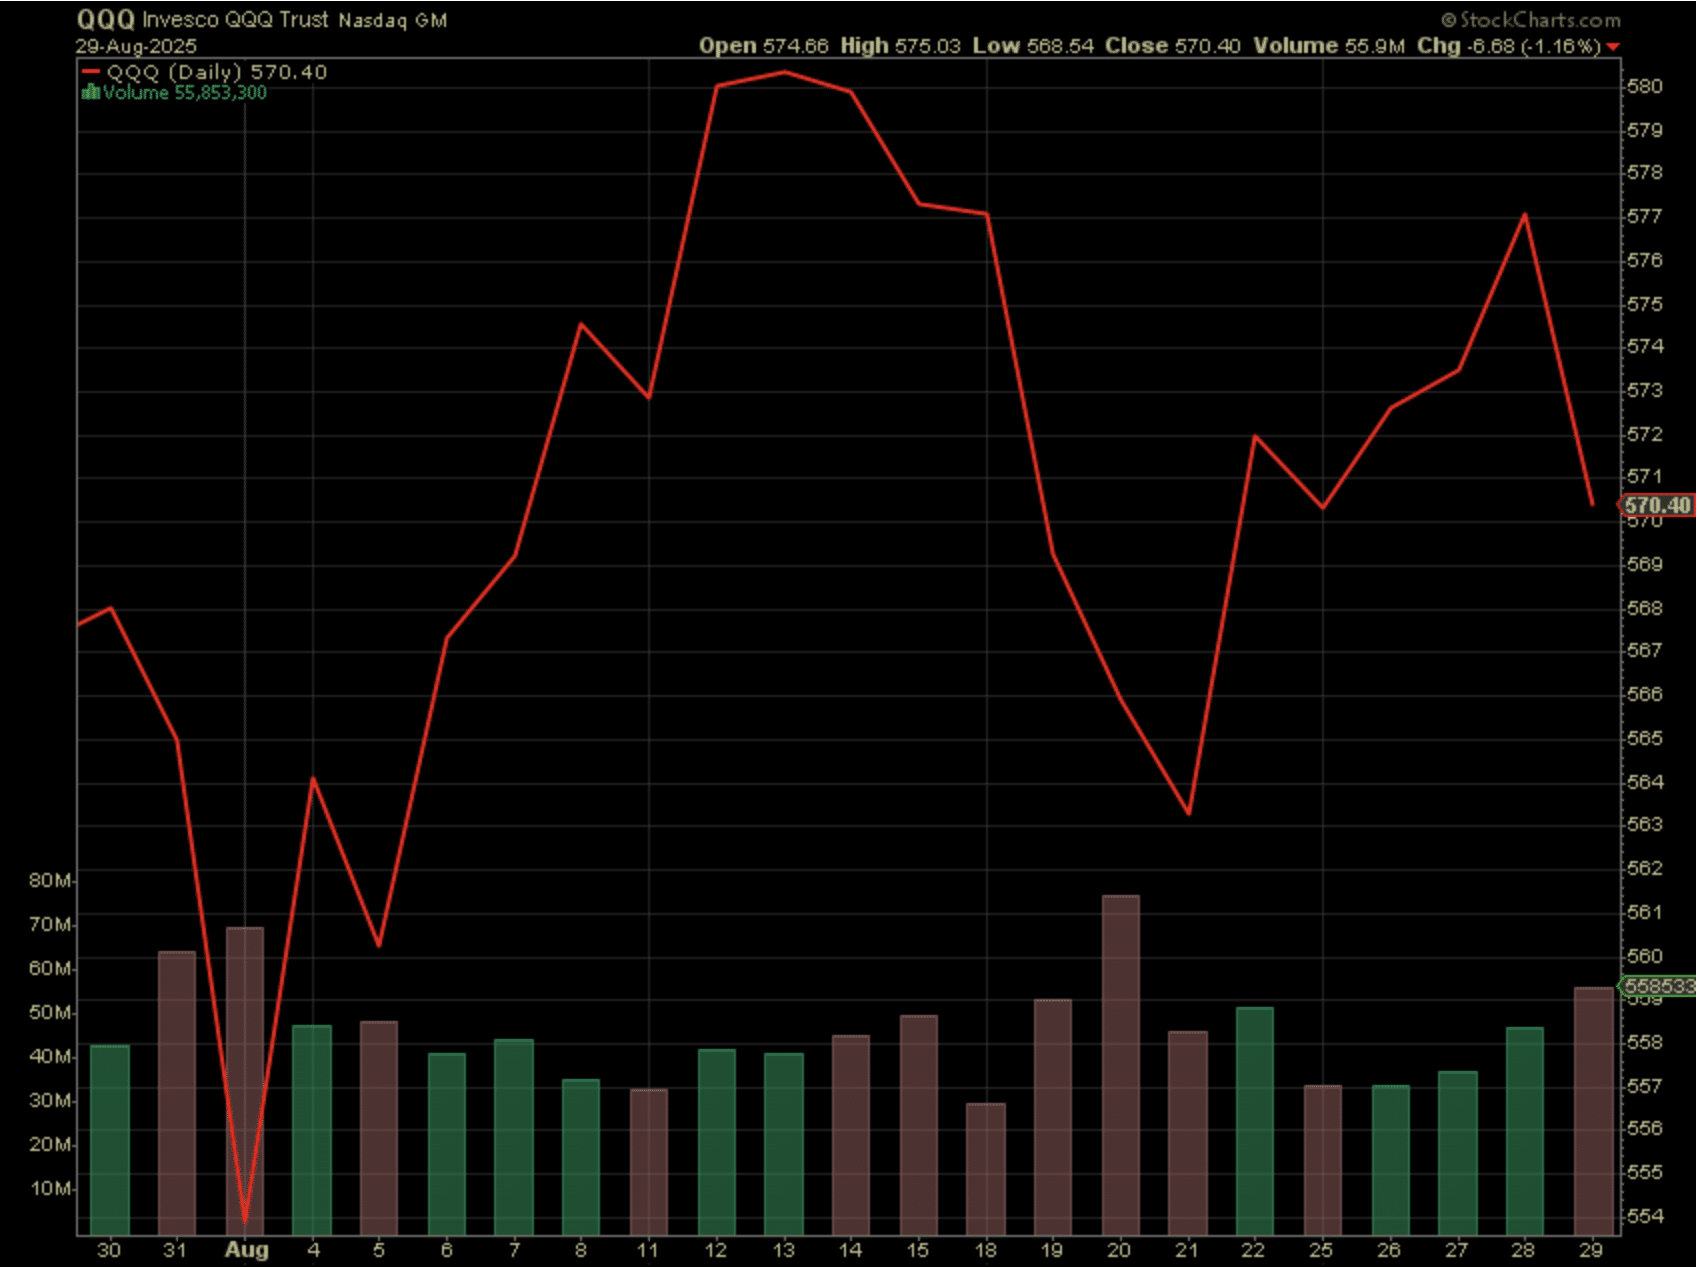
The Nasdaq 100 had 6 consecutive losing sessions ahead of the Jackson Hole Summit. Historically, this has proven to be a buying opportunity and will likely prove to be one for the months ahead, assuming cheaper prices.
As the table below identifies, 6-day losing streaks for the Nasdaq 100 offer a 3-month forward bullish signal. The closing price for QQQ/NDX as of the final trading day of the streak was 563.28 on August 21, 2025. This will prove our baseline for expectations and should price fall below that level at any point over the next 2.9 months.
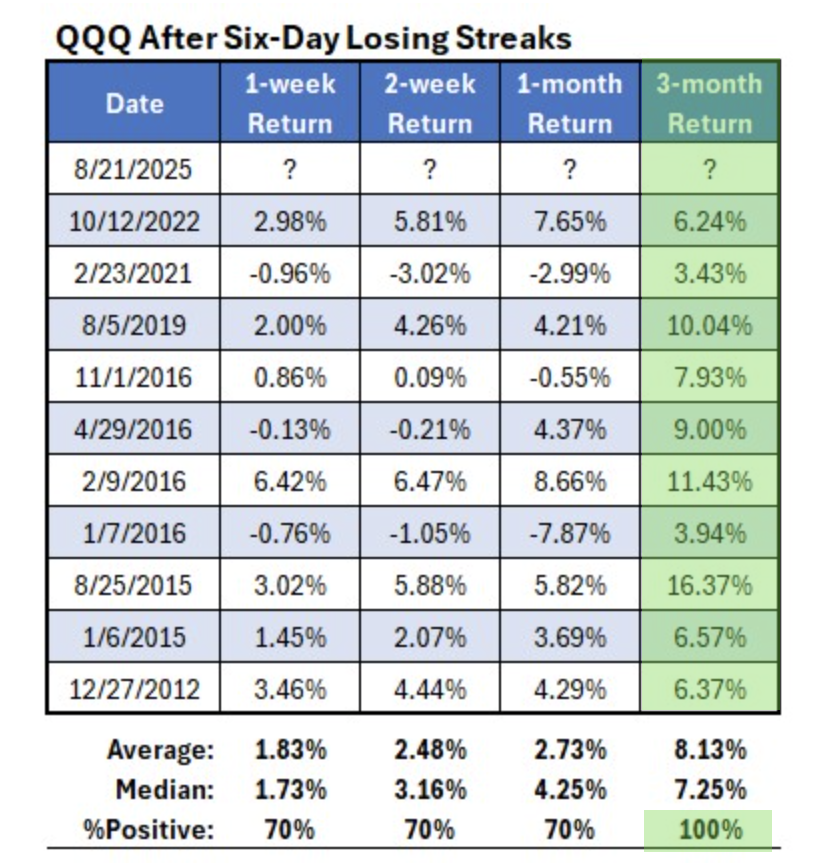
With the Nasdaq 100 trading at 570 to end this past week, this may very well find investors gobbling up shares of QQQ, given the 100% positivity rate and median 7.25% return over the forward 3-month period.
Direct quote from Finom Group’s “April to-date Markets Float Like A Butterfly; Here Comes The September Bee Sting?” Report (August 31st, 2025):
In prior weekend Research Reports I’ve recognized the propensity for the market to produce only modest, sub -3% pullbacks. At this stage of the bullish trend and considering the scheduled fund flows associated with September, I’m more confident in supporting an outlook of a greater than -3% pullback, but still less than a -9% pullback. Confidence is not the same as portending a guaranteed outcome, but merely confidence.
Additionally, if we did not already have in mind the MarketCharts data disseminated within this weekend’s Research Report to consider, the following quant from Wayne Whaley further builds the case for such downside probabilities.

“The S&P 500 set new 12-month highs on August 27 and 28th. Since 1950, there have been 12 previous cases of 12 Month Highs set in the last week of August. In only 1 of those 12 cases (2018) did the S&P 500 manage to post a positive September, scratching out a modest 0.43% gain and leaving September with a -2.13% average loss in these 12 cases. However, the highs at the end of August, promises investors an End of the Year rally as Nov22 – Dec27 was 11-1 in this setup for an average gain of 2.83%.” ~Wayne Whaley

You don’t mess with the Zohan of the investment world, and it ain’t Tom Lee folks! 😉
Direct quote from Finom Group’s “April to-date Markets Float Like A Butterfly; Here Comes The September Bee Sting?” Report (August 31st, 2025):
While it may seem strange for a bullish person such as myself to tout bearish/negative price action as part of a forward-looking expectation, I’ll remind investors/traders that pullbacks are a normal and necessary part of a bull market. Additionally, such stings to the uptrend help the active portfolio manager to compound returns for any given year.
There are those whom believe the markets have come too far too fast, and the already lacking of a more significant pullback is a calling-card for a market crash. We have no data to support such considerations, and recognize that with the S&P 500 gaining some +25% in the last 100 days it has never delivered a negative return 3-months forward… NEVER 💯.

While the macro-economic landscape can find narratives that are both bullish and bearish, the quantitative and technical analytics deliver the same bullish message to investors/traders. And we’ve been waiting for a couple of technically bullish signals to present themselves as longer-term bullish and dip-buying signals. One of the most offensive, risk-on signals occurred this past week with Equal-weight Consumer Discretionary vs. Staples achieving a new all-time high… and in a big way (chart below).

Float like a butterfly 🦋
Lastly, and for the first time since April 2024, every cyclical sub-industry group has a rising 100-day moving average. This bullish trend backdrop across the market’s most ECONOMICALLY sensitive groups has historically rewarded equity investors, with the S&P 500 averaging annualized gains above +20%…


