

Research Report Excerpt #1
It’s important to respect seasonal patterns/data, but the seasonal data is often best utilized when pared with other quantitative studies/data. When it comes to the January Barometer, this may be especially true.
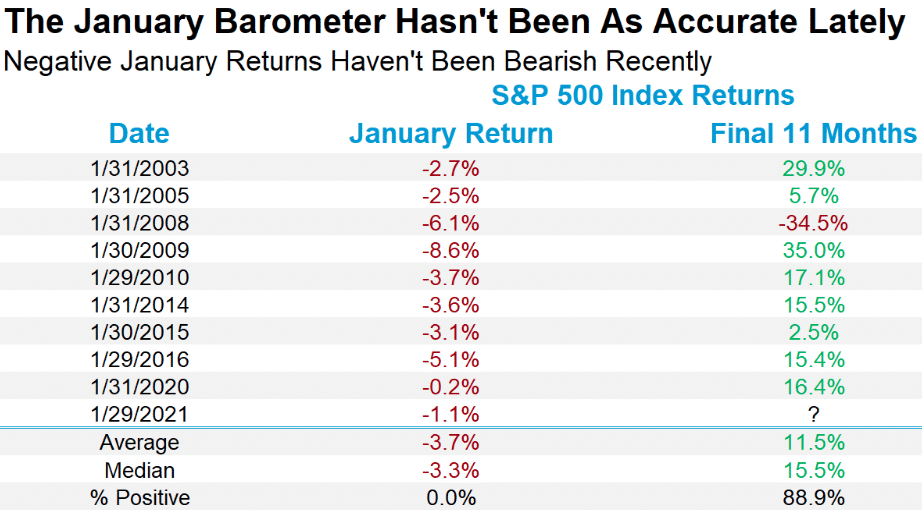
The catch is the January Barometer has been broken lately. In fact, a lower January for the S&P 500 has been bullish recently, with the final 11 months of a year higher 8 of the past 9 times after a negative January. Of course, the most recent 3 times (’15, ’16, and ’20) all had significant volatility. 2016 and 2020 were election years, go figure!
Research Report Excerpt #2
The good news, we’re beyond the 7-Year Itch and only 8 years into the secular bull market. The other good news is that the secular bull market’s new cyclical bull market is only 21 months NEW!
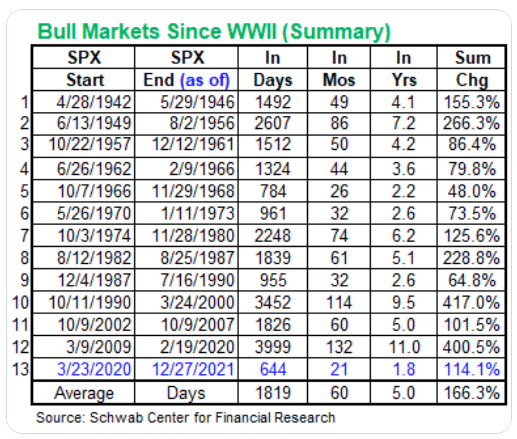
The table above identifies the cyclical bull markets since 1942. At just 21 months young, the table above suggests that the current cyclical bull market has many more months to run before finding another cyclical bear market. The only cyclical bull market that did not run at least 30+ months was back in 1966-1968.
Research Report Excerpt #3
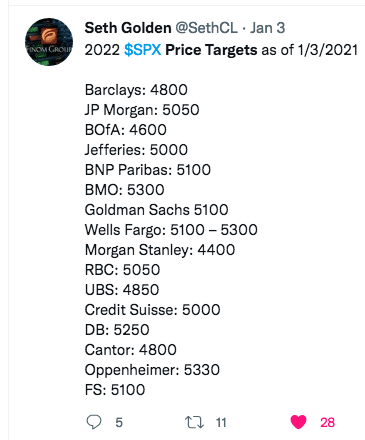
The average strategist/analyst year-end 2022 price target for the S&P 500 should be taken with the grain of salt, as most price targets will find a degree of revision through the year. Currently, the average price target is 5,050, which would prove a ~7% return over the closing price in 2021 (4,766). Not great, and below the 20-year average, but with rates rising it is understandable. Let’s also walk through the math:
- The Current 2022 EPS estimates are for $223/share
- The Forward P/E is around 21/X presently
- $223 x 21 = 4,683
- SPX is currently trading 4,677
- So we have already seen more derating of the P/E multiple, somewhat consistent with a rising rate outlook.
Finom Group has no confidence in the average analysts’ estimates for FY2022 EPS growth ($223). We are of the opinion EPS will be significantly higher. This, in part, is what is fueling our continued buy-the-dip regiment, along with a belief that the P/E expansion witnessed in 2020 will prove somewhat sustainable and pushing the 10-year P/E average higher. The other “part” is simply long-term time horizons and cheaper stocks breed good outcomes for savvy investors.
Given where margins are, the strength in consumer balance sheets, and the need to replenish inventories, earnings of $223 is probably too low. Finom Group has modeled earnings of $240/share in 2022. Now let’s do the math again.
- Assuming a constant P/E of 21/X
- $240/share X 21 = 5,040
With all that being said, and everyone throwing in the 2022 towel (just kidding), Finom Group’s official S&P 500 12-month price target is 5,120. Indeed, this price target does not represent another double-digit year of S&P 500 returns, and if growth outperforms expectations may prove too cautious. We will continue to monitor the macro-picture as it develops throughout the year. If our price target objective demands a revision, up or down, we will accommodate accordingly. Since Finom Group’s inaugural year (2017), we have not failed a 12-month price target objective.
Research Report Excerpt #4
One of our more favored breadth measures is also in bullish territory, despite the poor price action this past week. The percentage of NYSE stocks trading above their 200-DMA RELATIVE to the percentage of NYSE stocks trading above their 50-DMA ended the week at 1.07.
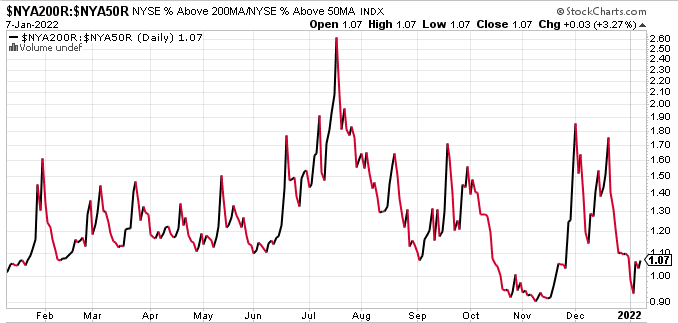
We would start to see better value in the market should this breadth performance ratio tick above the 1.50 threshold. That hasn’t happened to-date. It doesn’t mean it can’t or wont, as it has in the recent past; it simply demands monitoring. Notice how I didn’t characterize the 1.50 threshold as offering a sell signal or a bearish signal. Simply put, that would prove the wrong perspective and mindset in a bull market, and given the data at-hand. Investors should remain optimistic given the quantitative data surrounding cyclical and secular bull markets we’ve already outlined, and remain extremely patient when it comes to “turning bearish.” The best investment an investor can often improve upon is investing in their time horizon considerations and disciplines. It’s easier said than done when ego is involved, but when things are rocky in any given year, simply extend your time horizons and look to allocate capital on incremental dips.
Research Report Excerpt #5
One signal that may also point to a near-term easing of selling pressure would likely come from the relative performance between the Consumer Discretionary ETF (XLY) and the Consumer Staples ETF (XLP). Recall from the YTD Sector performance chart above, investors have bid up Staples while selling Discretionary stocks. For this exercise we will use the Equal-weighted versions of both ETFs, given the top 3 stocks in the XLY make-up some 50% of the ETF. The Equal-weighted tickers are RCD and RHS, Consumer Discretionary vs. Consumer Staples.
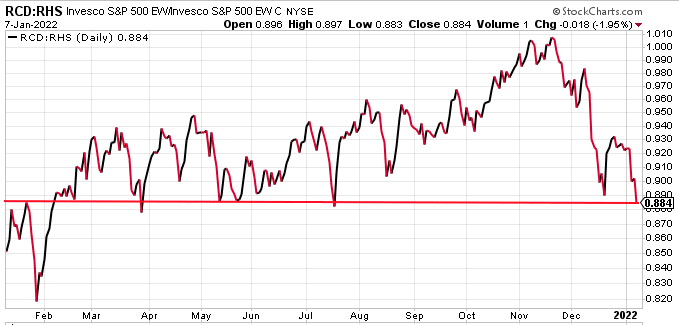
As we can see from the performance ratio, the descending trend line shows that Consumer Discretionary (offense) has been mightily underperforming Consumer Staples (defense). The trend line has come down to what had previously been a key support level in 2021 on several occasions. We can slip below this line, but in and around this level is where investors want to pay attention. A more material and lasting breach of the level could signal additional risk-off, lower prices, but long-term opportunity for investors.
Research Report Excerpt #6
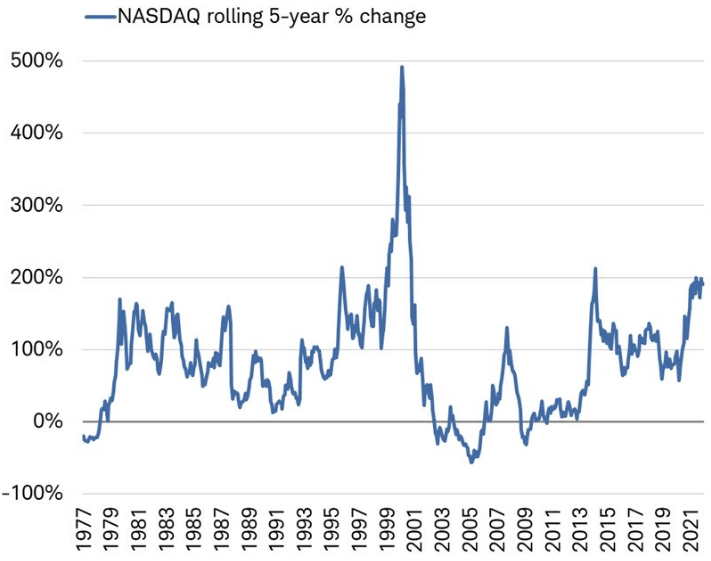
The textbook definition of a bubble is: Assets quadruple in value over a 3-year period. If this is a bubble, it’s the worst one ever. As of the end of 2021, NASDAQ’s rolling 5-year gain of 191% is impressive, but doesn’t come close to the 5-year gain of 492% as of February 2000 and during the Dotcom bubble!
Research Report Excerpt #7
A survey of households shows that 651,000 people found jobs in December after 1.1 million had done so in November. That’s 1.74 million jobs, almost 4X as many as the combined headline numbers for the past 2 months.
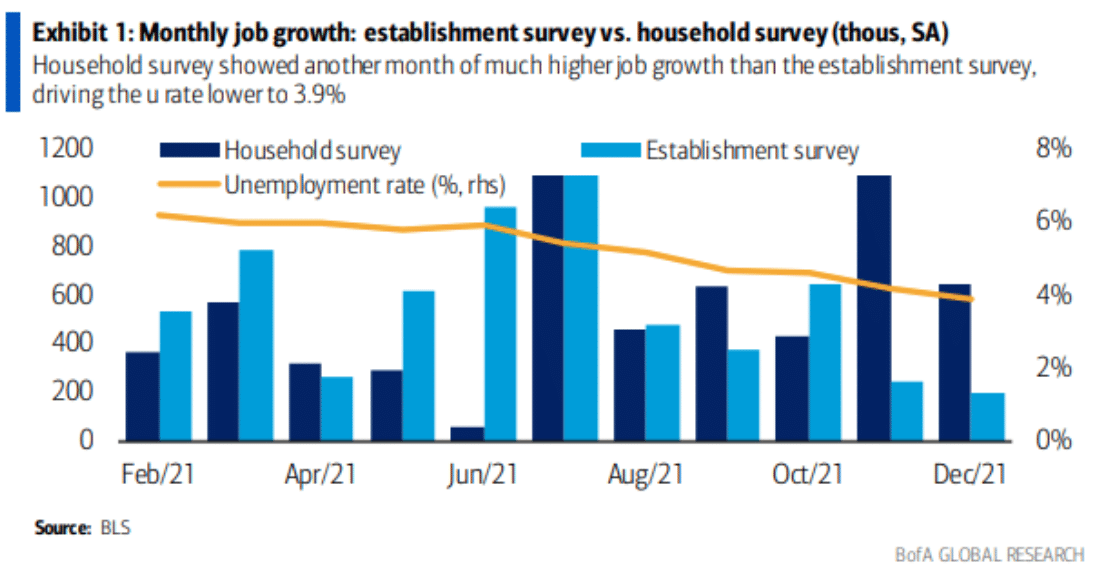
The headline numbers are drawn from survey of business establishments that is much more reliable over time. The survey queries almost 700,000 work sites each month to gauge how many people are employed.
The household survey only questions some 60,000 households each month and is more prone to error. Over the last three months, the household measure of employment has advanced by 723,000 on average per month, a rapid pace. By contrast, Nonfarm payrolls are up just 365,000. That is a pretty wide gap!
Research Report Excerpt #8
Don’t fear the Fed, at least not in 2022. While 12 of the 18 members of the Federal Open Market Committee expect at least 3 rate increases in 2022, investors should not equate 3 hikes with 3 strikes and, therefore, the end of the bull market in U.S. equities. As we have stressed repeatedly, average S&P 500 returns are typically solid 1-year out from the initial rate hike because economic growth and corporate profits are robust, offsetting the nascent shift in monetary policy.
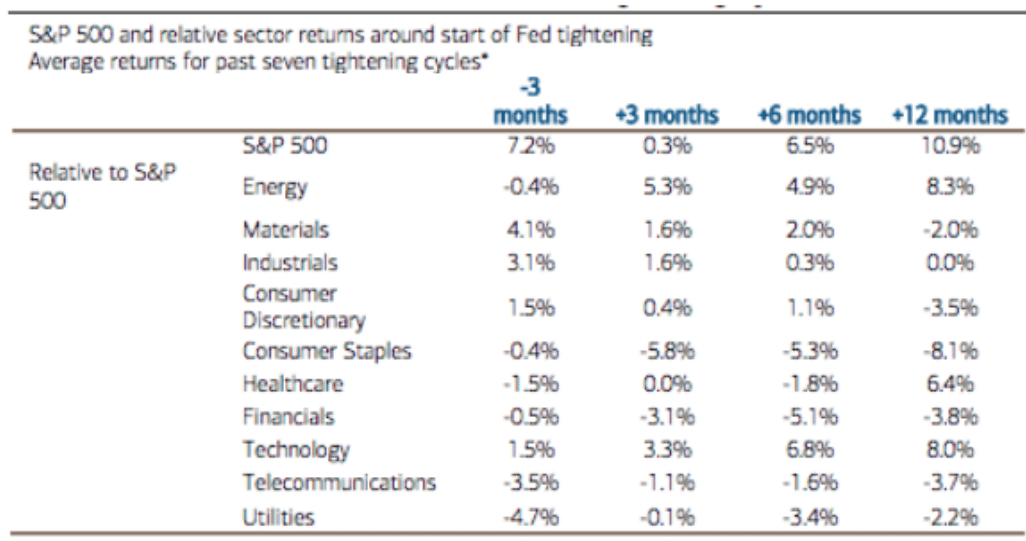
Also, the latter works with a 1-year lag, so the compounding effects of tighter monetary policies will be more of a headwind for the markets and economy later in 2022 and into 2023. As a point of reference, the average total returns of the S&P 500 over 2004 to 2006, with the Fed raising rates 17 times, was 10.5%; over the 2016-18 rate hike cycle, returns were 9.8 percent. As for timing, equity prices tend to rollover at the end of a Fed tightening cycle, not at the start.
Research Report Excerpt #9
Now, imagine the unluckiest market-timer in the history of capital markets. Not just unlucky, but actually extremely good at being extremely bad. Imagine this investor, instead of picking the absolute best day to invest his $1,000 each year, picks the absolute worst day.
Will he end up with $50K? Maybe $75K? How much worse off do you think he is?

This guy, the worst market timer ever, investing $1,000 at the very worst possible time each year, still has $122K. So the difference between the perfect idiot and the man with perfect foresight, is the idiot has nearly 80% of the nest egg as the impossibly accurate market-timer. So, not only can you not pick the perfect day to invest, there isn’t even a whole lot of upside from trying!
And this isn’t just a recent phenomenon. Here it is to 1998:


