
The S&P 500 (SPX) began the week at 2,733 and traveled all the way up to a closing high for the week at 2,813 and before consolidating on Thursday at 2,806. Why is this relevant? Well, it is relevant due to the efficiency of the market that has seemingly persisted for much of 2018. Weekly expected moves in 2018, for the SPX, have failed to close above or below the expected move only a dozen times or so. This particular trading week indicated a weekly expected move of $65-$66, which would put the SPX back at or below 2,788 to close the week. From Thursday’s closing price, that would find SPX falling 18 points or so. We’ll have to see what the risk appetite for equities is on Wall Street after Asian equities tumbled once again and Thursday’s Federal Open Market Committee (FOMC) statement seemed uninspiring.
As expected, the FOMC left rates unchanged in November, but signaled it remains on its current rate hike path. This would forecast a 4th rate hike in December and for the calendar year. Benchmark yields were little changed after the statement release on Thursday, but the 2-yr. Treasury yield found itself near a 10-yr. high level. For a detailed look at what changed in the recent FOMC statement from the last statement, here are the changes:
“Information received since the Federal Open Market Committee met in AugustSeptember indicates that the labor market has continued to strengthen and that economic activity has been rising at a strong rate. Job gains have been strong, on average, in recent months, and the unemployment rate has stayed lowdeclined. Household spending andhas continued to grow strongly, while growth of business fixed investment have grown stronglyhas moderated from its rapid pace earlier in the year. On a 12-month basis, both overall inflation and inflation for items other than food and energy remain near 2 percent. Indicators of longer-term inflation expectations are little changed, on balance. Consistent with its statutory mandate, the Committee seeks to foster maximum employment and price stability. The Committee expects that further gradual increases in the target range for the federal funds rate will be consistent with sustained expansion of economic activity, strong labor market conditions, and inflation near the Committee’s symmetric 2 percent objective over the medium term. Risks to the economic outlook appear roughly balanced. In view of realized and expected labor market conditions and inflation, the Committee decided to raisemaintain the target range for the federal funds rate toat 2 to 2-1/4 percent. In determining the timing and size of future adjustments to the target range for the federal funds rate, the Committee will assess realized and expected economic conditions relative to its maximum employment objective and its symmetric 2 percent inflation objective. This assessment will take into account a wide range of information, including measures of labor market conditions, indicators of inflation pressures and inflation expectations, and readings on financial and international developments. Voting for the FOMC monetary policy action were: Jerome H. Powell, Chairman; John C. Williams, Vice Chairman; Thomas I. Barkin; Raphael W. Bostic; Lael Brainard; Richard H. Clarida; Esther L. GeorgeMary C. Daly; Loretta J. Mester; and Randal K. Quarles. Implementation Note issued September 26November 8, 2018.”
With one day of market selling pressure having been found on Thursday and after an extremely strong market reaction post midterm elections, market pundits are already turning bearish. Some are suggesting markets still need to retest the recent lows and/or the February lows. Brian Reynolds of Canaccord Genuity offered that very sentiment in a note to clients on Thursday. Reynolds focused on the Smart index, which remains weak despite a stock market rebound that’s produced a 3.1% rise for the S&P 500 since the end of October and a 3.6% rally for the Dow Jones Industrial (DJIA).
The index compares stock-market flows in the first half-hour of trade versus flows in the last half-hour on the notion that more experienced traders tend to wait until later in the session to make their moves.
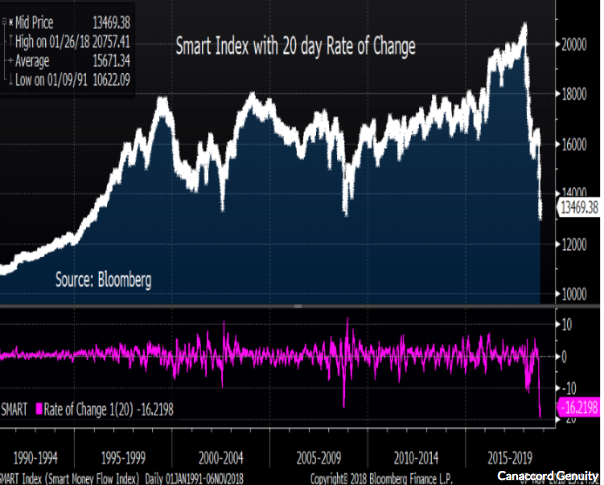
“This late-day activity increases the chances for a retest of the recent lows before stock prices fully regain their uptrend. The second is that buybacks are likely going to be especially important in eventually bringing stock prices back up to their 9 1/2-year uptrend. The third is that large-cap stocks are likely going to be the initial leaders in that rebound, with small-cap and midcap stocks not likely catching up until sometime after New Years’.”
Finom Group thinks this note and the relevance that Reynolds is highlighting regarding the Smart index might be misplaced by investors. The reality is the market is very different than it was 20 years ago and beyond. Assets and the mechanics of the market today didn’t exist 20 years ago. Simply put, the Smart index is anything but smart and here is “the why”. The last hour of each trading day has always seen heavy volume. However, trading is becoming increasingly concentrated in the last hour of trading thanks to the rising popularity of ETFs. These ETFs need to recalibrate their components every single day, and many do so near the closing bell.
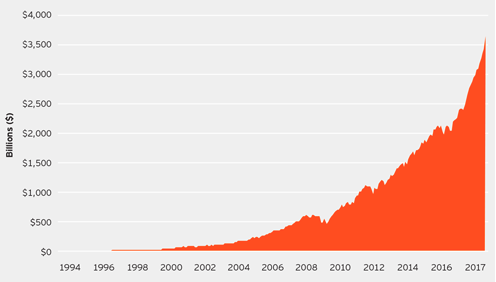
As such, the last hour of trading is no longer dominated by “smart money”. Algorithms increasingly dominate it and passive index funds that are neither “smart” nor “dumb”. It’s simply a newer mechanism in place that didn’t exist some 20 years ago or exist on scale as it does today. So when you see the Smart Money Flow Index dropped so fast during this correction, you now know why. Additionally, ETFs have a massive impact on the market’s daily close. And look at just how much ETFs have grown over the last 20 years.
It’s not human traders and investors who are selling the market at the close, not only. As it was on the day the market had a 900 point swing in the Dow, humans can’t create that kind of move, it’s algos and electronic, programmed trading. Lastly, the Smart index is a Dow tracker. The problem with the Dow is that it’s too focused on big stocks. The S&P 500 is a much better gauge of the entire U.S. stock market because it includes mid-cap stocks as well.
So does this mean the stock market won’t fall because the Smart index really isn’t a valid thesis for forecasting future market moves? No. The market can go up or down for any variety of reasons. We’re simply stating that the Smart index is in no way the sole measure for forecasting a market move, nor has it ever been.
Investor sentiment has still not recovered fully since the October swoon, but it has improved to some degree according to the latest reading from the American Association of Individual Investors survey.
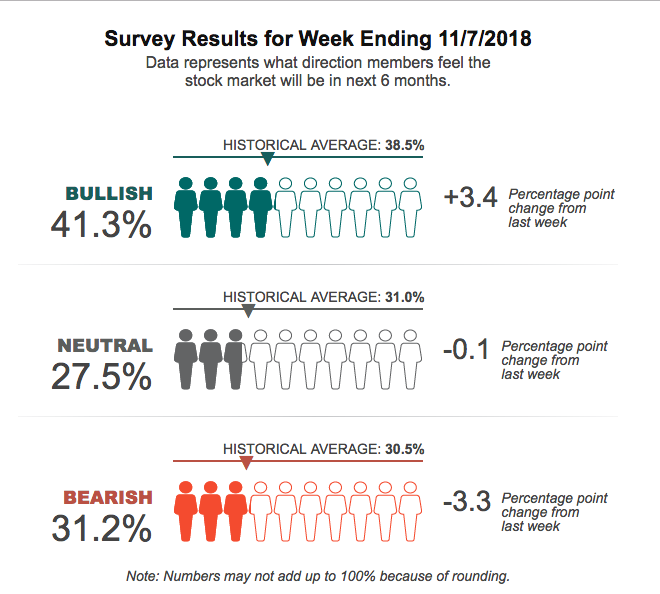
- Optimism among individual investors about the short-term direction of stock prices is above average for just the second time in nine weeks. The latest AAII Sentiment Survey also shows slightly lower neutral sentiment and pessimism holding above its historical average despite a decline.
- Bullish sentiment, expectations that stock prices will rise over the next six months, rose 3.4 percentage points to 41.3%. This is a five-week high. The historical is average 38.5%.
- Bearish sentiment, expectations that stock prices will fall over the next six months, fell 3.3 percentage points to 31.2%. The drop was not steep enough to prevent pessimism from remaining above its historical average of 30.5% for the eighth time in nine weeks.
The recent rebound in the major indexes may have given some individual investors encouragement that a short-term bottom in the stock market has been set. Tariffs and the possibility of an escalating trade war remain front and center in the minds of many individual investors. Also influencing sentiment is Washington politics (including President Donald Trump), midterm elections, economic growth, valuations and corporate profits.
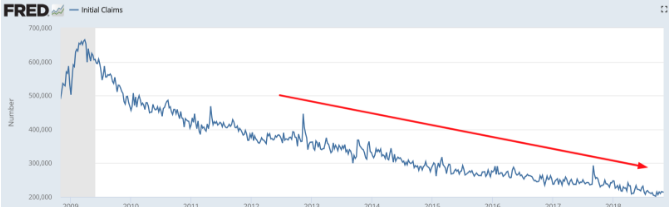
The economic data calendar will wrap up the week with a reading from the Producer Price Index as well as consumer sentiment. On Thursday, jobless claims continued to show a tightening labor market. Thursday’s reading for Initial Claims went down a little from its previous reading (from 215k to 214k). While Initial Claims have mostly been trending lower, they are now starting to trend sideways, having possibly found a low range.
U.S. equity futures are pointing to a negative open on Wall Street this Friday morning. The light volumes in the pre-market trading hours are not necessarily a good indicator on how the trading day will shape-up, but the trending global equity market retracement doesn’t portend a risk-on environment. We’ll have to see if the U.S. markets can buck the global trade later in the day. One market watcher doesn’t think the selling is over just because the first weeks of November trading have found a sharp bounce higher.
According to Lakshman Achuthan, co-founder of Economic Cycle Research Institute, he says one particular chart illustrates the high risk of another wave of selling.

“We’re focused on cycles, the direction of economic growth,” Achuthan told CNBC’s “Trading Nation” on Wednesday. “What we see, and we’ve seen this for quite some time, is that whenever you have a deceleration in growth, you’re going to get some impacts in the equity markets.
In the post-GFC [global financial crisis] environment, the way that that manifests is that you see a higher risk of a market correction.
The question is, is the slowdown over? Is the deceleration in economic growth ending? And since the answer to that is no, the leading indicators still show some weakness in front of us, the risk of another correction remains. It’s that simple.”
While economic growth is and will slow given the laws of large numbers, they are not necessarily and presently expressed in slowing earnings growth. In fact, earnings growth in the Q3 period is now expected to eclipse that of Q1 and Q2 periods. With respect to Achuthan’s economic growth thesis from previous corrections noted within the charts, none found earnings growth on par with present earnings growth and all were resolved with higher equity prices several months later. Additionally, profit margins are presently at record high levels. Given this perspective, it should be recognized that corrections are a normal process that markets undergo as they rationalize valuations and risk, especially when juxtaposed against rising rates. The operation of a market correction as we’re seeing in the various viewpoints offered, can occur for a variety of reasons.


