

Research Report Excerpt #1
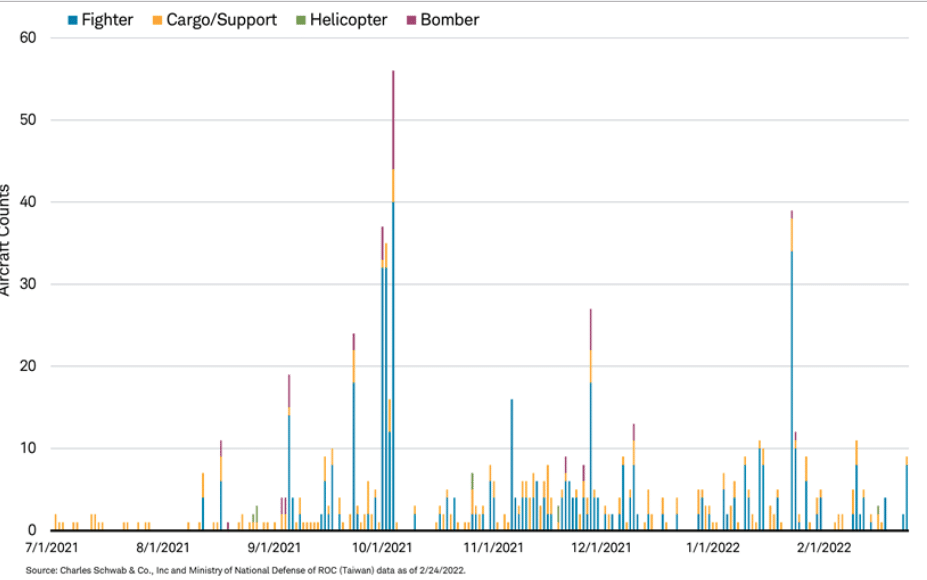
Lastly, we hear a lot of chatter surrounding China and the potential for the CCP to model what Russia is attempting to do with its war on Ukraine. We are not of the viewpoint that China will look to reacquire the independent Taiwan as Ukraine is attempting to do with Ukraine. China’s CCP needs a stronger domestic and global economy. Speculation for China encouraged absorption of Taiwan predicated on Russia attempting to absorb Ukraine remains illogical, given MORE global instability produces weaker global economies. This is not optimal for China.
Research Report Excerpt #2

Moreover, I know there is the temptation to move to cash or simply hold an overweight cash position that is dedicated to buying a 10% dip/drawdown. By the way, we got that 10% drawdown finally and after 400+ trading days. Quite a long time, but if you were waiting for that 10% drawdown to finally buy the dip, there is something you missed over those 400+ days. That capital on the sidelines, that overweighted cash position missed a 26%+ return in 2021 and a 120%+ return since the last 35% correction of March 2020. When we see the words and numbers laid out, we better understand why trying to even market perform with such a buy-the-dip criterion underperforms Buy & Hold.
Research Report Excerpt #3
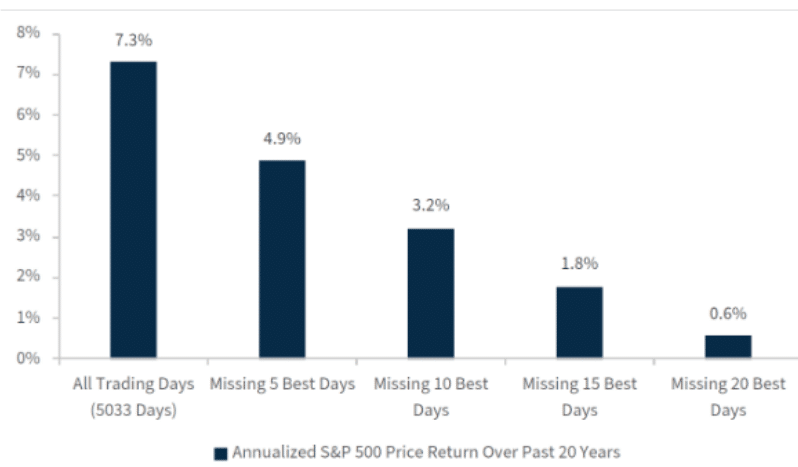
FINALLY, Over the past 20 years, the S&P 500 has grown at an annualized rate of 7.3 percent. However, removing the 5 best trading days over that 20-year period brings the S&P 500 total growth down to 4.9 percent. Missing the 20 best trading days pulls its return down to only 0.6 percent.
“Seth, but what about if you missed the 5 and 20 worst trading days?”
Simple answer: “Tell me when the worst trading days will occur over the next 20 years. Nobody knows the future, we only know with the benefit of hindsight, hence… STAY INVESTED!”
Research Report Excerpt #4
At this point in 2022, we still do not see such an economic condition materializing.
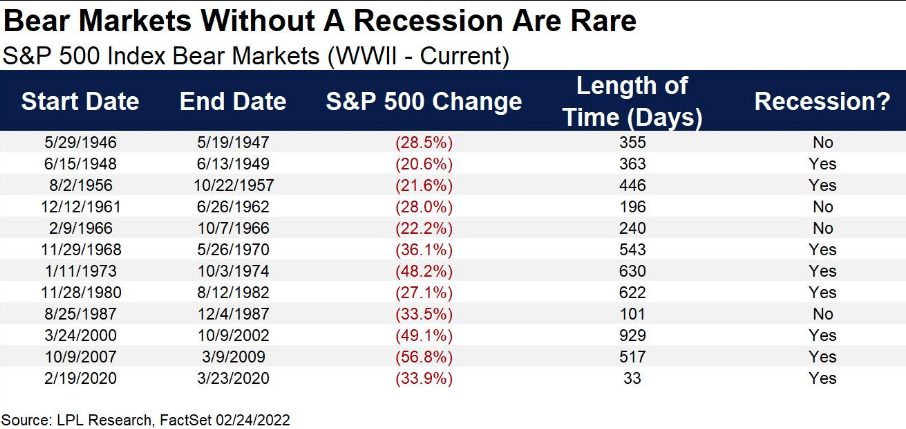
Can you have a bear market without a recession? Yes! But as shown in the table above, there has only been one bear market without a recession going back 50 years (1987). No doubt we had some “near bears” in 1998, 2011, and 2018.
Research Report Excerpt #5
Initial filings for unemployment insurance totaled 232,000 for the week ended Feb. 19, the Labor Department said. That was a touch below the 235,000 Dow Jones estimate and down 17,000 from the previous week.
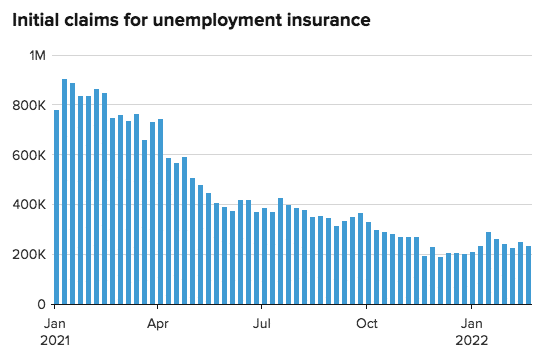
Continuing claims, which run a week behind the headline number, totaled 1.48 million, a decline of 112,000 from the previous week and good for the lowest total since March 14, 1970. While fears surrounding the economy centered on inflation and elimination of fiscal policy supports that expired in September of 2021, the economy continues to show a consumer with a healthy balance sheet, spending habits and an economy with workers engaging open jobs and/or heading back to work.

Research Report Excerpt #6

The chart and table below illustrate the performance of the generic Big Four indicators with an overlay of a simple average of the 4 since the end of the most recent recession (2020). The data points show the cumulative percent change from a zero starting point for April 2020.
Research Report Excerpt #7
Insight/2022/02.2022/02.25.2022_EI/sp-500-forward-12-month-pe-ratio-five-years.png?width=672&name=sp-500-forward-12-month-pe-ratio-five-years.png)
On January 3, 2022, the S&P 500 closed at a record-high value of 4796.56. The forward 12-month P/E ratio on that date was 21.4. From January 3 through February 23, the price of the S&P 500 decreased by 11.9%, while the forward 12-month EPS estimate increased by 2.3 percent. Thus, the decrease in the “P” has been the main driver of the decrease in the P/E ratio since January 3. Indeed, earnings estimates are rising for FY2022. This is also something we will need to monitor come the Q1 2022 reporting season.
Research Report Excerpt #8
The actual price action in 2022 more closely resembles that of 1982 and on a total return basis (red trend line 2022, blue trend line 1982).
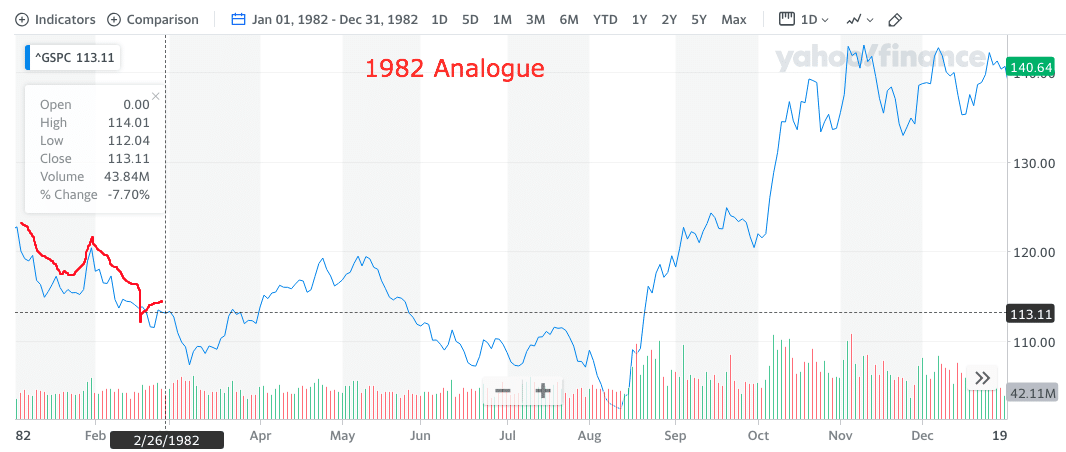
To remind investors/traders, the magnitude of the trend line is less important than the path. Analogues can, and often do, diverge and converge over time. In 1982, the bottom wasn’t found until August, which equated to a -14%+ correction on a closing basis. In 2022, the total correction has been -14.5% on an intra-year basis, but a lesser -10.3% on a closing basis. Where we see the liftoff from March 1982 came at the end of a rate hike cycle, as opposed to the beginning of a rate hike cycle in 2022.
Research Report Excerpt #9
Certainly, while the NYSE A/D Line breeds caution amongst investors, the S&P 500 and its Advance/Decline Line are telling an interesting story, me thinks.
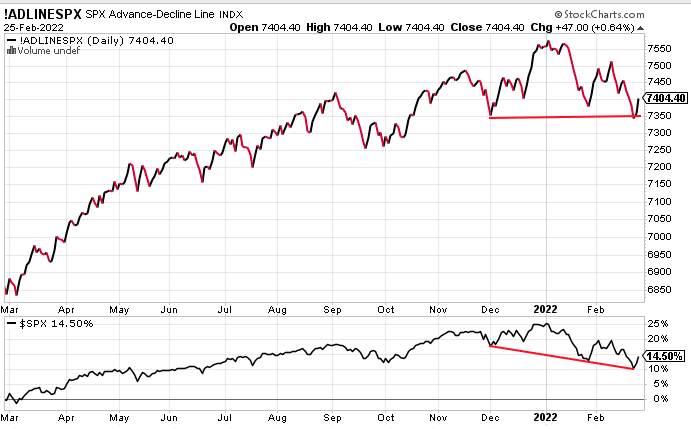
As we can see in the stacked chart above, the S&P 500 A/D Line (top panel) found support at the December low. This, even as the S&P 500 itself (bottom panel) continued to find lower lows in 2022. Breadth in the S&P 500 has been better underneath the index.


