
As has been the case for much of the year, what goes down, must bounce upward. That’s exactly what happened on Wednesday with the major averages dropping sharply and bouncing higher on Thursday. The rollercoaster ride has been nothing short of spectacular with investors along for the ride. One might think the various ups and downs in the market would find investor sentiment declining, but a recent survey from the American Association of Individual Investors.
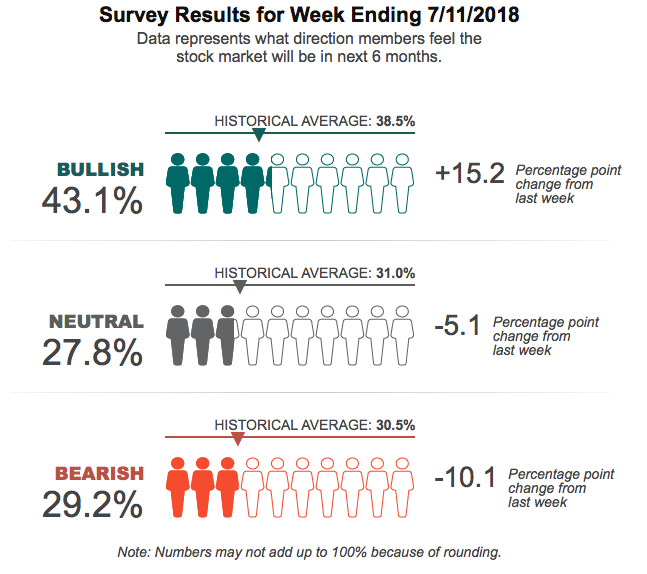
- Optimism among individual investors about the short-term direction of the stock market rebounded, rising above its historical average. This week’s AAII Sentiment Survey also showed lower neutral sentiment and lower pessimism.
- Bullish sentiment, expectations that stock prices will rise over the next six months, rose 15.2 percentage points to 43.1%. Optimism was last higher on June 13, 2018 (44.8%). The historical average is 38.5%.
- Neutral sentiment, expectations that stock prices will stay essentially unchanged over the next six months, declined by 5.1 percentage points to 27.8%. The decline pushed neutral sentiment below its historical average of 31.0%, breaking its 20-week streak above the average.
- Bearish sentiment, expectations that stock prices will fall over the next six months, pulled back by 10.1 percentage points to 29.2%, pushing it below the historical average of 30.5%.
- Many—but not all—individual investors anticipate continued volatility and/or think that the current political backdrop could have a further impact on the stock market. Trade policy is influencing some individual investors’ sentiment as well. While many approve of the Federal Reserve’s plan to continue gradually raising interest rates, some AAII members are concerned about the impact that rising rates will have. Also influencing sentiment are valuations, tax cuts, earnings growth and economic growth.
 Yesterday’s sharp market snapback, like that of the AAII survey’s, showed that despite geopolitical and bond market concerns, investors remain focused on the key driver of equity market performance, earnings. That sentiment has proven to provide equity markets with a backstop of sorts for each market decline through the course of 2018. The Nasdaq hit another record level in yesterday’s trading session with both the Dow and S&P 500 (SPX) up roughly .9% on the day. The market’s performance comes just ahead of highly anticipated earnings from some of the biggest banks Friday. Let’s take a quick look at the S&P 500 technicals prior to discussing earnings with a little more detail.
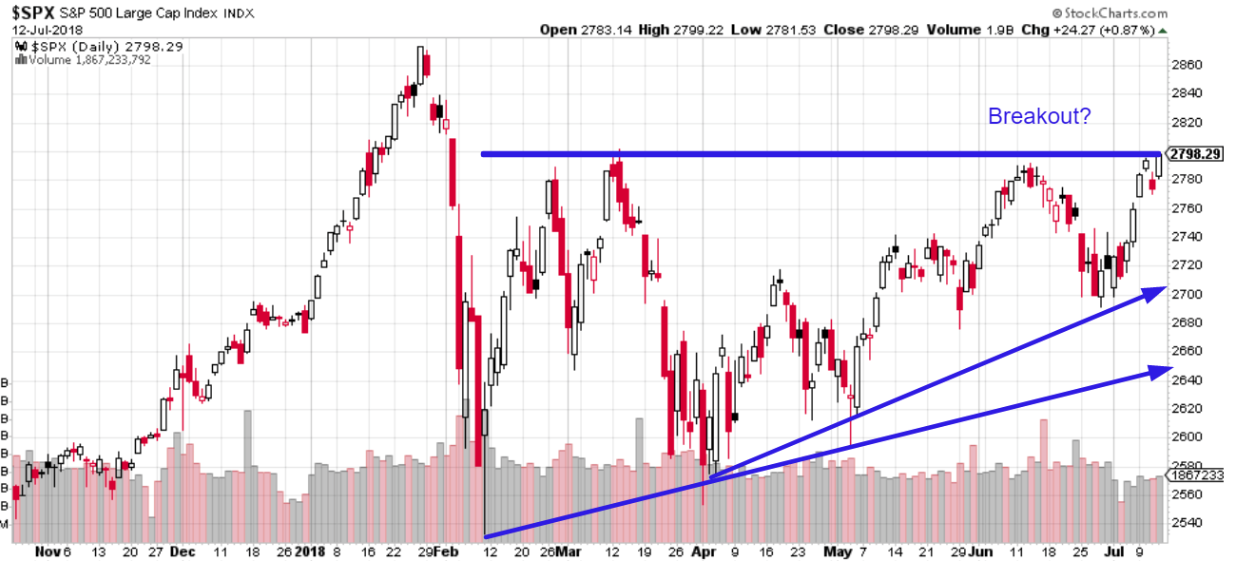
As we can see in the chart above, the S&P 500 has been in a very broad range, stuck in correction territory for several months now. With the S&P 500 closing at roughly 2,798 yesterday and its highest closing level since February 1st, the index is on the verge of breaking out after a period of correction. Additionally, the index is appreciatively above its 50-day moving average of 2,737. Bank earnings will likely determine if indeed the SPX can achieve a breakout and head to all-time highs in 2018.
One thing you might also glean from the SPX chart above is the volume indicator at the bottom of the chart. The stock market’s trading volume has fallen since the onset of July, which also correlates to the more recent market rally. It’s often said that low volume declines or rallies do not confirm market moves in either direction. Simply put, this is a farce. Market volume is prone to seasonality and the summer months historically find volume lesser than all other months of the year. Volume almost always falls during the summer because people are on vacation and less involved with markets. We would expect the volume decline to persist through August before rising again in the fall. Additionally and as it pertains to the next major level for the SPX, Finom Group does expect the SPX to achieve all-time high levels in 2018, even if not in the very near future.
Ahead of the market’s open on Friday the 13th, which we will also highlight the statistics of the date in a bit, three of the nation’s biggest banks report with analysts expecting a repeat of the first quarter, when the sector chalked up record gains. Despite record earnings growth in the first quarter by certain of the big banks, concerns over yield curve inversion and loan growth have served to highlight the financial sector’s underperformance on the year.
“Many bull thesis drivers were baked-in and the flatter curve and tariff concerns have led to a de-rating,” said Jefferies analyst Ken Usdin. “Rising rates will continue to help, but deposit costs are rising faster and loan growth needs to step up.”
Even as the Federal Reserve is hiking rates, the long end of the curve, 10-year yields, have remained under pressure after surging in the spring months. The spread between the 2s and 10s is less than 25 bps presently and threatening to invert when the Fed likely hikes rates in September. There are concerns that banks will be unable to benefit from rising interest rates if long-term rates remain subdued. That’s because net interest margins, or the difference between what they pay depositors and what they charge for loans, will remain compressed.
The banks are expected to report robust trading revenue, given the volatility in stock markets, while capital markets activity was solid. The IPO market had its busiest quarter in three years, with more deals in the pipeline. The debt underwriting market was slower than a year ago, but busier than many were expecting. U.S. mergers and acquisition activity rose 82% to a record $1.0 trillion, according to Thomson Reuters data.
- In terms of the big banks set to report earnings on Friday, here are the expected results starting with JP Morgan Chase. JPMorgan is expected to report earnings of $2.22 a share, up from $1.82 a share a year ago, according to analysts polled by FactSet. The bank is expected to post revenue of $27.557 billion, according to FactSet analysts. JPMorgan has exceeded estimates for EPS for the past 13 quarters, and has beaten revenue estimates for the last 10 quarters.
- Citigroup is expected to report EPS of $1.56, according to analysts polled by FactSet, up from $1.24 a year ago. Citi is expected to report revenue of $18.502 billion, according to FactSet analysts, up from $17.901 billion a year ago. Citi has beaten EPS estimates for the last 13 quarters and exceeded revenue estimates for the last five quarters.
- Wells Fargo is expected to report EPS of $1.12, according to FactSet analysts, up from $1.07 a year ago. Wells is expected to report revenue of $21.677 billion, according to FactSet analysts, down from $22.169 billion.
The major averages are in much need of support from the financial sector reported results and investor participation. It’s unlikely that the Dow and S&P will outperform without the financials in the near term. But with that in mind, let’s look at some of the fears surrounding the date of Friday the 13th given its infamy.
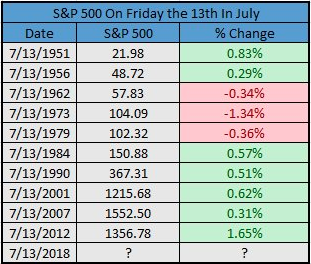
The table above identifies that in the last 5 years, the SPX has risen on Friday the 13th each time. It remains to be seen whether or not the streak will continue and most obviously it will depend on investor’s perception of the banks’ reported results. As of Thursday’s close, all three benchmark indices were set for weekly gains, with the S&P on track for a 1.4% advance, the Nasdaq eyeing a 1.8% rally and the Dow set for a 1.9% rise for the week.
With all the ups and downs or volatility in the markets over the last several months, trading opportunities have been abundant and Finom Group continues to deliver such trading opportunities to subscribers.
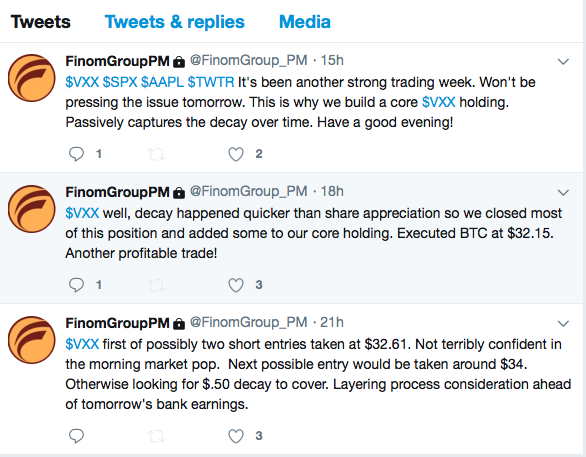
The screenshot above depicts our real time trade alerts and the most recent successful trade within the volatility complex. Subscribe today and trade with Finom Group. To date, our hit rate on all trade alerts has achieved an above 90% success rate. Our primary driving of trading activity continues to be within the volatility complex. At present, the VIX is slightly higher on the day and ahead of reported bank results. Having said that, the VIX is expressing complacency in the market at roughly 12.5% and well below the historic average of 19-20 percent. When stripping out major annual spikes dating back to 2013, the median VIX reading is 13-14 percent. As such, the market is likely expressing volatility as it correlates to the backdrop of fundamental market performance over time.
Next week marks VIX futures expiration as indicated in the CBOE’s table of VIX futures below. For those of you unfamiliar with the table, it comes directly from the CBOE’s website linked. Keep this as a reference point for future due diligence. The columns are indicated by the monthly VIX futures contracts off to the far left side.
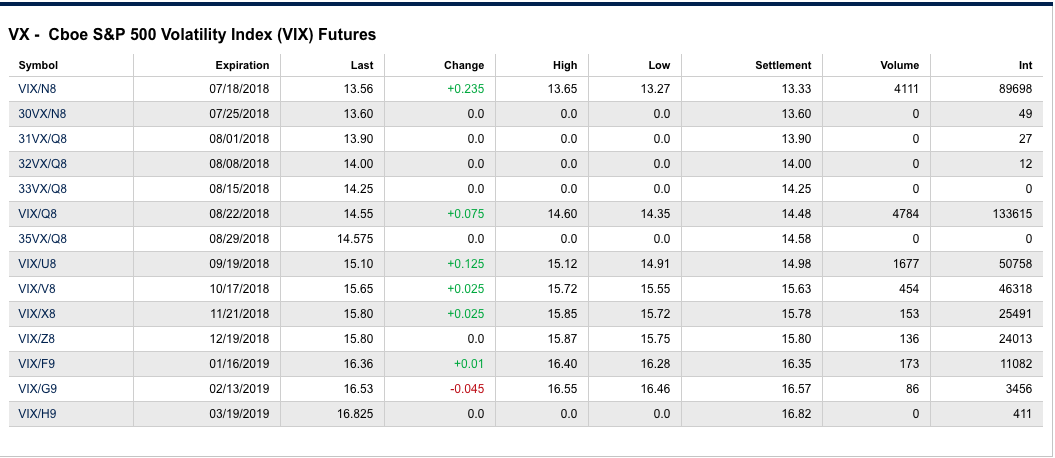
VIX/N8 is known as M1 or F1 (month 1 or futures 1) depending on whom you ask. The expiration of these futures contracts is 7/18 or next week Wednesday morning. Futures have a lifespan of roughly 1 month, expiring monthly. Going down the list of monthly VIX futures contracts we have the August VIX futures contracts identified by VIX/Q8, which will roll forward next Wednesday and expires on 8/22/18. Roll forward? As the VIX/N8 futures expire next Wednesday, the back month VIX futures contract roll forward to take its place. The former m2/f2 becomes the new m1/m2. And so on down the list of VIX monthly futures contracts.
We can take this table of VIX monthly futures contracts and correlate them to VIX term structure, the term being monthly of course. So let’s go to a chart of term structure, which can be viewed at vixcentral.com linked. Again, save the link for future reference and review. We review term structure periodically throughout the trading day as it expresses the change in VIX futures contracts and is updated by the minute at vixcentral.com.
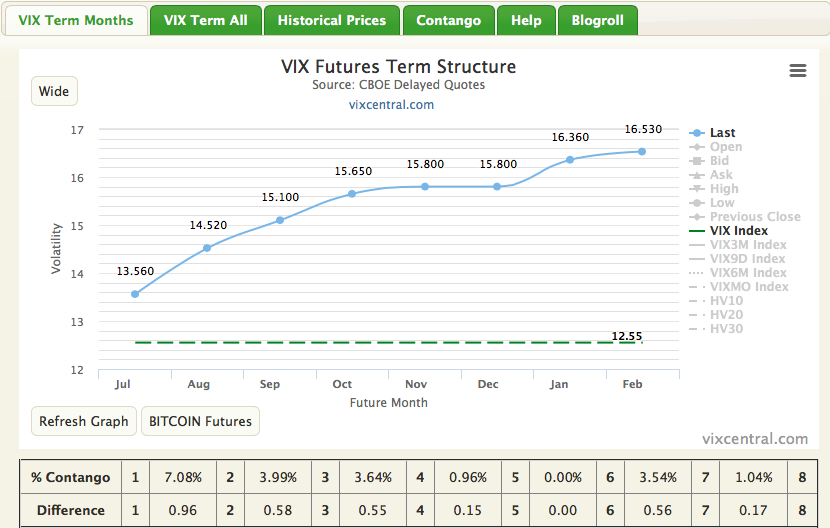
This is term structure, identified by the upward sloping curve against the value of the VIX represented by the static, horizontal dotted green line. In the chart we can see the current value of the VIX is 12.54. The current value of m1/f1 is 13.56 on the curve, represented by the left most blue dot. We see the value of m1/f1 is the same as in the CBOE’s monthly VIX futures table. From this point all monthly VIX futures contracts can be identified be they on the CBOE’s table or within the chart of term structure at vixcentral.com.
Given that next week Wednesday marks expiration of m1/f1, the futures contracts will need to converge onto spot VIX price by this date, decaying the price value of VIX –ETPs like UVXY, TVIX, VXX. The amount of monthly decay depends on how much convergence takes place over the course of the monthly VIX futures life cycle.
While there is much more to the monthly VIX futures term structure to discuss and or outline going forward, we’ll look forward to the trading day and hopefully find Friday the 13th to be a positive one for equities and traders.


