
Welcome to another trading week. In appreciation for all of our Basic Membership level participants and daily readers of finomgroup.com content, we offer the following excerpts from within our weekly Research Report. Our weekly Research Report is extremely detailed and has proven to help guide investors and traders during all types of market conditions with thoughtful insights and analysis, graphs, studies, and historical data. We encourage our readers to upgrade to our Contributor Membership level ($14.99/monthly, cancel anytime) to receive our weekly Research Report and State of the Market videos. Have a great trading week and take a look at some of the materials from within this week’s Research Report…
Research Report Excerpt #1
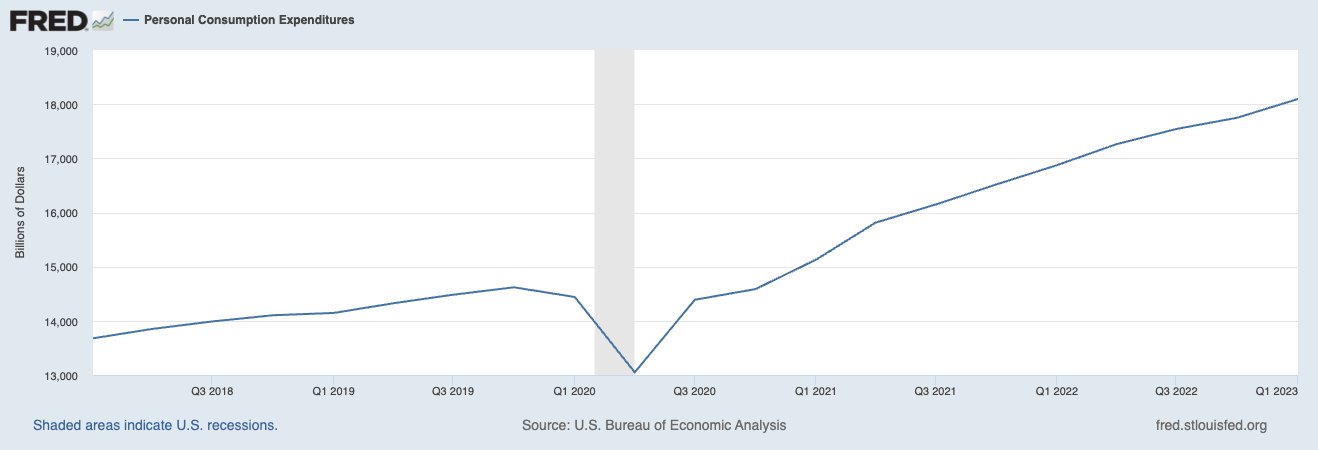
It is important to note, however, that with the aforementioned economic conditions, they were almost always accompanied by a sharply rising Unemployment Rate and declining consumer spending. Neither of these two key economic variables has taken place this cycle. The Unemployment Rate is lower today than a year ago, and consumer spending remains ever-higher (chart below).
One of the biggest, if not the absolute biggest headwind for the economy in 2023 was simply a Rate-of-Change (ROC) issue.
Research Report Excerpt #2
The indexes for new orders and shipments both increased for the second consecutive month but remained negative. The index for current new orders rose 14 points to -8.9, and the current shipments index edged up 3 points to -4.7.
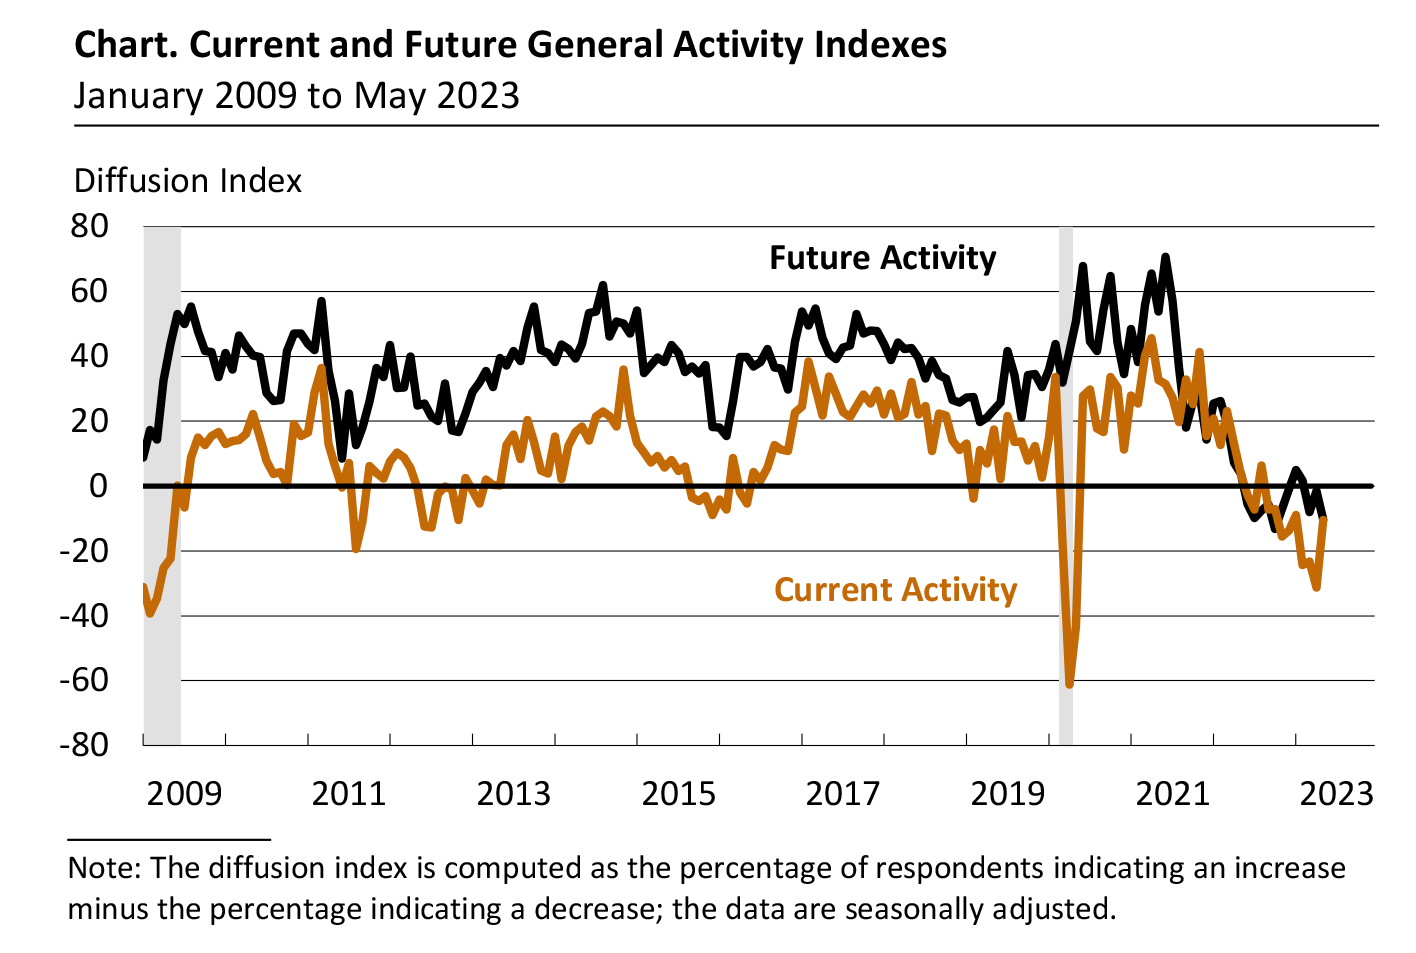
As we can see from the chart above, current activity rebounded, but future activity is expected to prove weakening by survey respondents.
Research Report Excerpt #3
As usual, the economy is never  utopian-like. There are always economic issues of the day, quarter, and year. With an $19trn economy, there will always be issues. But, and it is the biggest BUT of them all… so long as the U.S. household balance sheet looks like this…
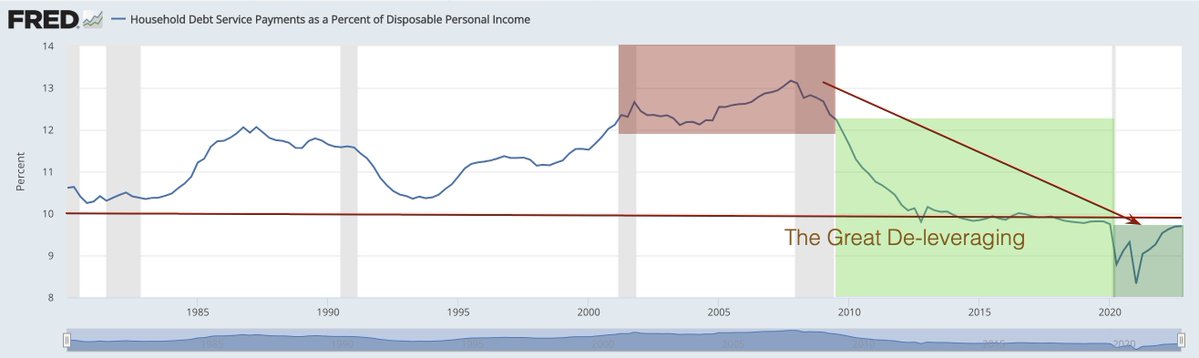
… a recession will likely demand an exogenous shock to bear out a recession in the U.S. economy. In a consumption based economy, if the #consumer is healthy, the economy proves healthy.
Research Report Excerpt #4
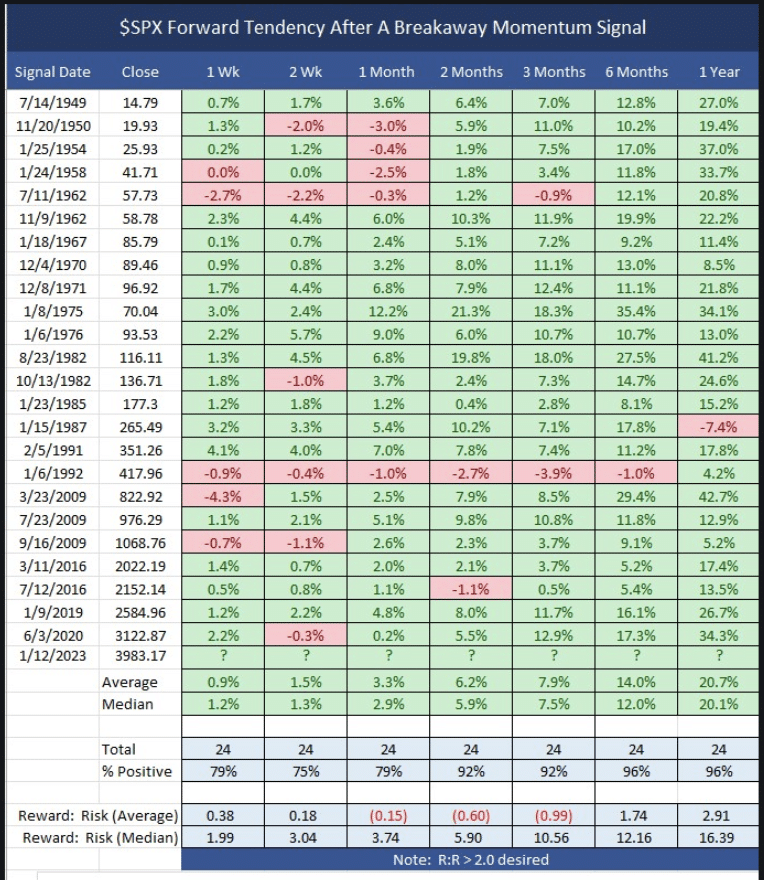
With the S&P 500 4-months removed from the signal, indeed, the index has a positive performance since. Looking at the table, we can also determine that 6 months after the signal (July 12, 2023), the S&P 500 has been higher 96% of the time since 1949. In fact, the last time the S&P 500 was lower, after a signal, was in 1992.
Research Report Excerpt #5
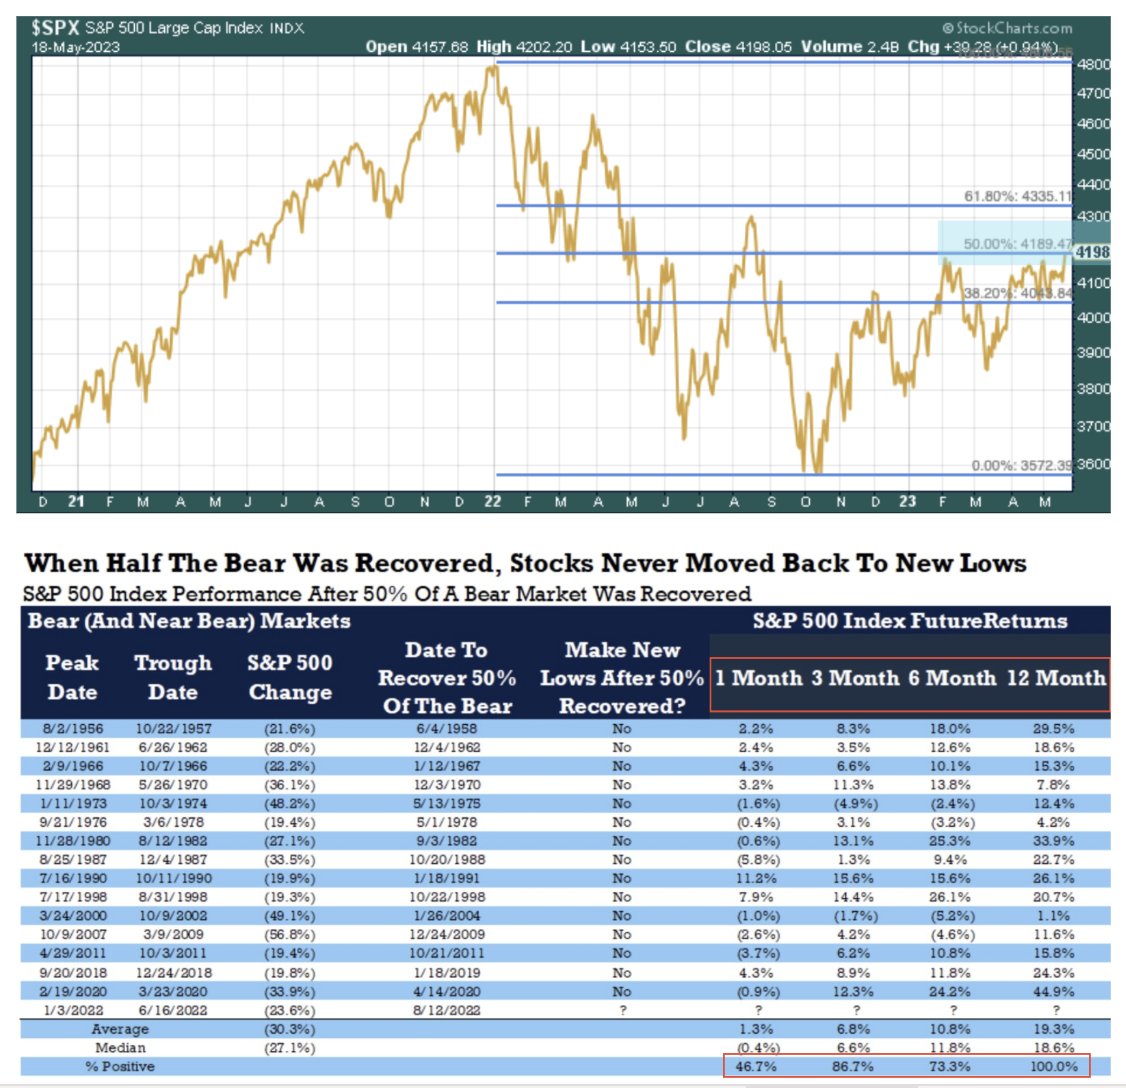
Only 1 time in history has the S&P 500 achieved a 50% bear market retracement and made a lower-low thereafter… 2022. I know that seems too close in proximity for many to focus on the bigger picture, which is prior to 2022 there was never a lower-low after a 50% retracement of a bear market. If this is you, what I would then ask is whether or not you believe a lower-low will happen 2 consecutive times, in back-to-back years, and having already likely priced the majority of a recession that hasn’t yet occurred? That seems like a lot for the market to achieve, don’t you think.
Research Report Excerpt #6
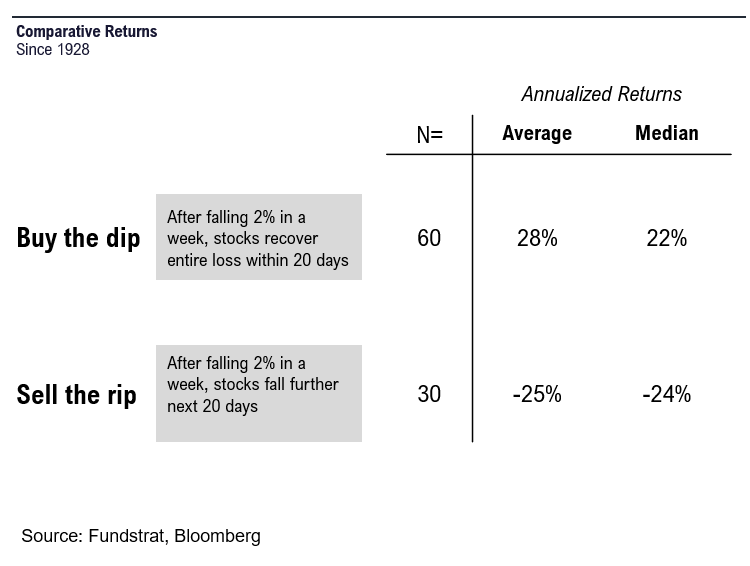
In addition to the aforementioned buy-the-dip study, Fundstrat has looked at such data with a longer time frame.
- if we are in “buy the dip,” losses are recovered quickly
- if we are in “sell the rip,” further losses are seen
To model this, they looked at all 2% 5D drawdowns and calculated market returns over next month (20D) and to smooth this, looked at 6M rolling averages. The criteria for:
- “buy the dip,” is gain >2% next 20D
- “sell the rip,” is decline <-0.5% next 20D
As shown below, the differences in returns during these regimes is quite significant. Since 1928, the regimes and resulting annualized returns are as follows:
- “buy the dip” 60 times and avg gain 28% (annualized)
- “sell the rip” 30 times and avg loss -25% (annualized)
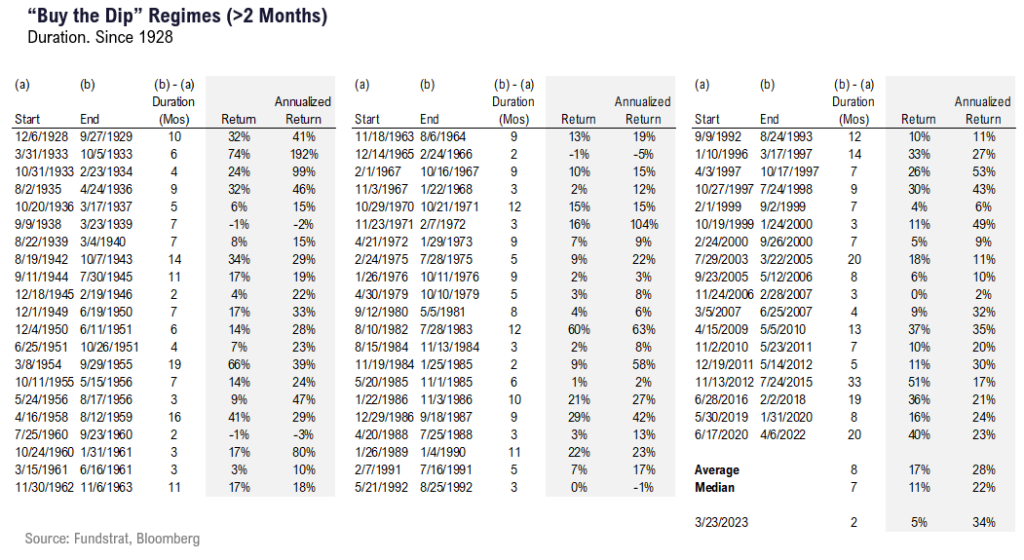
The full list of instances is shown below. There are 60 regimes of “buy the dip” and 30 regimes of “sell the rip.”
Research Report Excerpt #7

The fact that Net New Highs within the Nasdaq 100 has reached the highest point in more than a year, suggests that breadth is possibly overheating for the Nasdaq 100, but portends a backstop during future bouts of consolidation. In other words, buy-the-dip (not advice but regime recognition).
Research Report Excerpt #8
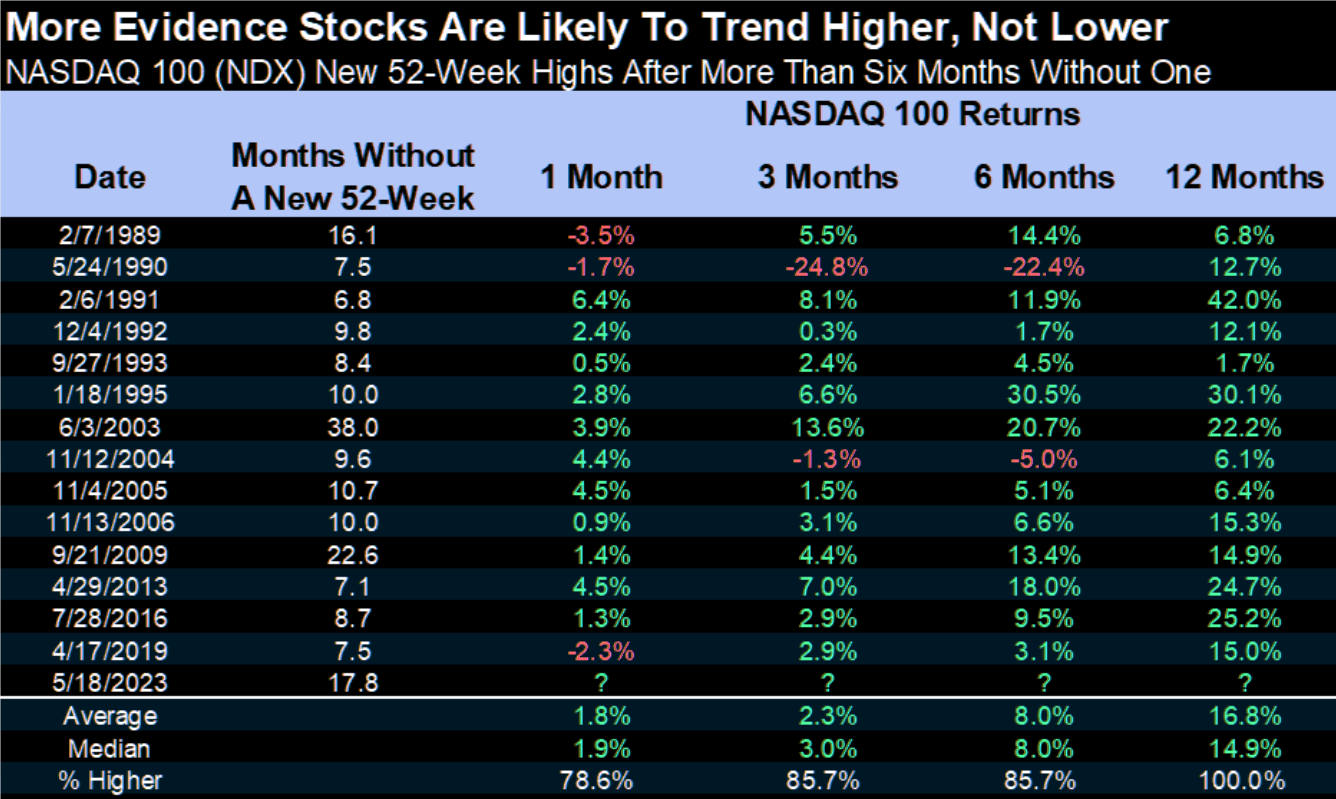
As overheated and possibly overbought as the index has become, the historic data in the table above suggests the index will continue higher over the next 12 months, at least. Stocks were higher a year later 14 out of 14 times after new 52-week highs were made following >6 months without one.
Research Report Excerpt #9
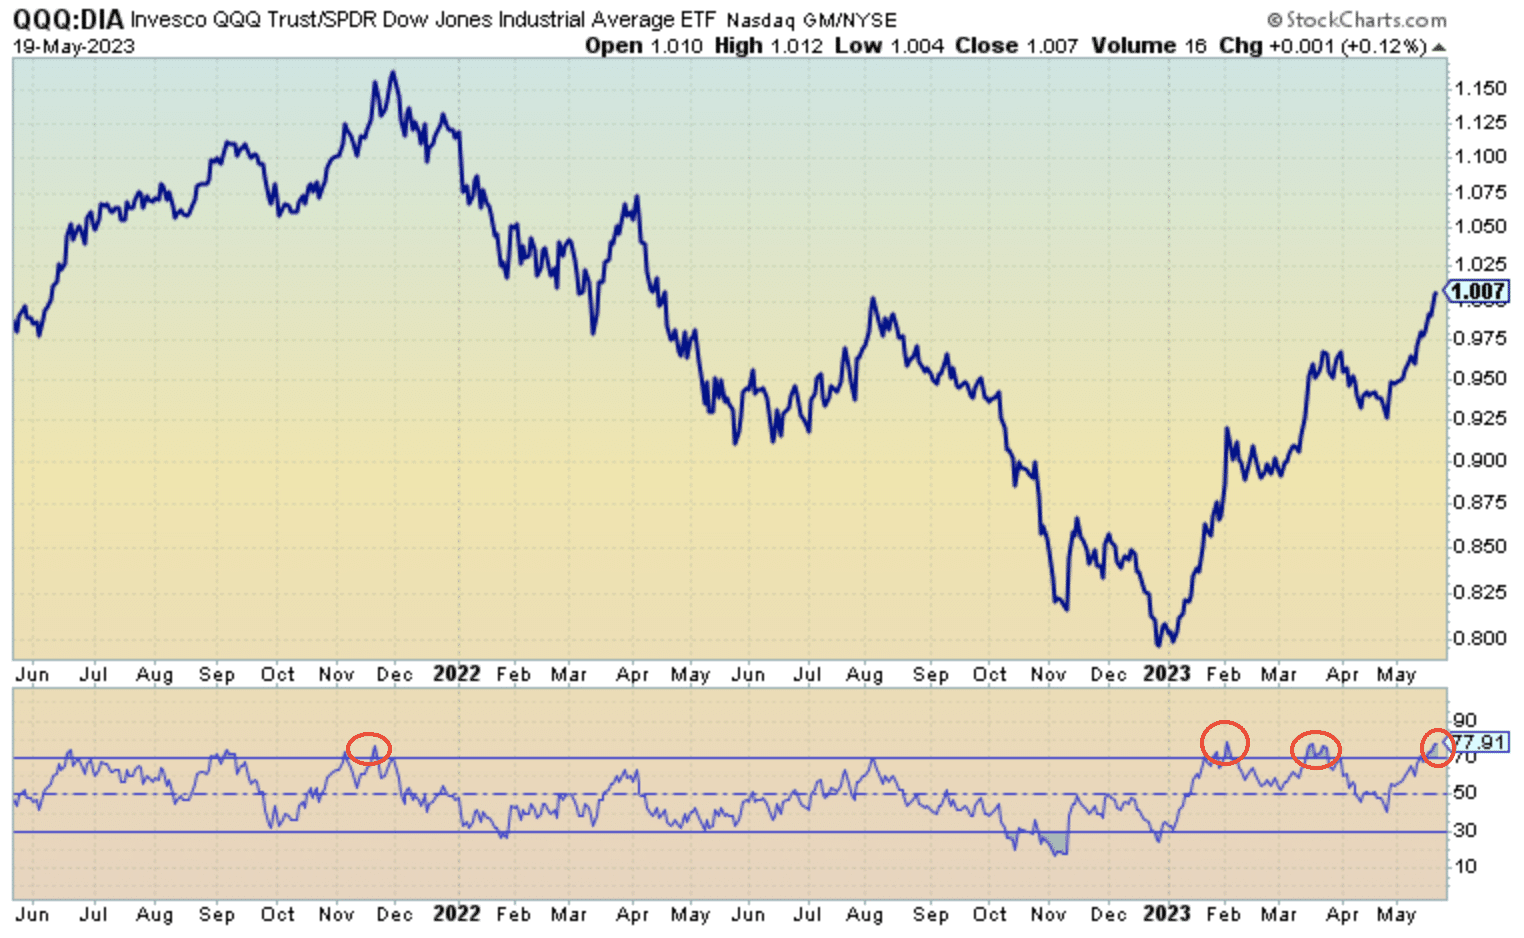
As we can see, the RSI is above 70, typically associated with a performance and absolute basis ratio that is characterized as overheated. Looking at the circled red indicators in the RSI panel, we can connect the dots to a consolidation in the performance ratio thereafter.


