There are good reasons that new traders are washed out of the markets within their first 2 years of trading. The first is likely due to a lacking of discipline and dedication to the investing craft. The second reason is a lacking of respect for capital investing and the process surrounding capital investing, well. The third reason is that absent the aforementioned, failure sets in. Lastly, and the lesser probable outcome, is that the trader recognizes the benefits of investing and moves beyond short-term trading to longer duration investing.

In 2022, a great many of the would-be traders that began their respective venture since 2020 have been eliminated from the investing and trading landscape. Simply put, if you’re reading today’s macro-market update, we would be of the opinion that you’ve elevated your skill-set and resourcefulness for strong, long-term investing outcomes. Good on you bruh! Also, we hope you enjoy the content-analysis beyond this point and look to achieve access to our greater library of macro-market research and analysis available within our Contributor and Premium memberships ($9.99 and $59.99 respectively).
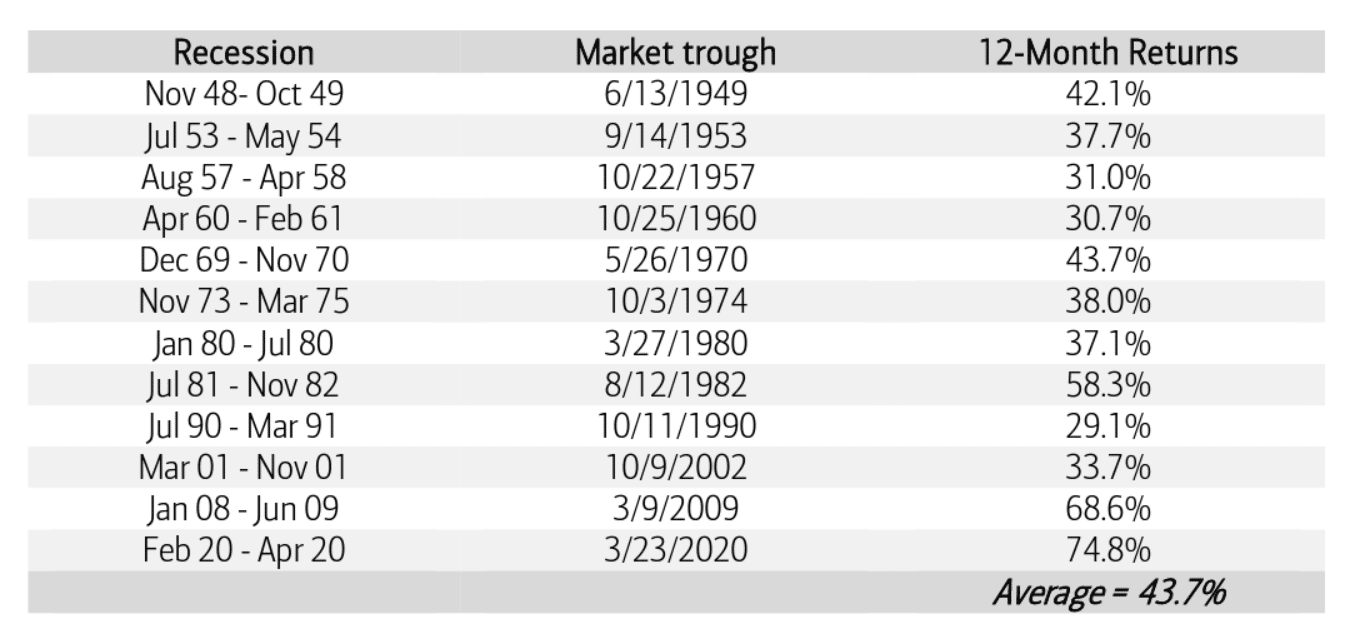
So let’s chat about “what the frig” is up with the markets in 2022, because it isn’t the market we’ve come to know and love since the 2009 market trough. This is the longest and deepest bear market ,absent a recession and since WWII, that many have witnessed. First (firstly is not a word), know that the uniqueness of the bear market is an opportunity, even if it doesn’t feel that way today. When markets are down, the savvy investor turns fearfulness into bargain shopping. Buy low… wait… sell high! Why are there such bargains today?
Every quarter in 2022 has found a higher Terminal Fed Funds Rate (FFR). This is the “rate” at which market participants are pricing the peak of the FFR, for the ongoing “rate hike” regime. The Federal Reserve began the calendar year with the FFR at 0-25bps, and it has risen to 300-325bps since the first rate hike was administered in March of 2022. Since the first rate hike of 25bps, the rate hikes have come in a fast and furious manner, with 3 consecutive FOMC meetings ending by raising rates 75bps at each meeting. At the latest September FOMC meeting, the Fed raised rates by 75bps and the Fed’s proverbial “dot plot” projected rate hikes would likely continue into 2023 and find the Terminal FFR achieving 4.6 percent. (see table of FOMC projections for FFR below, outlined in Finom Group’s State of the Market back in September)
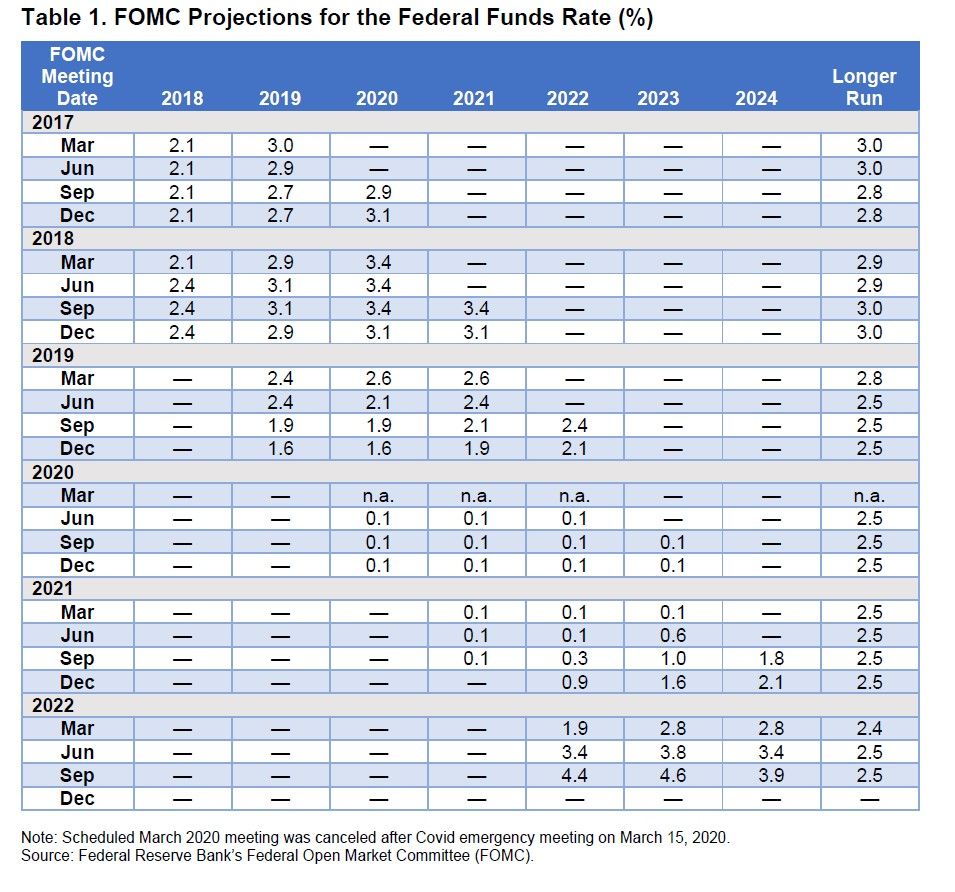
- New Fed dot plot implies significantly more Fed tightening in the coming months
- Another 125bps by year-end suggesting 75bps in November and 50bps in December
- Median fed funds rate expectations:
- 2022: 4.4% (was 3.4%)
- 2023: 4.6% (was 3.8%)
- 2024: 3.9% (was 3.4%)
- 2025: 2.9%
As noted in the bullet points above, there has been a steady climb in the FFR projections, forcing investors to recognize that the terminal point for the FFR was marching ever-higher. It’s one of the major reasons we continue to see bonds in a bear market with bond yields ever-higher. Since the September FOMC meeting and since the release of the September CPI, market participants have begun to price the terminal point for the FFR upwards of 4.75 percent (chart below).
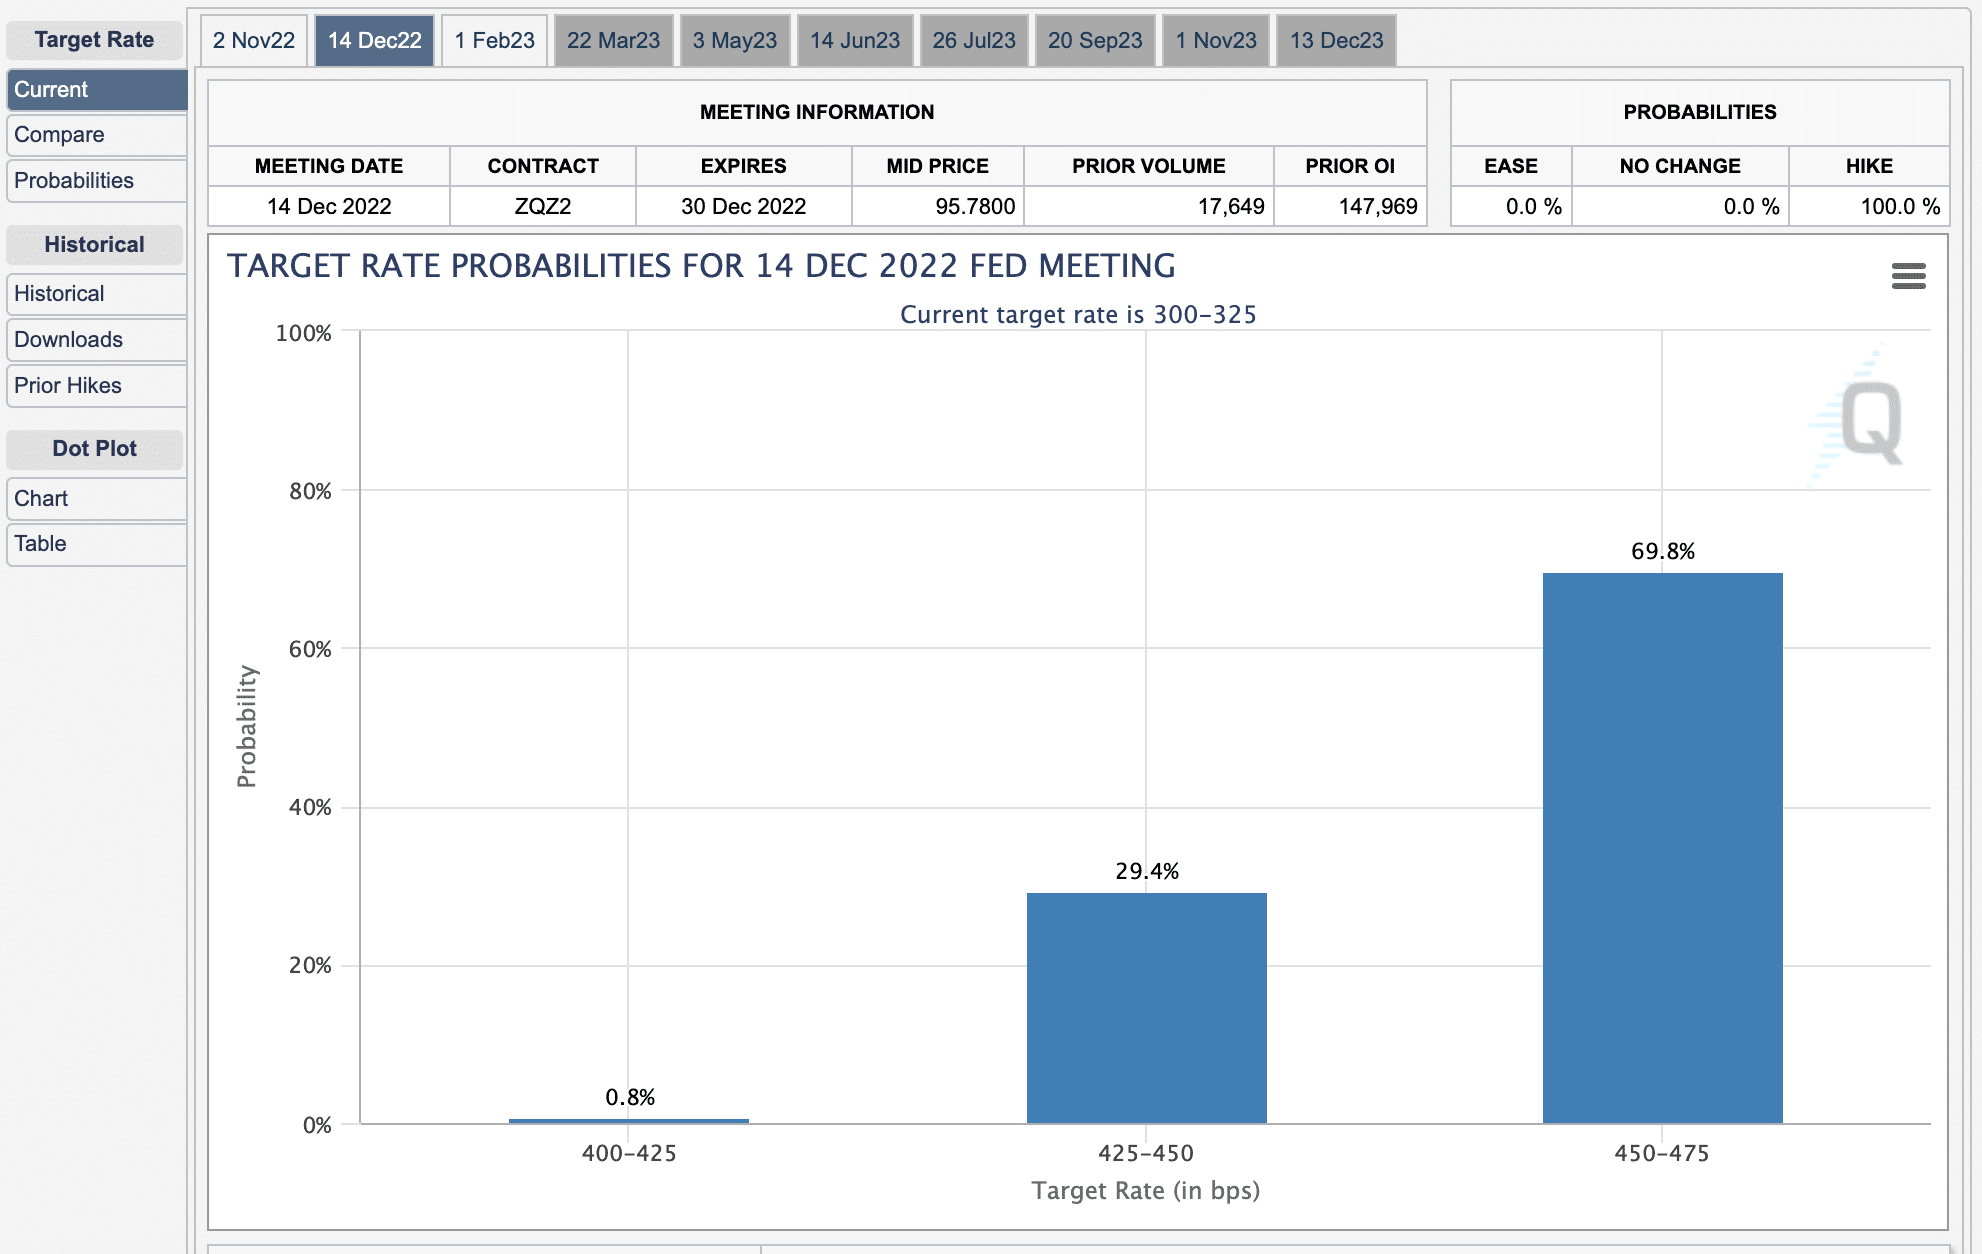
The former path of rate hikes assumed a 75bps hike at the upcoming November 2, 2022 FOMC meeting and 50bps at the December 14, 2022 FOMC meeting, for which the market had already priced, equities and bonds found lower-lows… yada yada yada. As we can see in the Fed Fund Futures chart above (CME FedWatch Tool), however, is that there is now a greater probability of a 75bps rate hike at the December meeting, rather than the former probability of a 50bps rate hike. This shifts the projection for the terminal FFR from 4.5% to 4.75%, hence equity and bond markets further de-rated, and found even lower-lows last week with the Equity Risk Premium proving even less attractive than before. Yes, if something materializes to suggest that inflation is finally showing itself to decline more rapidly or the economy itself is slowing, these projections for the terminal point of the FFR can edge back lower, but until then the Fed is driving markets, as each passing month seems to price an even higher Fed Fund Rate.
In just the last couple of days (Wednesday/Thursday), however, the relentless pursuit of an ever-higher terminal point for the FFR found market participants pricing it up to nearly 5% for 2023, and before the probability of the Fed cutting the FFR.

The 10-yr. Treasury Yield jumped 23bps since Wednesday, with equity prices faltering once again, and which has been the trend all year; Treasury yields up, stocks… down! This latest move in yields, however, may prove the extent for which market particpants price a higher terminal point for the FFR until the next FOMC meeting on November 2, 2022 and possibly the year. At this point, the likelihood that the market has priced in the full extent of rate hikes hence forth is extremely high. With a blackout period for Fed speaking engagements starting next week, investors may get a repreive from higher yields leading into the FOMC meeting. 🤷♂️ As such, one might see improved equity market performance post monthly Op/EX week. Not a prediction, but a possibility. (chart from Eric Wallerstein of WSJ)
As it pertains to the aforementioned Equity Risk Premium (ERP), the 2 key main cogs in calculating the ERP are Earnings and the so-called “risk-free rate”, or 10-yr. Treasury yield. If earnings estimates were rising as the year progressed, the S&P 500 probably would have trough already, but since the end of the Q2 period, we’ve actually seen FY 2022 EPS estimates move lower, as the 10-year Treasury yield has climbed higher in its pursuit of an ever-higher FFR.
Think back to the former June lows for the S&P 500, and the subsequent rally which lasted through July. This tweet depicted below was offered in early July, when the ERP was actually attractive for investors.
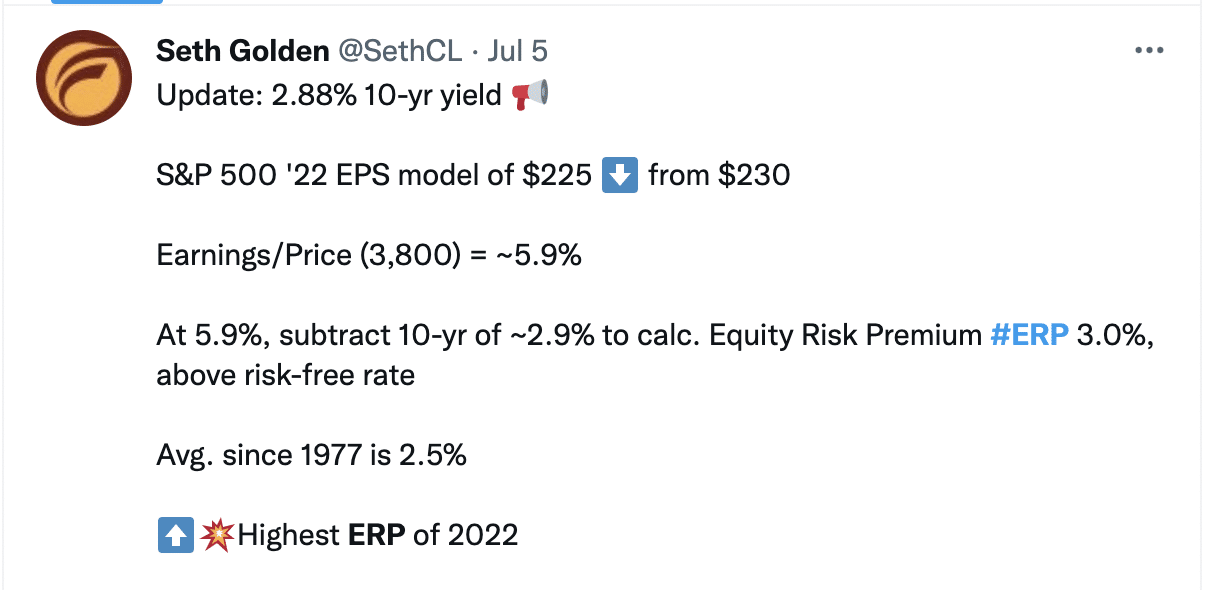
Take notice that the ERP was the highest level for the calendar year in July and during the equity market rally. Back then, the ERP was roughly 3 percent. Earnings season was wrapping up and Treasury yields were falling from their peak. Fast-forward to the Q3 period, and earnings estimates are edging lower with yields marching steadily higher. So now, if we perform the ERP calculation, this is what we find: (ERP historic chart below)

At a 4.25% 10-yr. Treasury yield
S&P 500 ’22 EPS model of $223 from a former $230
Earnings/Price (3,650) = ~6.1%
At 6.1%, subtract 10-yr. yield of ~4.25% to calculate the Equity Risk Premium at/= 1.85%, well below the risk-free rate and well below the average ERP since 1977 of 2.5%
And there in lay the reason equities, despite persistently oversold conditions, many attempted relief rallies throughout the year, markets remain with bear market conditions and have consistently found lower-lows. The ERP remains unattractive for equity investors and the probabilities of even higher rates and yields keeps investors on the sidelines. Baird’s Michael Antonelli offers a concise opinion on the attractiveness of stocks in the following:
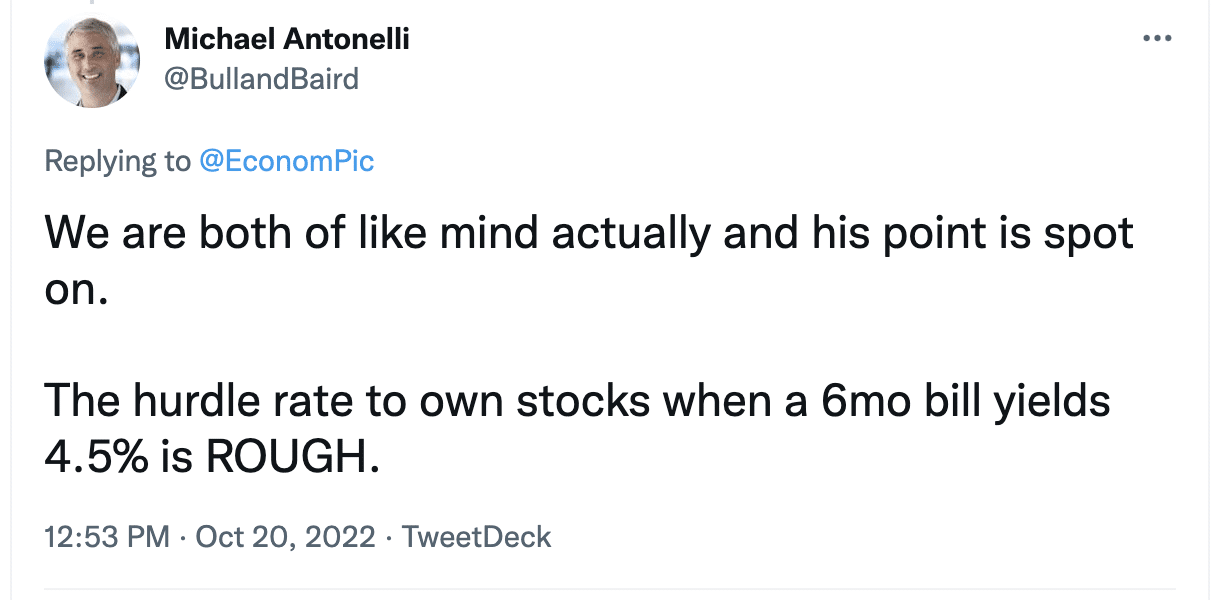
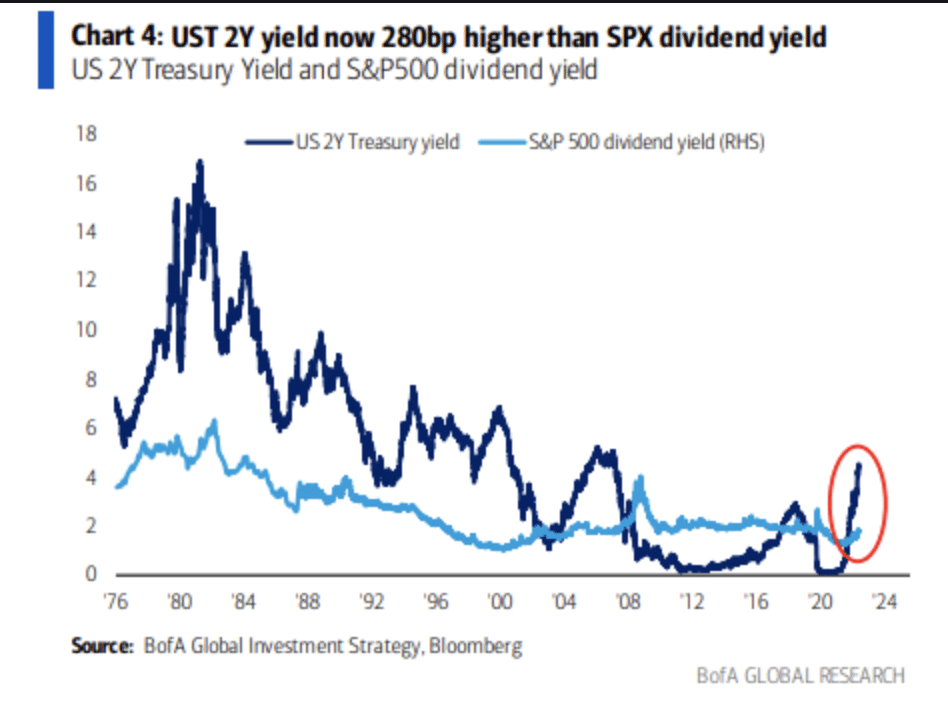
Another way to rationalize the unattractiveness of stocks, presently, is through the S&P 500’s dividend yield. When compared to that of the 2-year Treasury yield, the S&P 500’s dividend yield is 280bps less than that of the 2-year Treasury yield. No; this will not be an “eva’ situation”, of course. At some point in the near-term, this juxtaposition that defines where the greatest yield for your capital dollar investment can be found will revert to the former regime, finding equities more attractive than they are today.
We would like to suggest the economy is in the dumpster, and fundamentals are dreadful for corporations, but at best we can only suggest the economy has remained resilient, albeit with certain industries performing below that of others, namely housing. No recession is present, with 48 of 50 states still in expansion mode as evidenced by the Philly State Coincidence Index.
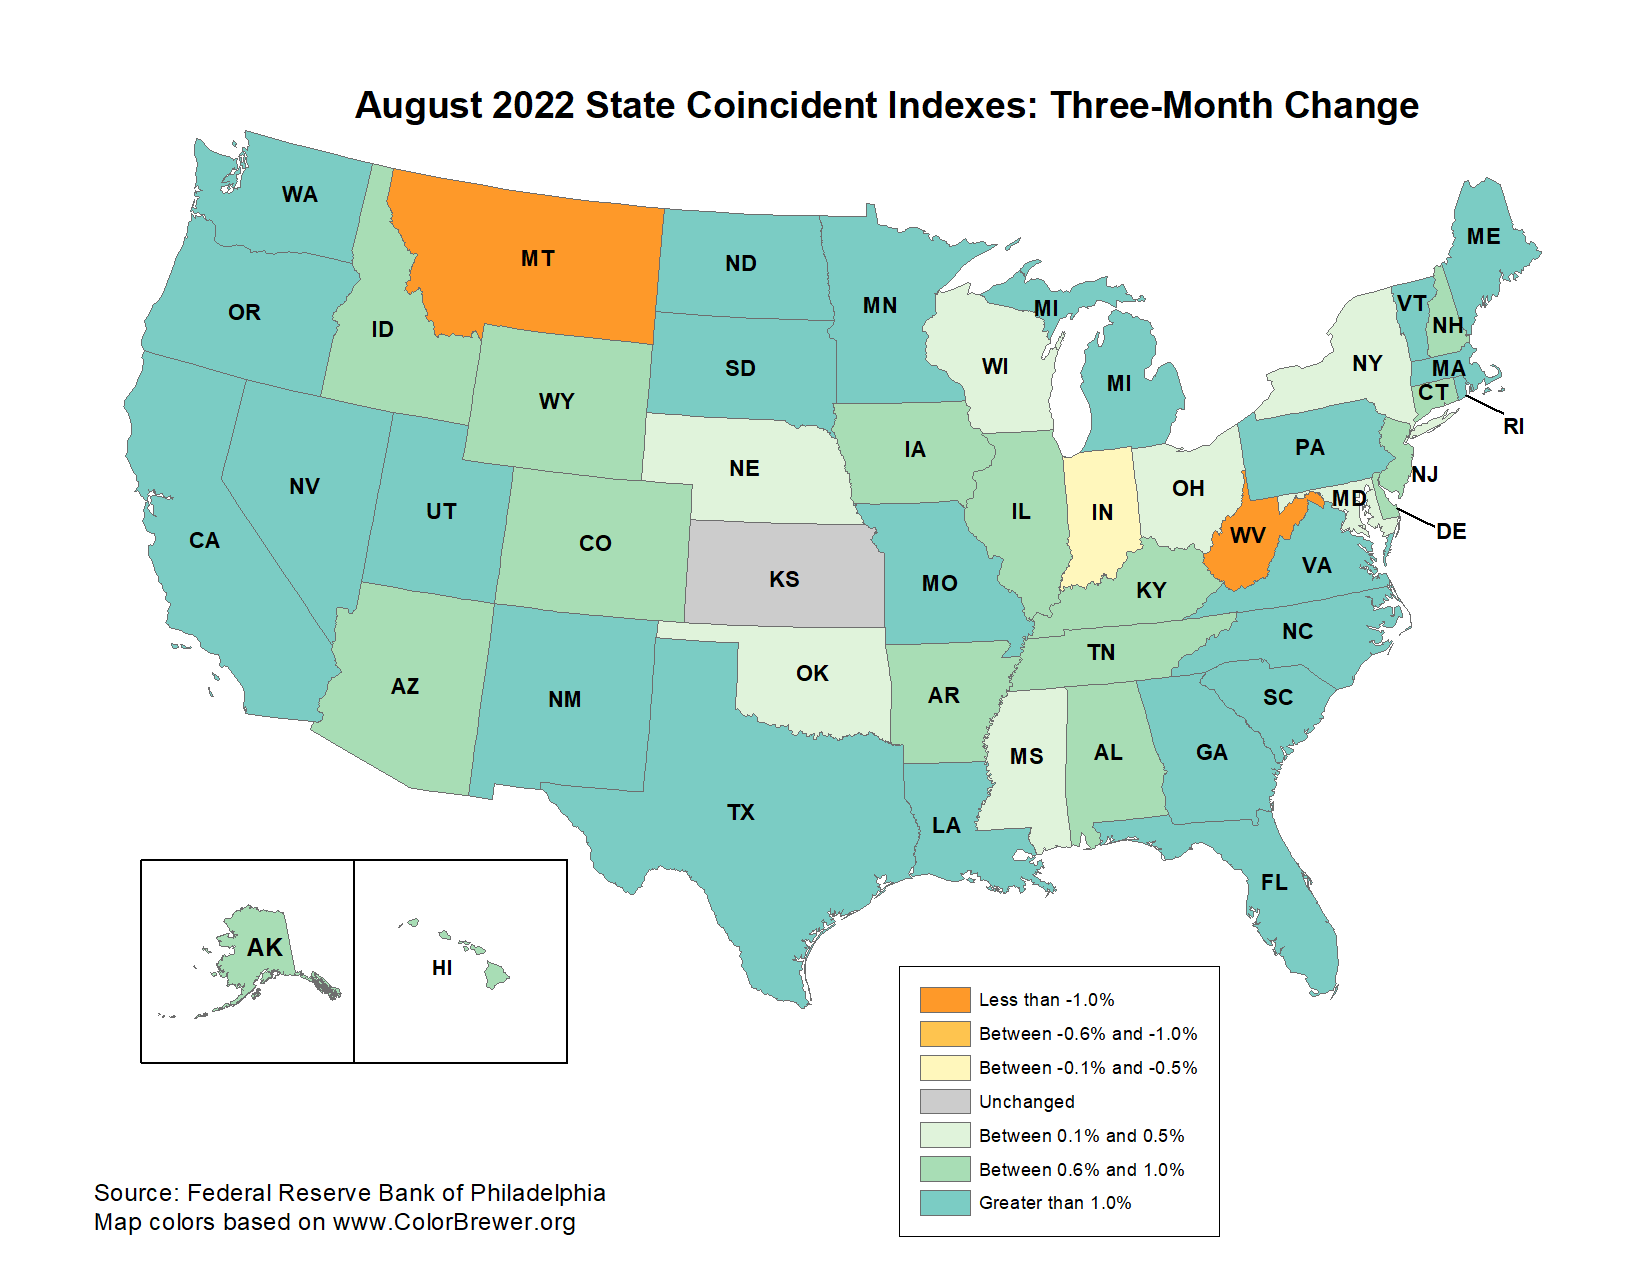
The coincident indexes combine four state-level indicators to summarize current economic conditions in a single statistic. The four state-level variables in each coincident index are nonfarm payroll employment, average hours worked in manufacturing by production workers, the unemployment rate, and wage and salary disbursements deflated by the consumer price index (U.S. city average). The trend for each state’s index is set to the trend of its gross domestic product (GDP), so long-term growth in the state’s index matches long-term growth in its GDP. A major difference in the state coincident index from the BLS GDP calculation is trade and business inventories are absent the coincident index. It is a more effective gauge of true economic activity potential in this sense.
Nonetheless and as previously mentioned, we wish the equity market was outlining economic pain, but it simply isn’t, at least not to the extent a 25% drop in the S&P 500 might assume. This holds all the trappings of de-rating cycle. The de-rating cycle will likely persist through the duration of the Fed’s monetary policy tightening cycle. And no de-rating cycle analysis would prove complete without reviewing the de-rating of the S&P 500’s multiple during de-rating cycles of the past…

While it’s fun and lends to the fearful popularity of bear markets to model the S&P 500 trough around recession trough P/E multiples in the past, this makes little to no logic. The forward P/E multiple expands over time, full stop, fact. Most will denounce this fact due to the, also fact, that the P/E has not achieved the former Dotcom bubble highs. Having said that, perform a techncial channel analysis of the P/E multiple since 1950; tell me what you see 😉, but we digree. Knowing the P/E multiple expands over time, the starting point for most cycles will prove higher than past cycles and express inconsistent trough P/E multiples during recessions/bear markets.
As shown in the J.P. Morgan chart of former de-rating cycles (de-rating of the S&P 500’s P/E multiple), the median P/E multiple de-rating has been roughly 6 multiple points. Taking this study back to the 1970s, the median P/E multiple de-rating is 7 multiple points, which is precisely the de-rating achieved during the current de-rating cycle.
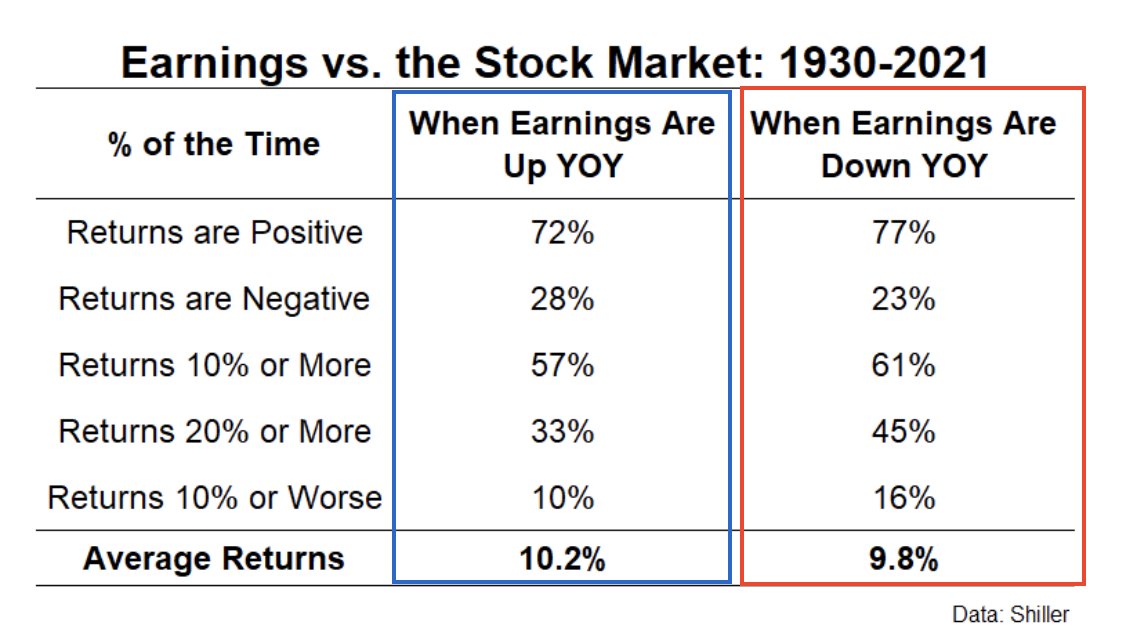
But what if a true recession comes to pass in 2023? Doesn’t that mean earnings will be down and therefore investors would have to wait even longer for the market to recapture its former glory?
We can’t predict the future, and if we could we wouldn’t have this article to publish, but rather sipping pina coladas after winning the lottery. Having said that, most years in which earnings are down, the market is actually trending higher and delivering a positive return. And while we can ascertain that the ERP outlines the de-rating cycle, the markets are also a forward discounting mechanisms and likely pricing earnings declines well in advance of the actual earnings decline materializing (Table of Earnings vs. the Stock Market c/o Ben Carlson). It’s funny how market pundits are quick to accept the idea that the market is pricing in a higher FFR in the future, but not pricing in lower EPS in the future. See how bias works?
It’s also been stated that the market will only bottom once the Fed starts cutting rates. This is more hyperbole than fact, but least we not profess and better present the facts. One point of emphasis before outlining the facts of the matter: Social media can prove a dangerous place for the average investor! Here’s an example:
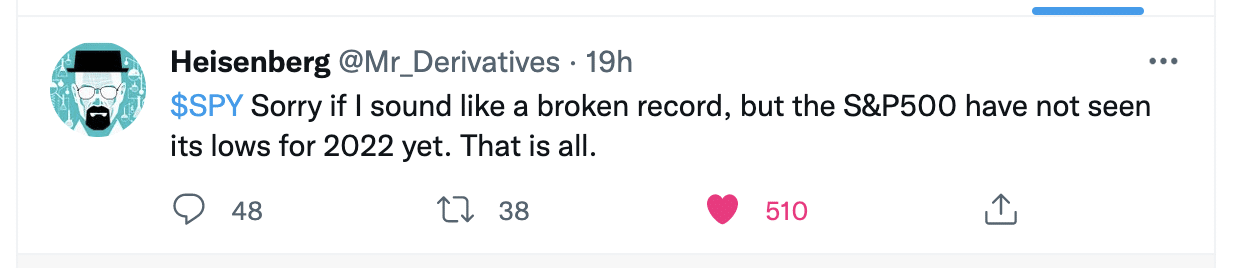
As opinionated as the tweet above may be, it is a widely expressed opinion in both the financial and social media. Everyone has one of these so-labeled opinions, but given the prevailing trend, this is where most opinions are rooted today. Pessimism, fear, and loathing litter the investing landscape and align with the bear market trending price action. But how actionable, or practical, is this kind of opinion? Think of it this way: Investors can manage risk to their heart’s content in the same way I can put training wheels on my 7-year old daughter’s bicycle. If she is too scared to get on the bicycle, however, how will she ever learn how to ride, even though there are training wheels to manage her risk of falling? This is where many investors are today, and why many investors will fail to achieve their investing goals, gripped with the impracticality of fear. But we digress… Back to “the market will only bottom once the Fed starts cutting rates” thesis.
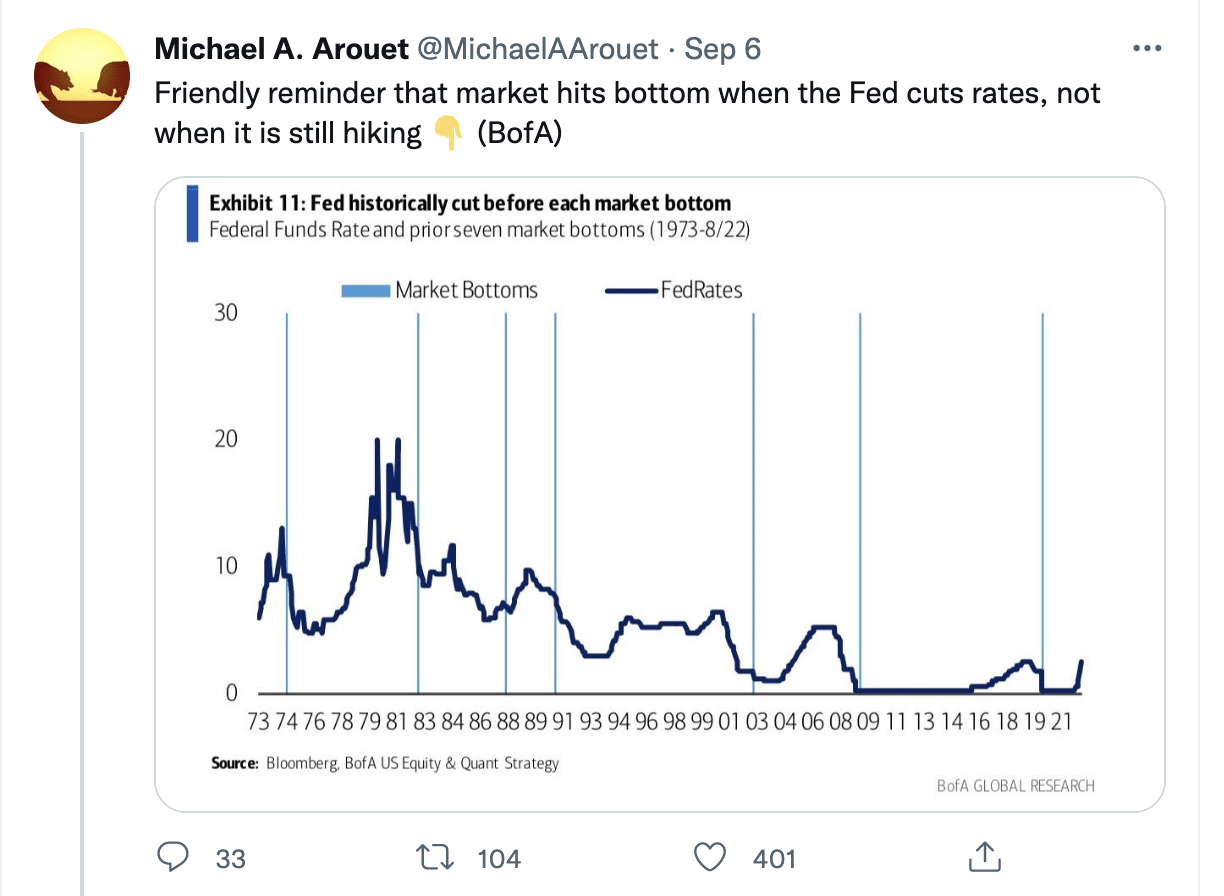
Over 400 people liked this tweet which states: “Friendly reminder that market hits bottom when the Fed cuts rates, not when it is still hiking.” Is this correct, does the market not find a bottom until the Fed cuts rates. The chart is from Bank of America, a reputable institution. Or maybe, maybe the tweet is simply misunderstanding the chart and conflating an idea or bias. The data from Bank of America simply plots the FFR against market bottoms (perpindicular line) since 1973; it doesn’t say anything about a market bottoming only after the Fed cuts rates. So let us now look at the facts:
Fed Fund Rate and Rate Cuts Since 1974
- 1974 Fed cut rates in NOV = S&P 500 bottom OCT
- 1982 Fed cut rates in JULY (15 – 13%) bottom AUG
- 1987 Fed cut rates in NOV (7 – 6.8%) bottom NOV
- 1990 Fed cut rates in OCT (8.25 – 7.75%) bottom OCT
- 2001 Fed cut rates in JAN (6.5 – 6%) bottom MAR ’03
- 2008 Fed cut rates in JAN ( to 0%) bottom MAR ’09
- 2020 Fed cut rates in MAR (to 0%) bottom MAR
Based on the factual data above, we can discern that from the first rate cut markets had bottomed before, after, the same time, and WAAAAAAAAYYYY later in the future. We can also conclude that the tweet offered was factually incorrect or even misleading. Another point of interest related to the subject matter is that all cycles are different, but indeed, if the Fed is lowering rates it is likely beneficial for investors, despite the rather limited sample size in the previously mentioned chart and data. Rate cuts and lower Treasury yields, in an otherwise stable economy with earnings growth, is likely to produce bullish conditions for market participants. But slowing earnings growth against the backdrop of rapidly rising rates/yields often produces bearish conditions for market participants.
All market and Fed regimes come to an end and start anew thereafter. Today, the markets are hyper-focused and hyper-sensitive to the current path of a tightening Fed monetary policy regime which is finding stocks and bonds relatively unattractive to investors. Wells Fargo’s chief global market strategist Scott Wren recognizes the attention of investors resides with this premise of hyper-sensitivity amongst investors and as it pertains to the path of Fed policy and its fight against inflationary forces:
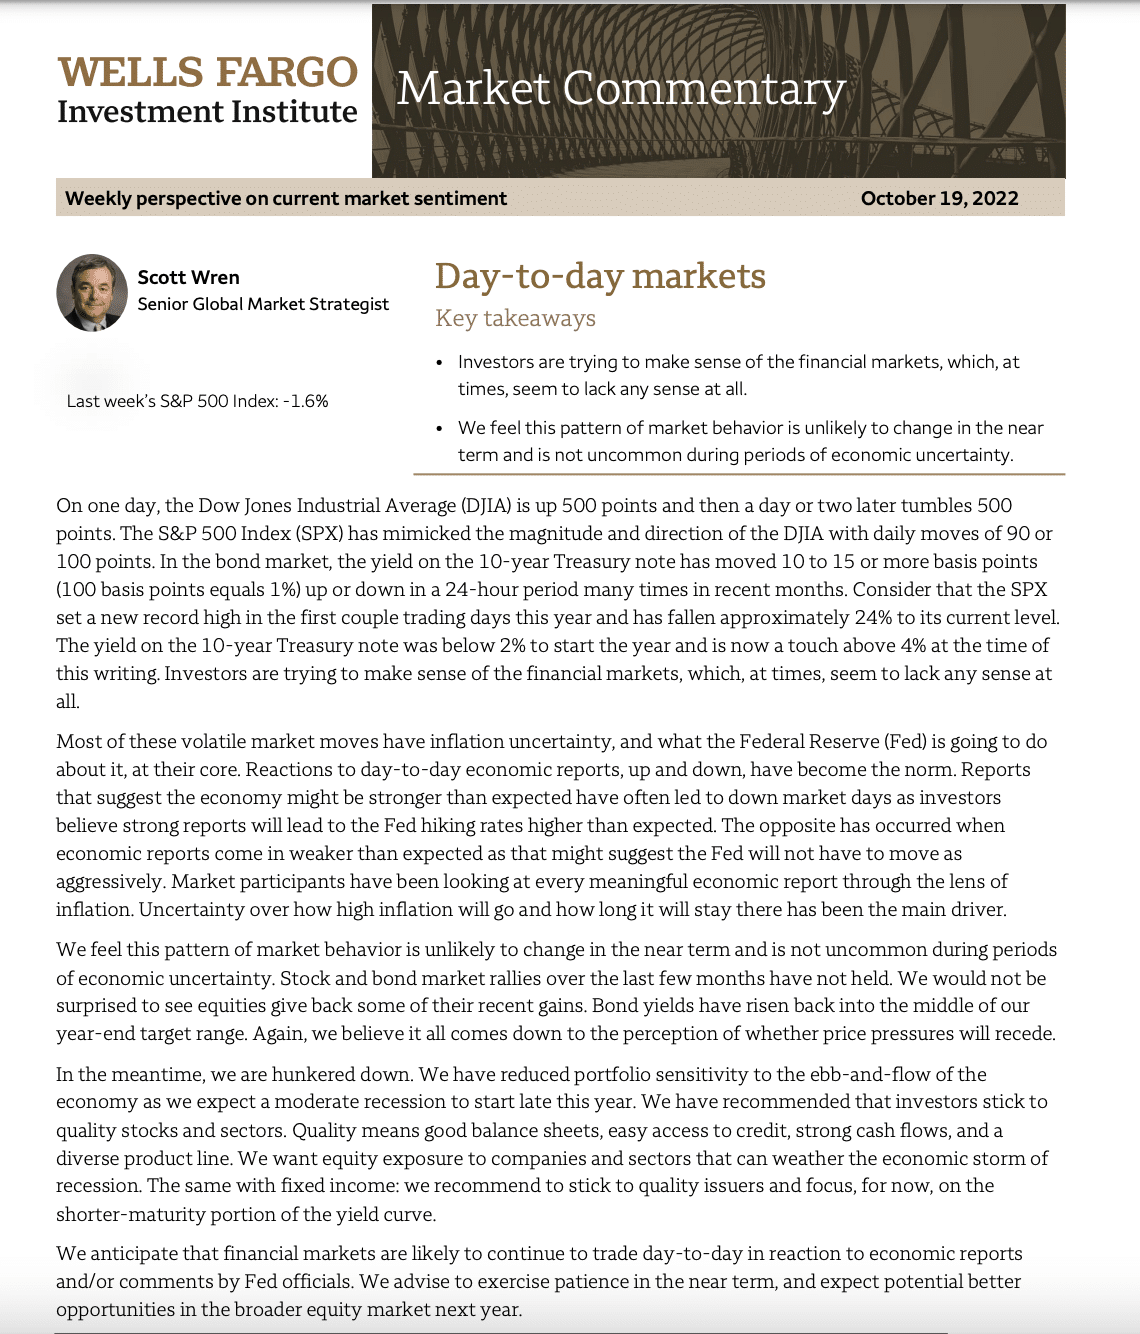
The plethora of headwinds facing investors today, in large part due to the current Fed regime, are likely the precursor for tailwinds and bullish conditions in the future. The Fed is setting a very, very high bar for hawkish/tight monetary policy as we progress into 2023, which it is unlikely to live up to hence forth and hence the headwinds becoming tailwinds for investors. Your job as an investor is to manage cash wisely in between now and then, in order to benefit from the regeneration of the next bull market. And remind yourself, the savvy investor takes advantage of bargains today, even if it means waiting for the payout in the future while accepting potential drawdowns.