

Research Report Excerpt #1
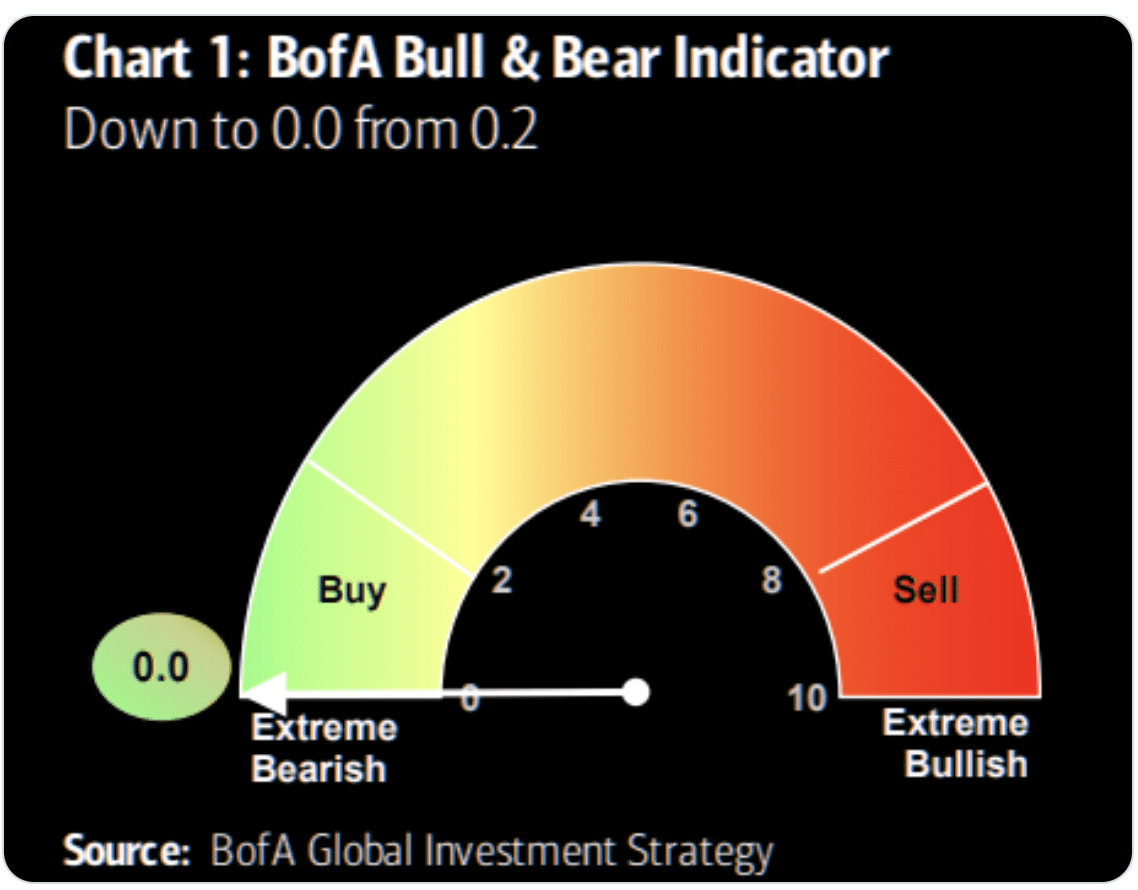
The Bank of America Bull & Bear Indicator is currently at 0. This is probably the slowest of all indicators among investment banks. The track record when this hits zero is rather strong (unless double dip recession or systemic event). The previous times the Indicator hit zero were in August ’02, July ’08, September ’11, September ’15, January ’16, and March ’20, according to Bank of America. Essentially, when investor sentiment is deeply bearish, as it is today with a reading of 0, it is often characterized as a contrarian Buy signal. The only time the S&P 500 was not higher a year later was after the 2008 signal. With this understanding, the question for investors may be whether or not they believe the market is pricing another Great Financial Crisis.
Research Report Excerpt #2
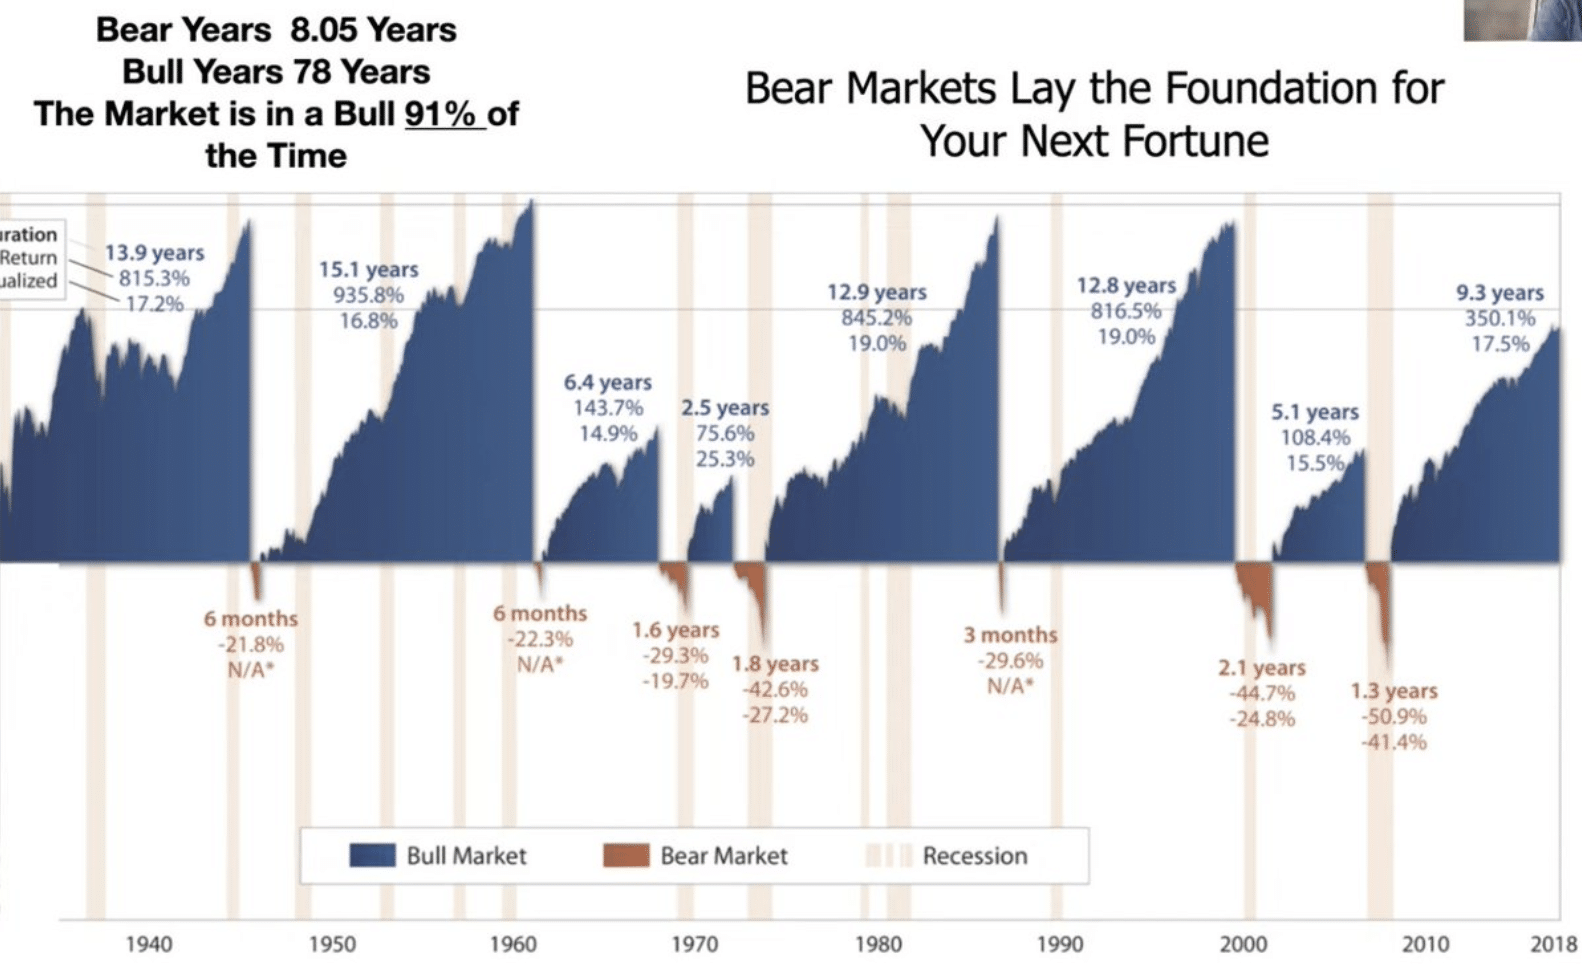
Every single bear market feels like the end of the world is a certainty. And every single bear market seems never-ending. The good news, however, is that all bear markets end. The end of a bear market will not be achieved with you opening up an e-mail that informs you of its end, but rather with a new uptrend in stock prices. The savvy investor knows that bottoms of bear markets are never alike, but often have similar qualities. The savvy investor also knows that finding the precise bottom is a futile exercise, and one that begs of better disciplines. The savvy investor cares more about the discounted future of earnings/valuations because he/she knows that all bear markets have been brief, and all bull markets have long periods of compounding gains.
Research Report Excerpt #3

The chart of Decennial year, average price trend above is pretty consistent with 2022. Finom Group has been consistent or steadfast with the opinion that midterm election years and Decennial years have proven rough sledding for markets, with price lows generally not found until the back half of the year.
Research Report Excerpt #4
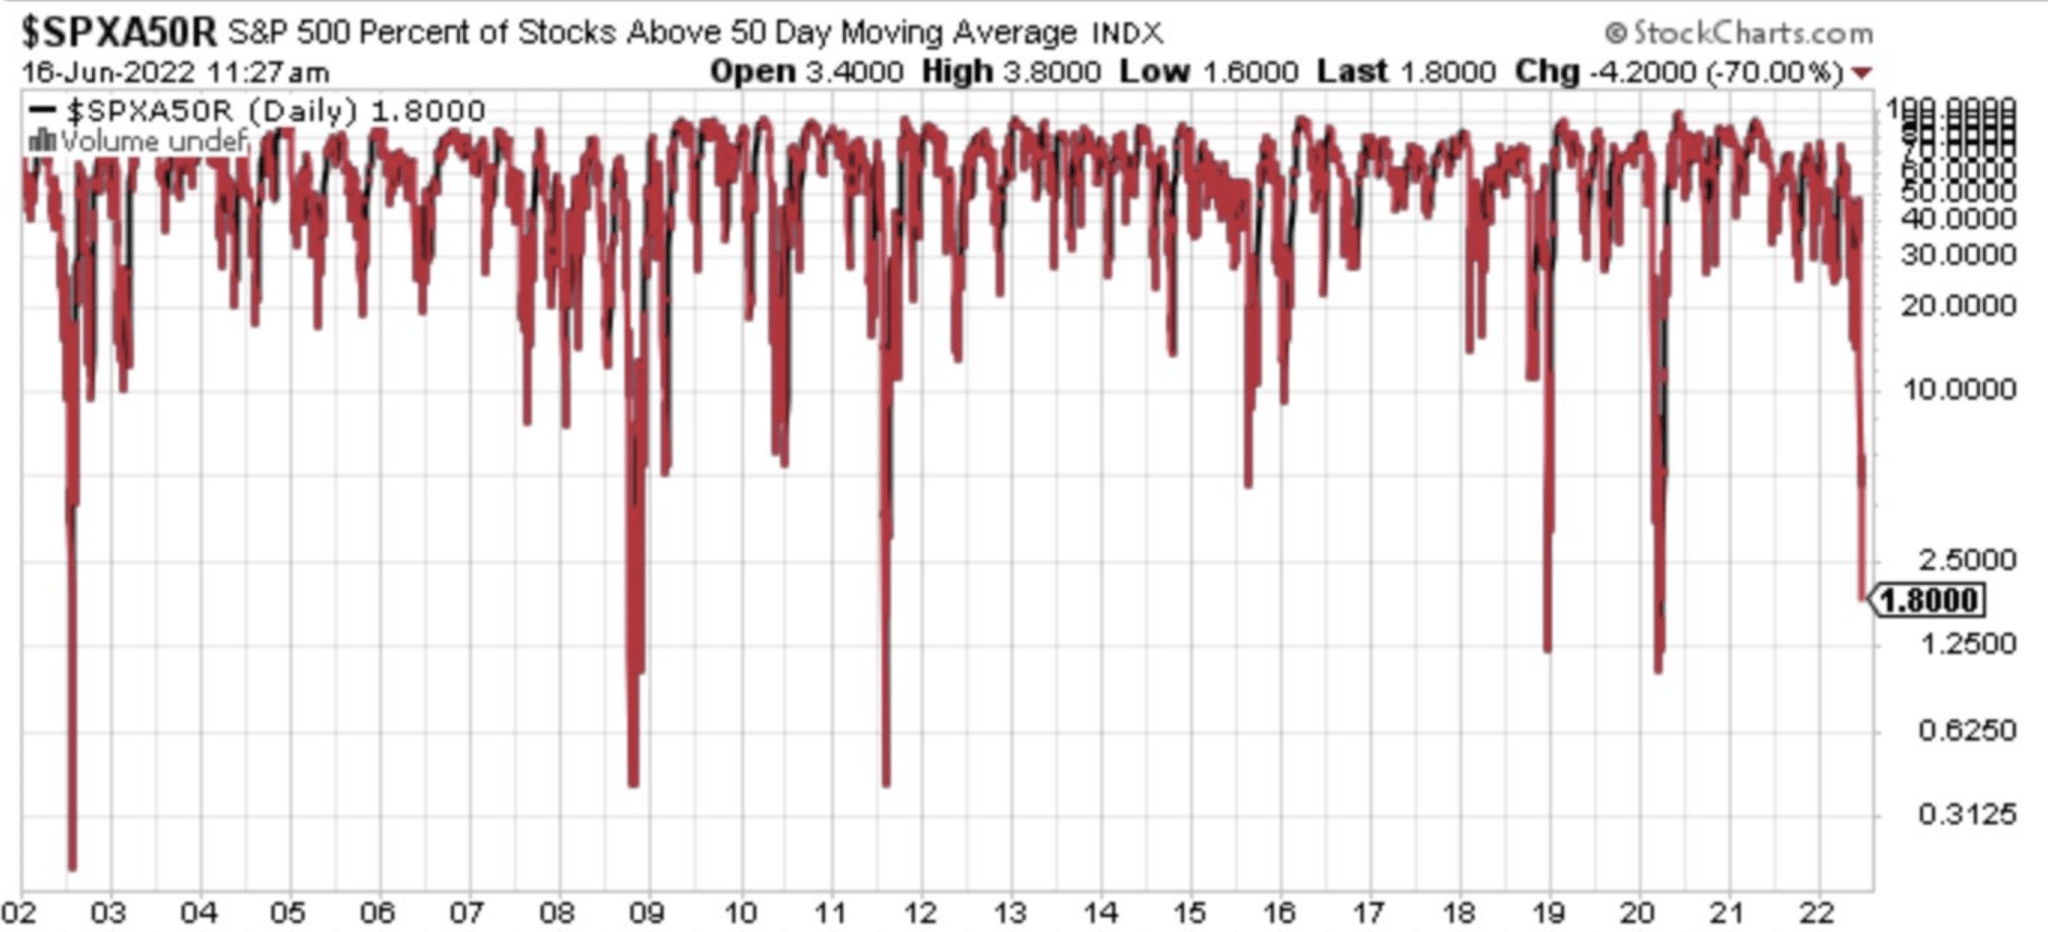
On Thursday, the percentage of S&P 500 stocks trading above their 50-DMA touched 1.1% before finishing the day with 1.8% of stocks trading above their 50-DMA. This marked the lows in both 2018 and 2020 recently. While it could get worse as shown in 2002, 2008, and 2011, not the percentage levels are not very far off, likely achievable within the span of a week if not more quickly. In other words, breadth is washed out, and the savvy investor doesn’t focus intently on further drawdown potential, but the upside potential over the coming months. (table from Charlie Bilello)

If we relax the parameters regarding the percentage of stocks in the S&P 500 trading above their 50-DMA to just 2%, which is where the breadth indicator closed Friday, we can see the forward returns are indicating a longer-term value and buying opportunity is afoot. Since 2001, when the breadth indicator achieves this level, the S&P 500 has been higher 12-months later… 100% of the time. It doesn’t mean there isn’t potential drawdowns first, but upside is the most probable outcome 9 and 12 months later. **If we exclude the Great Financial Crisis of 2008, there were no declines in any period after this WASHED OUT level in breadth had been achieved.**
Research Report Excerpt #5
“The rate of speed at which macro-market conditions has slowed in recent weeks has proven increasingly concerning to investors. I believe this concern has proven warranted, based on the magnitude of the economic slowing taking shape. Up until the last few weeks, the economic data had proven resilient and better than forecast in many regards. That favorable trend has abated, and given rise to a greater economic slowing, which may have already been priced by markets. With inflation levels having trended unfavorably in 2022, it may have finally found a crest or peak in economic activity impacts, also fueled by a more restrictive monetary policy and higher interest rates. As Edward noted, markets are forward discounting mechanisms, and the Quantitative Tightening (QT) period feared is hard to dismiss by the year-to-date price action. For those assuming the permanency of the QT period, we would invite you to recall the many adjustments already fashioned through the 1st 6 months of 2022. As such, the economy and markets are driving policy, as is historically the case. The more hawkish pivot by the Fed to hike rates 75bps at the latest FOMC meeting was predicated on a new peak in the CPI and a market that was pushing the Fed to get in front of the inflation situation, as opposed to trying to catch up to the inflation situation. This action by the Fed, while a pivot in the direction the Fed was already leaning with monetary policy, was a pivot nonetheless. We have such pivots during past easy monetary policy cycles, where the Fed pivoted between more dovish, hawkish, and dovish stances. Nonetheless, markets are still in search of a catalyst to reverse the downtrend, which is always the case of any trend. The reversal of the uptrend was predicated on QT and inflation. Here are what I would look for in the way of bullish reversal catalysts:
- Fed pivot/s
- Peak CPI with lower trending CPI of at least 2 consecutive lower monthly prints
- Downwardly revised S&P 500 FY2022 EPS
- Earnings releases met with positive price action.
Research Report Excerpt #6
There is not a whole lot in the way of technical support for crude price until below $100/barrel. That’s what happens when price goes parabolic, creating extreme gaps. Tom Fitzpatrick suggests a material correction for crude could be in the works near-term, and would shift the equity market narrative from bearish to bullish. (From Citi)
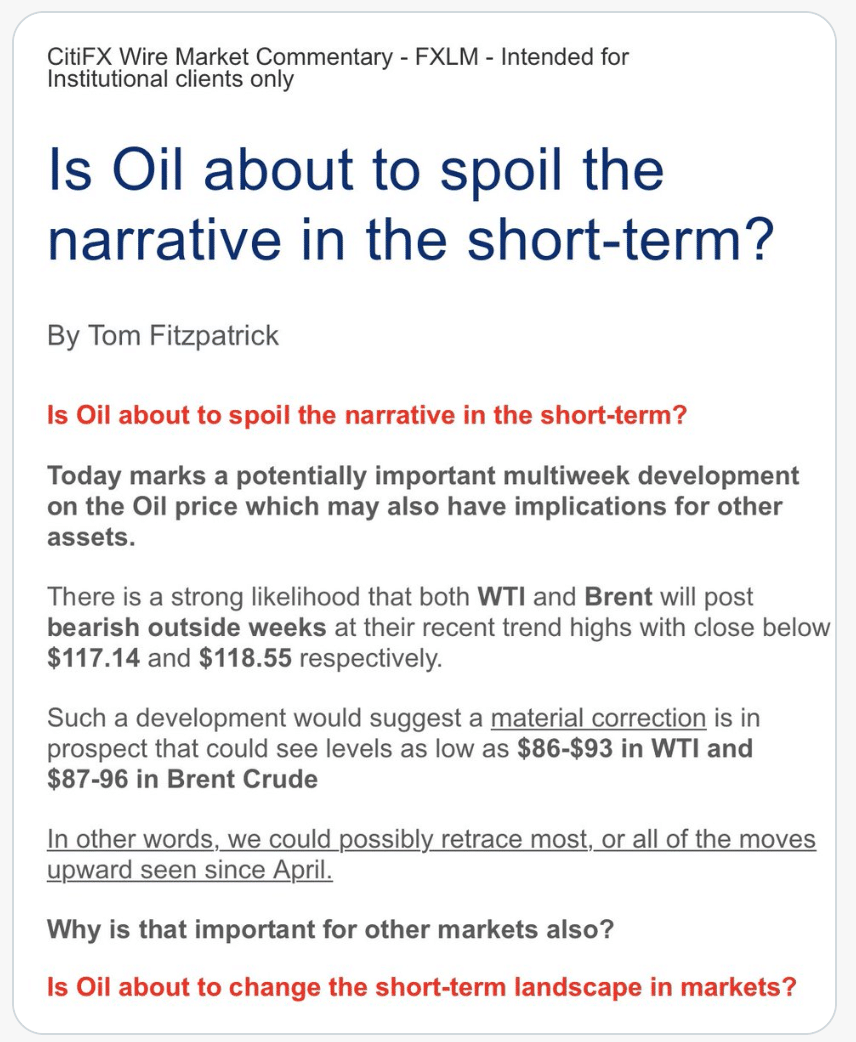
This would definitively prove one of the missing puzzle pieces that has outsized potential for changing the inflation narrative as well.
Research Report Excerpt #7
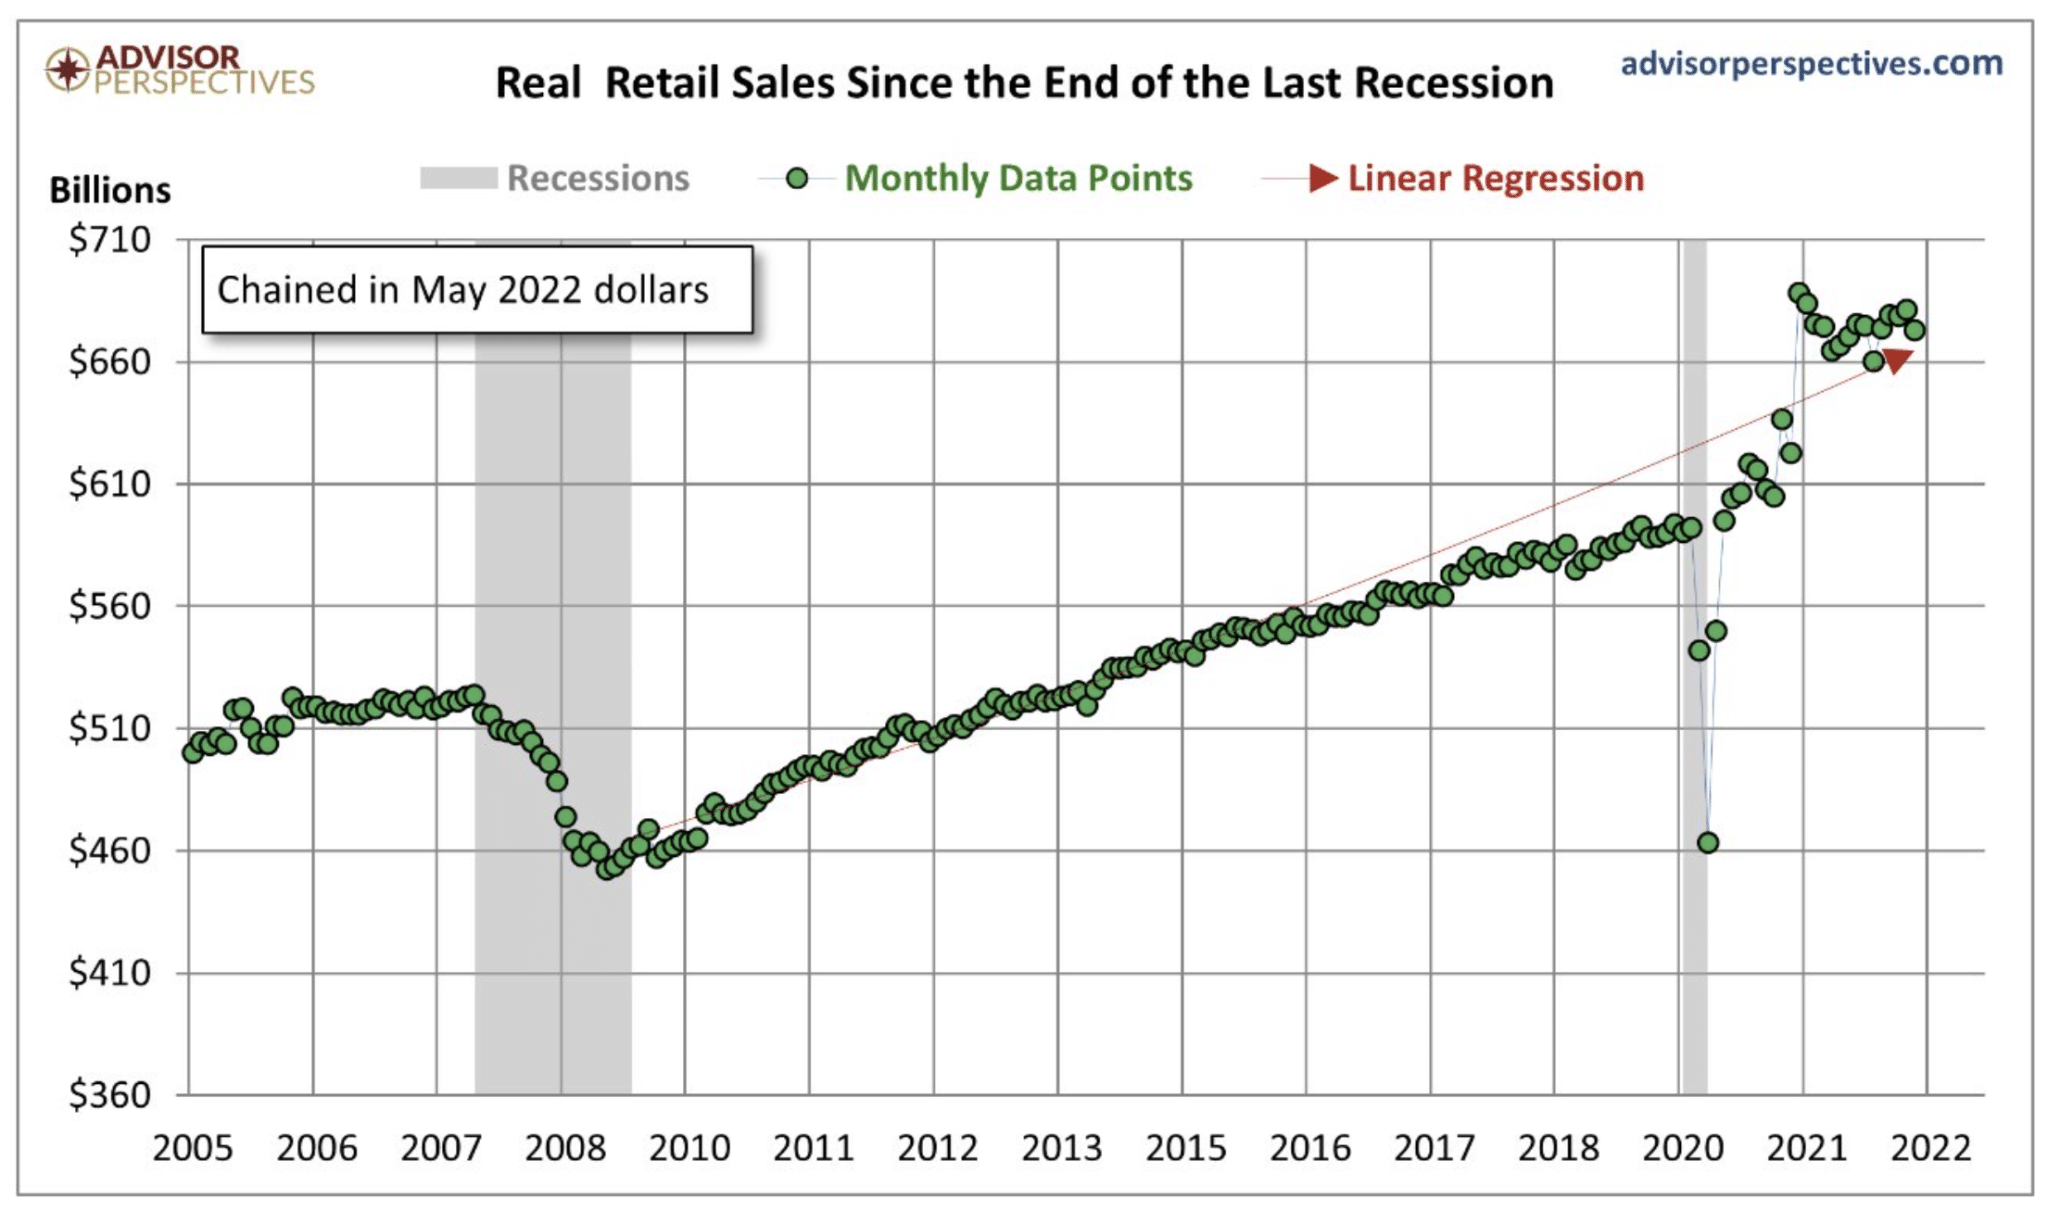
This slowing of the consumer spending and retail sales is TOO BE EXPECTED!!! The Laws of Large Numbers scream of ROC, not recession. Nonetheless, I will concede and investors should continue to monitor, the economy is slowing more rapidly than many had anticipated just a month ago.
Research Report Excerpt #8
As shown in the chart and commentary above from Sean Avory of Avory & Co, we’ve also seen Apartment List National Rent Index rollover, Rent CPI usually follows shortly thereafter. More completed inventory of multi-family homes would aid in this process over the coming months. And almost all major metropolis have seen rental prices rollover in the past month, as shown in the charts below:
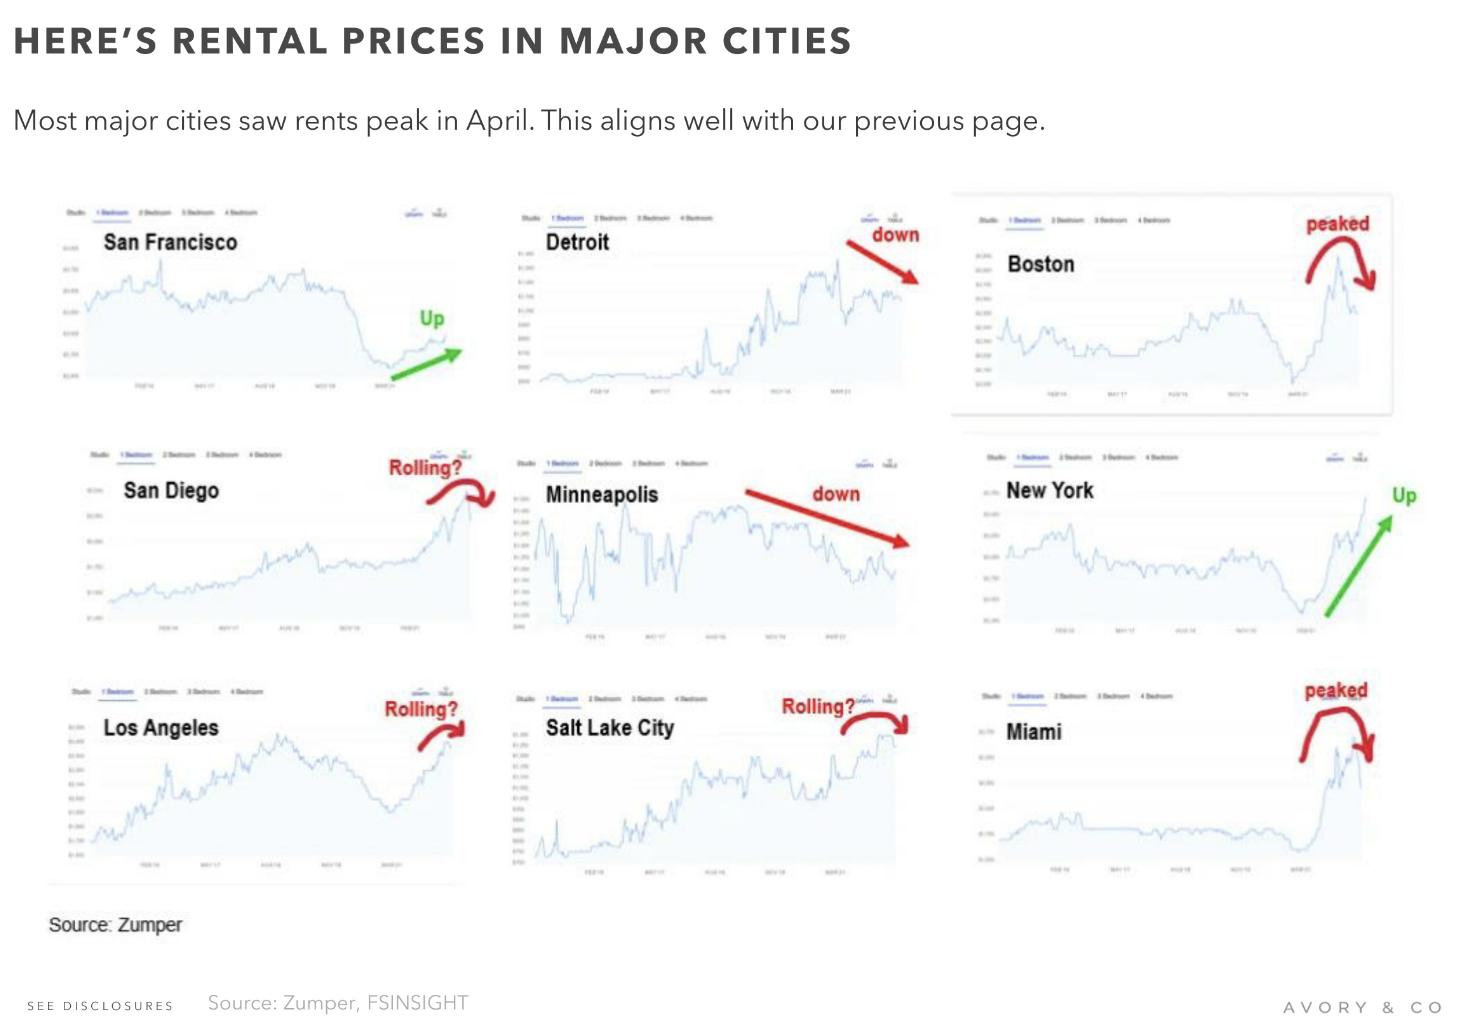
So while indeed, the housing sector is coming under pressure from higher mortgage rates, higher median home prices and low inventory levels, there are still reasons to recognize that this lull in housing may prove a consolidation phase that leads to a more normalized and healthier outlook for housing by year’s-end. Additionally, the present weakness in housing could lead to lower rental prices, pushing inflation lower and helping the Fed to improve its position in the battle against inflation.
Research Report Excerpt #9

The top panel identifies the S&P 500 making a lower-low this past week. The middle panel is a relative performance ratio of the Consumer Discretionary ETF (XLY) vs. Consumer Staples ETF (XLP). I added this relative performance ratio to see if there was a developing risk-on or offensive profile. Unlike the S&P 500 making lower-lows, the XLY:XLP performance ratio is not making lower-lows, suggesting that investors may very well be posturing more offensively and tilting in favor of risk-on appetite. Last, but certainly not least, indeed, The NDX:SPX performance ratio is also not making lower-lows, but actually turning higher. It may be that the performance ratio made an ultimate low in May, as shown in the bottom panel. Naturally, we’ll have to pay close attention to all of these performance ratios going forward, as they could be tell-tale signs that the bottom of the bear market is closer than many think. Additionally, we should keep in mind that if the growth scare turns into something resembling a recession, all technical formations are likely to fail. For now, this looks encouraging and more bullish than not.


