

Research Report Excerpt #1
The key to a healthy cyclical bull market is consistent market rotations. If everything goes up together, breadth thrusts are inevitable, but so is the likelihood of everything going down together, which is not the signs of a healthy bull market. So while there are plenty of complaints about market breadth having weakened into the back half of the Q2 period, this is normal and to-be-expected based on market rotations. It’s healthier than the ominous market breadth headlines presume. Additionally, while the indices are not achieving an expansion of New Highs, they aren’t expressing an expansion of New Lows either.
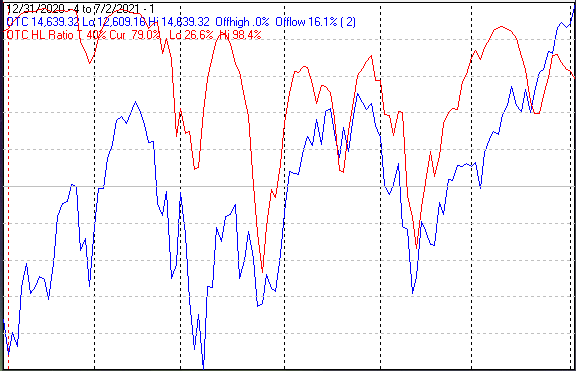
The number of New Lows remained non-threatening this past week. The next chart covers the past 6 months, showing the Nasdaq (OTC) in blue, and a 40% trend (four-day EMA) of NASDAQ New Highs divided by New Highs + New Lows (OTC HL Ratio) in red. Dashed horizontal lines have been drawn at 10% levels for the indicator; the line is solid at the 50%, neutral level. The OTC HL Ratio finished the week at a strong 79 percent.
Research Report Excerpt #2
The end of Q2 and first trading week of July proved a perfect trading week. This has only happened 20 times previously. The last time this occurred was the first trading week of February where the S&P 500 was up all 5 trading days, in a row. Recall our quantitative data from February 2021 as reiterated below:
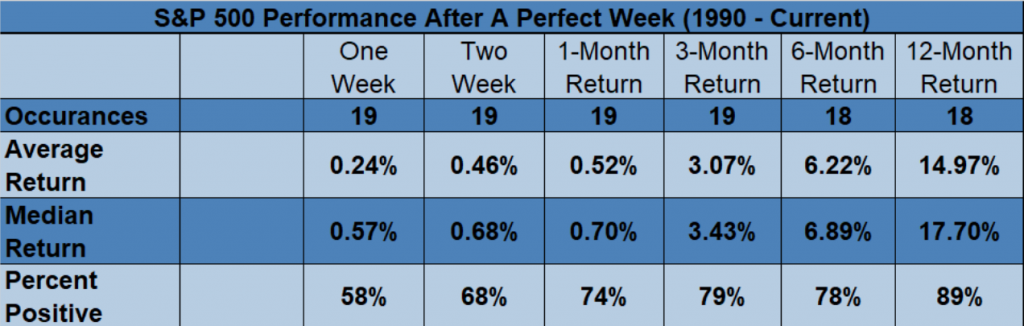
- The first week of February, the S&P 500 was green all 5 days and finished at an all-time high.
- This was the 20th perfect week like that since 1990.
The study above shows that after a perfect week, momentum continues to produce more gains and indeed that is what happened since the first, perfect week of February. The market was up another 12.5 percent 3 months later, which is well above the average rate of return identified in the table above.
Research Report Excerpt #3
Our stake since, in CAT, has been reduced at $246 and $226 per share. We maintain a 1/4 weight position in the portfolio. Our AMZN call option for July is looking very strong presently and the stock may break out of it’s consolidation/base near-term.
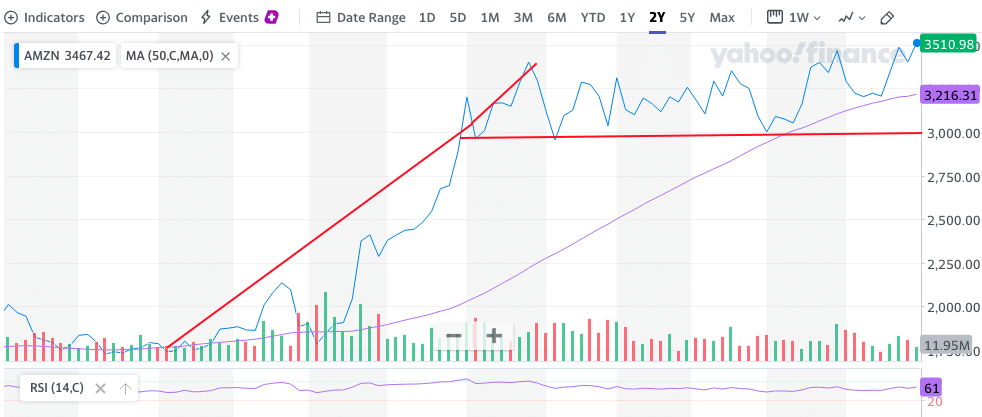
The AMZN 2-yr chart above mirrors that of the previous PEP chart. These are examples of stocks digesting previously strong moves/gains. It reinforces that we should, at the very least, anticipate some gains at the index level near-term. How near-term is of no consequence if you have a game plan and appropriate outlook.
Research Report Excerpt #4
Since 1945, the S&P 500’s median gain during the 4-trading day stretch has been a gain of 0.88% with positive returns 71% of the time. Last year was an especially strong July 4th week for the market as the S&P 500 surged 4.02%, ranking as the second-best July 4th week since 1945 (2010 was the best at 5.42%).
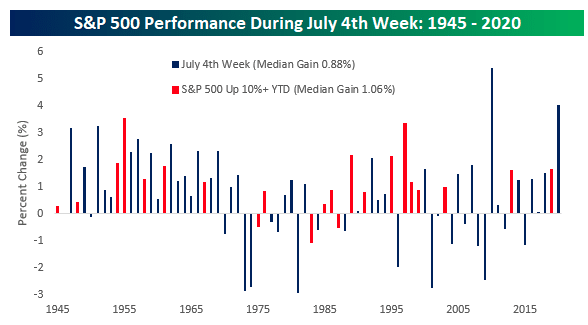
Also highlighted are the years where the S&P 500 was up over 10% heading into the July 4th week in red. When equities were already up double-digits heading into July 4th, performance was even better with a median gain of 1.06% and positive returns 86% of the time (19 out of 22 times).
Research Report Excerpt #5
Earnings drive markets higher over time. Earnings are expected to grow some 32%-38% in 2021, according to consensus analysts’ estimates.
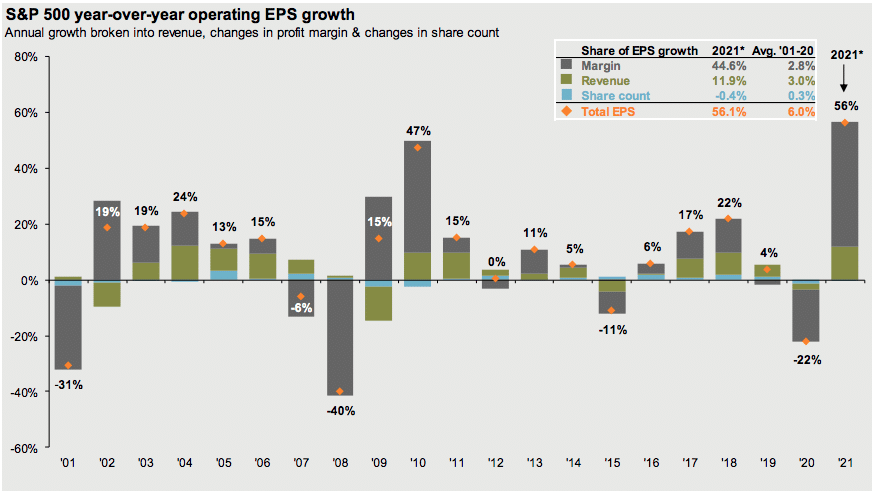
The chart from J.P. Morgan above however, suggests that they see earnings climbing 56% in 2021. The firm maintains an S&P 500 price target of 4,500 for 2021.
Research Report Excerpt #6
This past week, PEP shares achieved a new all-time high at $149.78. While that sounds like a good thing, on a year-to-date basis it is up only .41 percent. Fortunately, as an active portfolio manager, I’ve not just sat on our holdings, but traded the various dips and rips in the share price action. PEP has contributed to 18% of Golden Capital Portfolio’s gains in 2021 (as a portion of whole gains). Let’s take a look at the chart below, which is a 5-yr chart of PEP:
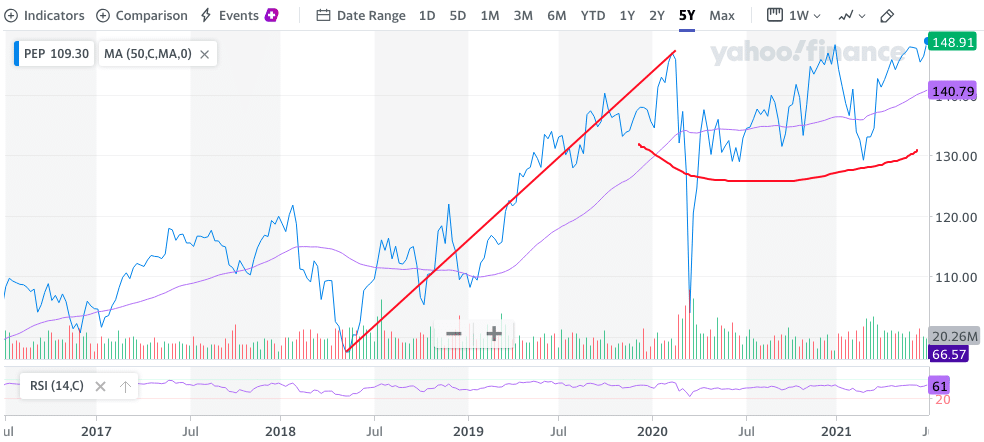
Why a 5-yr chart? Well, the 5-yr chart shows the sharp move higher from 2018 up to February 2020. The share price increased ~60% over this time period. Since then, it has made only modest new highs and largely consolidated from February 2020 to the present day. This is typical consolidation after such hefty share price appreciation, hence the 5-yr chart so as to see the big picture potential in shares of PEP and assuming the company continues to maintain its fundamental performance strength going forward.
Research Report Excerpt #7

Finom Group is of the opinion that the labor participation rate will remain restrained, although improve slightly through the end of the year. The upcoming rollout of the Child Care Tax Credits still pose a headwind to not only the labor participation rate, but also the unemployment rate. The expiration of the additional unemployment insurance benefits in September will alleviate some of the labor market issues, but not all. This gives the Fed cover to potentially continue to shift its tapering message to the public. At the last FOMC press conference, chairman Jerome Powell acknowledged that members were talking about talking about tapering, but no plans were in the works. We think this rhetoric or message can prevail at the upcoming July FOMC meeting (July 27) as well, given the latest jobs report.
Research Report Excerpt #8
The chart below of the Equal-weight vs. Cap-weight S&P 500 ratio, which now shows a break of recent support levels. It still may turn around shortly, but if it doesn’t, investors may have yet another signal pointing toward a move from an early cycle to mid-cycle market.
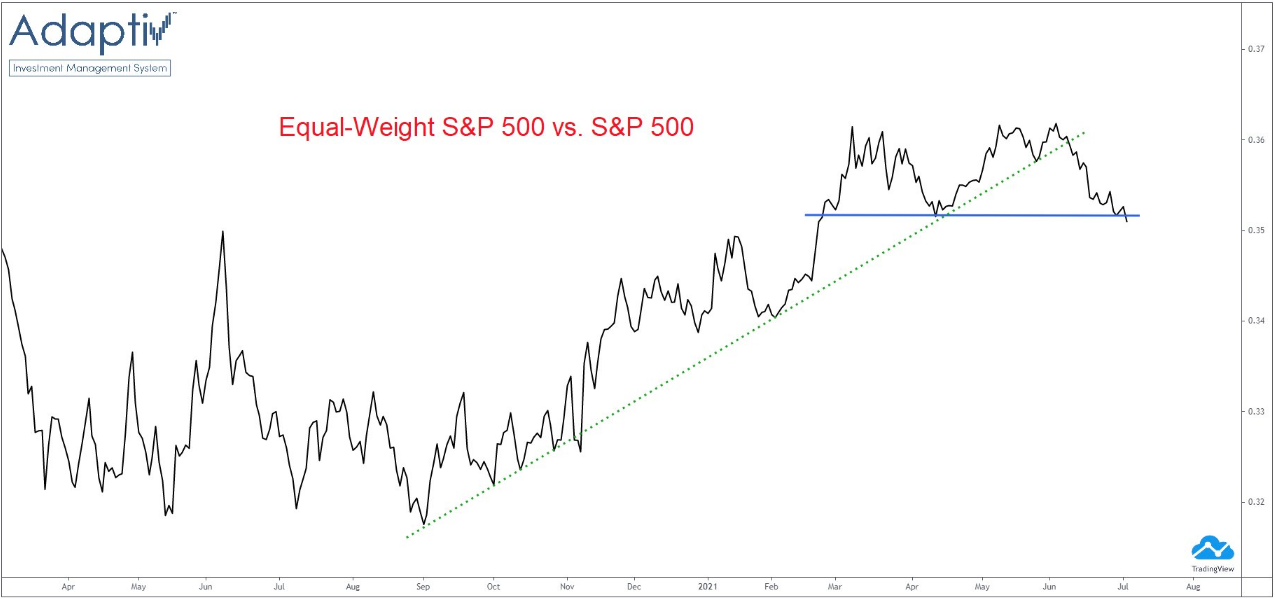
So you are probably asking yourself , “How much do all of the breadth readings matter, if the market continues to push higher?” In my opinion and to reiterate, this was to-be-expected.
Research Report Excerpt #9
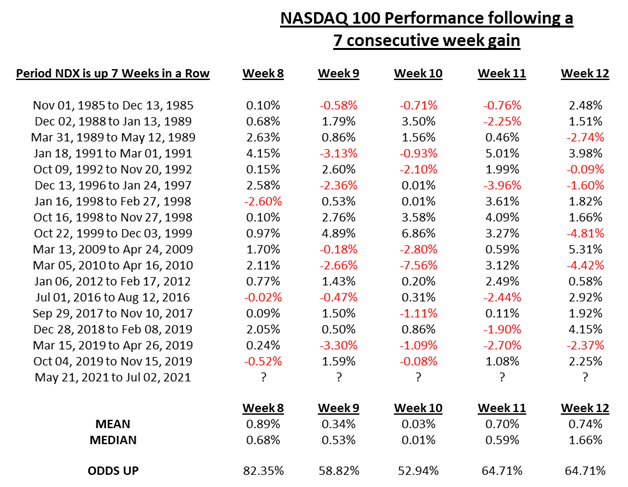
The Nasdaq 100 just closed higher for the 7th consecutive week. Cornerstone Macro’s Carter Worth points out that the Nasdaq has only done this 17 other times since the inception of the index over 35 years ago. Of those 17 prior instances, the following week closed higher 82% of the time for an average gain of 0.89 percent. It certainly doesn’t hurt that July has historically been a strong month for the Nasdaq and the Information Technology sector (XLK).


