
Welcome to another trading week. In appreciation for all of our Basic Membership level participants and daily readers of finomgroup.com content, we offer the following excerpts from within our weekly Research Report. Our weekly Research Report is extremely detailed and has proven to help guide investors and traders during all types of market conditions with thoughtful insights and analysis, graphs, studies, and historical data. We encourage our readers to upgrade to our Contributor Membership level ($14.99/monthly, cancel anytime) to receive our weekly Research Report and State of the Market videos. Have a great trading week and take a look at some of the materials from within this week’s Research Report…
Research Report Excerpt #1
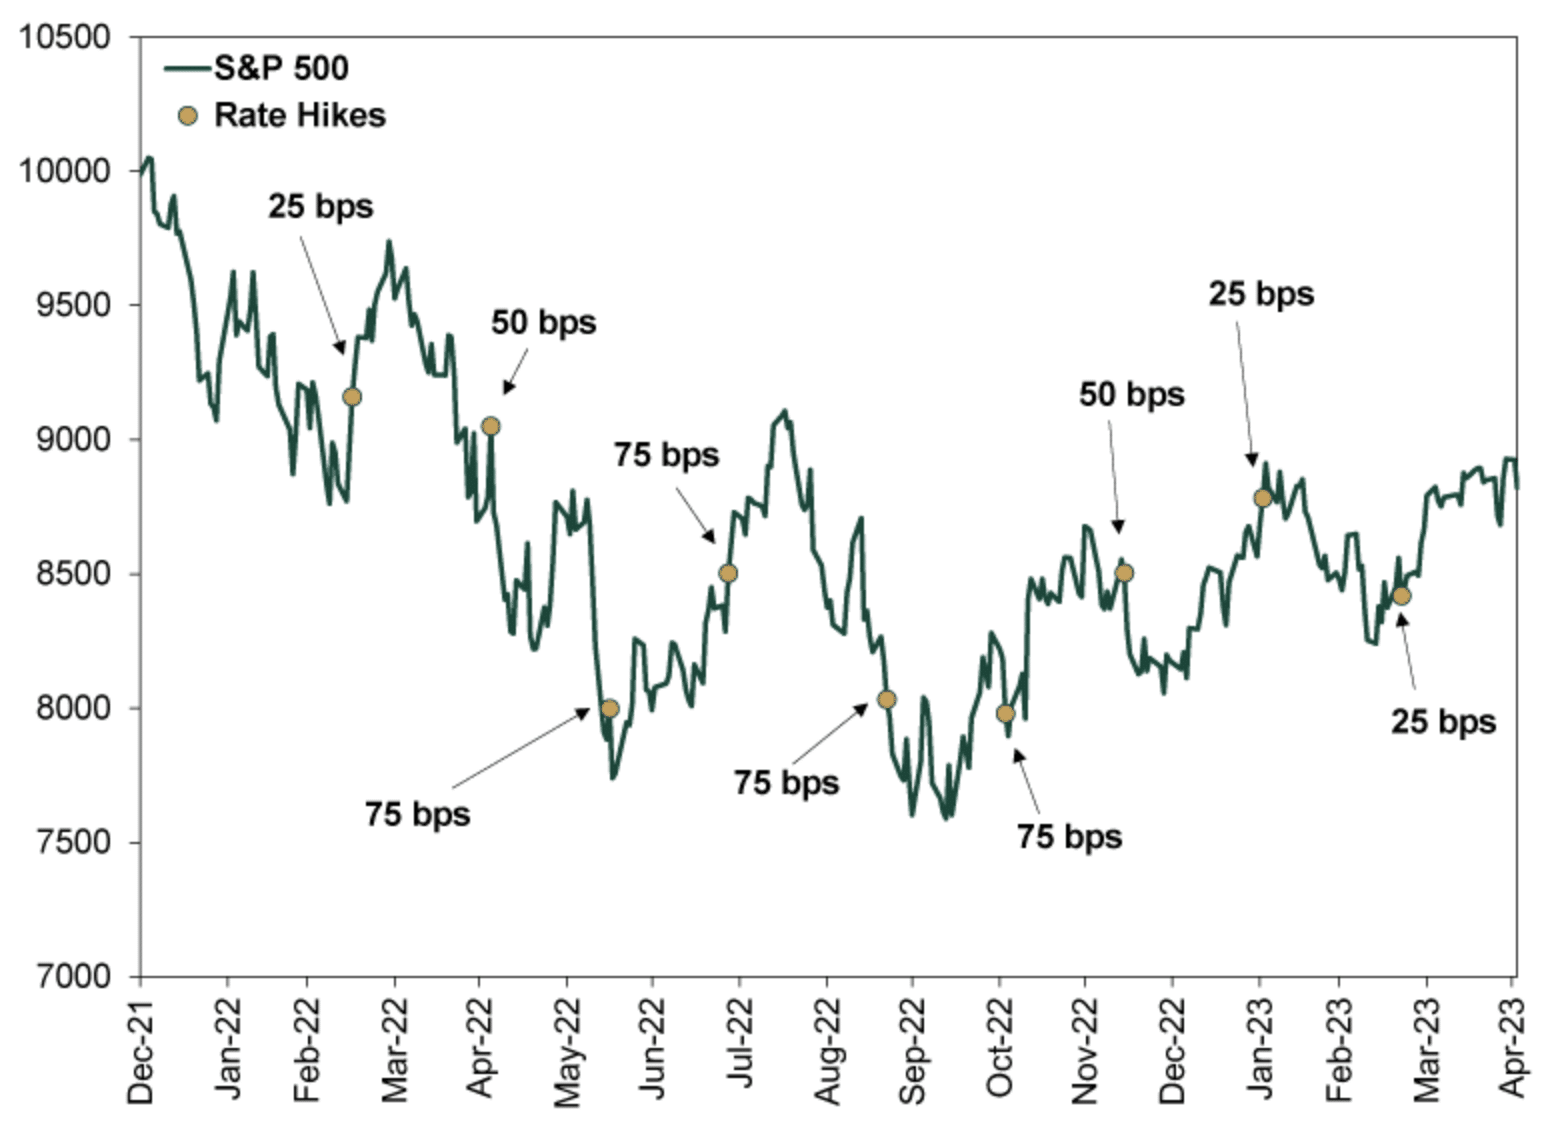
As we can tell from the chart above, the stock market has exhibited a great amount of price volatility since March 2022’s initial rate hike, but has ultimately traded sideways through the totality of the tightening regime. For those who suggested/suggest that buying the bear market would be the equivalent of fighting the Fed, the chart evidences something very different.
Research Report Excerpt #2
Essentially, disinflationary prices are what has driven the manufacturing data, not actual transactions taking place within the manufacturing sector, as shown in the following charts:
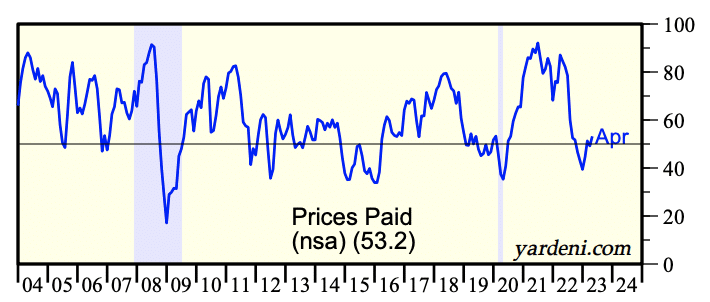
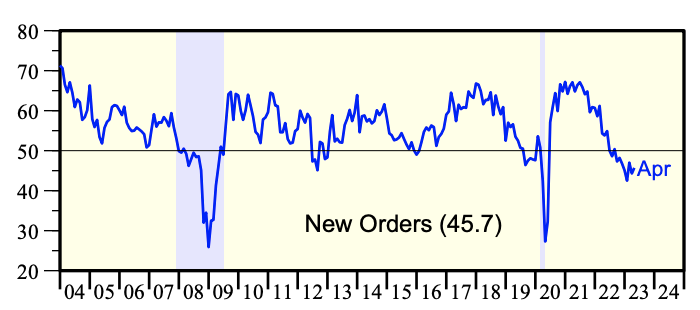
Notice how the Prices Paid plunge led the New Orders’ decline. The recent price inflection higher is leading stability and an apparent inflection higher in New Orders. The demand has to be there for goods, else the economy would have long since entered a recession, even when accounting for the service sector demand.
Research Report Excerpt #3
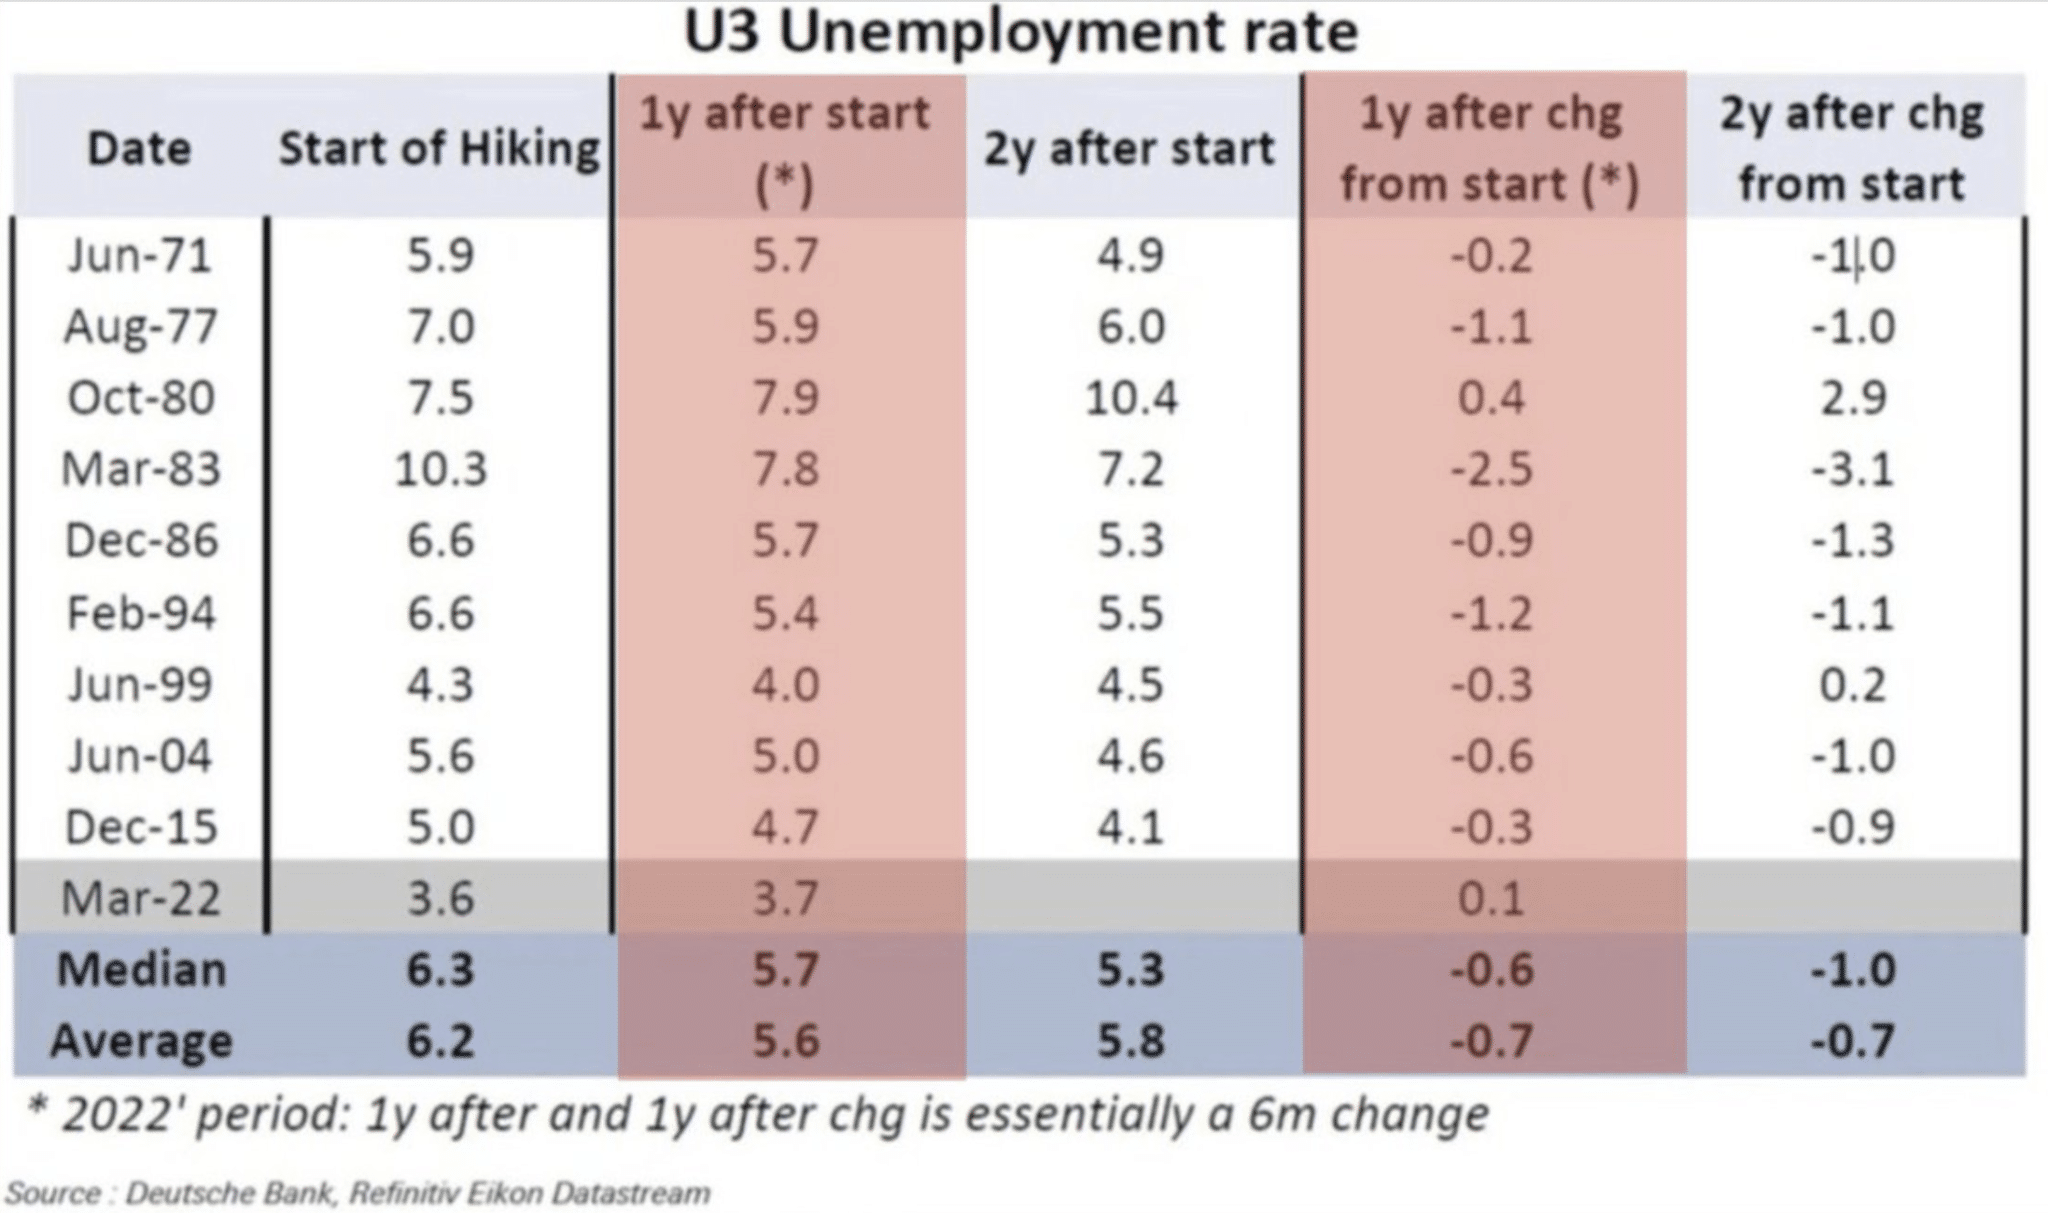
By looking at the Unemployment Rate during tightening cycles we can see that 1-year after rate hikes began, only ONCE was the Unemployment Rate higher (1980). Since the start of the current tightening cycle, the Unemployment Rate has declined .2 percentage points. Bottom line: the Fed desires a tighter labor market, but its policy tools do little to impact the labor market. Myth, de-bunked!
Research Report Excerpt #4
Overall, the Q1 earnings season is coming in far better than strategists, analysts, and many investors had envisioned.
- Earnings Scorecard: For Q1 2023 (with 85% of S&P 500 companies reporting actual results), 79% of S&P 500 companies has reported a positive EPS surprise and 75% of S&P 500 companies have reported a positive revenue surprise.
- Earnings Decline: For Q1 2023, the blended earnings decline for the S&P 500 is -2.2%. If -2.2% is the actual decline for the quarter, it will mark the second straight quarter that the index has reported a decline in earnings.
- Earnings Revisions: On March 31, the estimated earnings decline for Q1 2023 was -6.7%. Ten sectors are reporting higher earnings today (compared to Mar. 31) due to positive EPS surprises.
- Earnings Guidance: For Q2 2023, 44 S&P 500 companies have issued negative EPS guidance and 35 S&P 500 companies have issued positive EPS guidance.
- Valuation: The forward 12-month P/E ratio for the S&P 500 is 17.7. This P/E ratio is below the 5-year average (18.6) but above the 10-year average (17.3).
Research Report Excerpt #5
Our first chart of the week identifies a concept we had previously outlined in a video that discussed the Nasdaq Composite (COMPQ) Advance/Decline Line. For this exercise, however, let’s look at the S&P 500’s Advance/Decline Line, given that is the benchmark for most investors and strategists, Let us also look at the broadest NYSE Common Stock Only Advance/Decline Line.
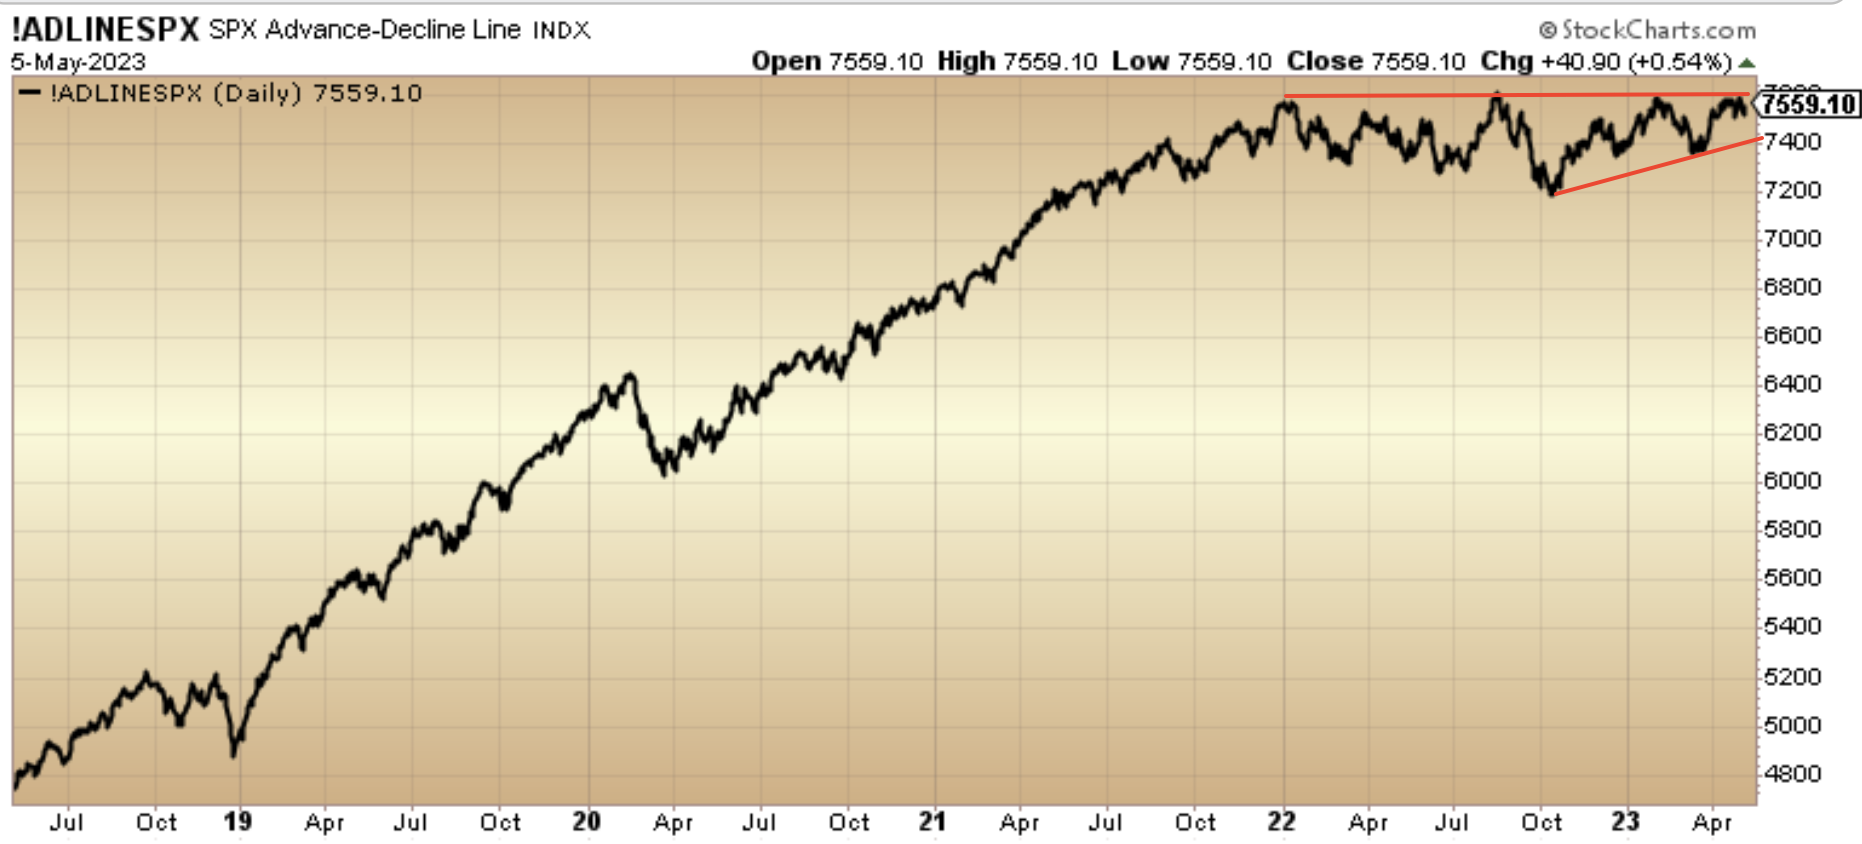
Despite the characterizing of the market as being held up by a handful of stocks, the S&P 500’s Advance/Decline Line remains near it’s all-time high level achieved in August of 2022 and has not made a lower-low in 2023. Until this changes, breadth is better than most perceive and despite the sideways trending markets.
Research Report Excerpt #6
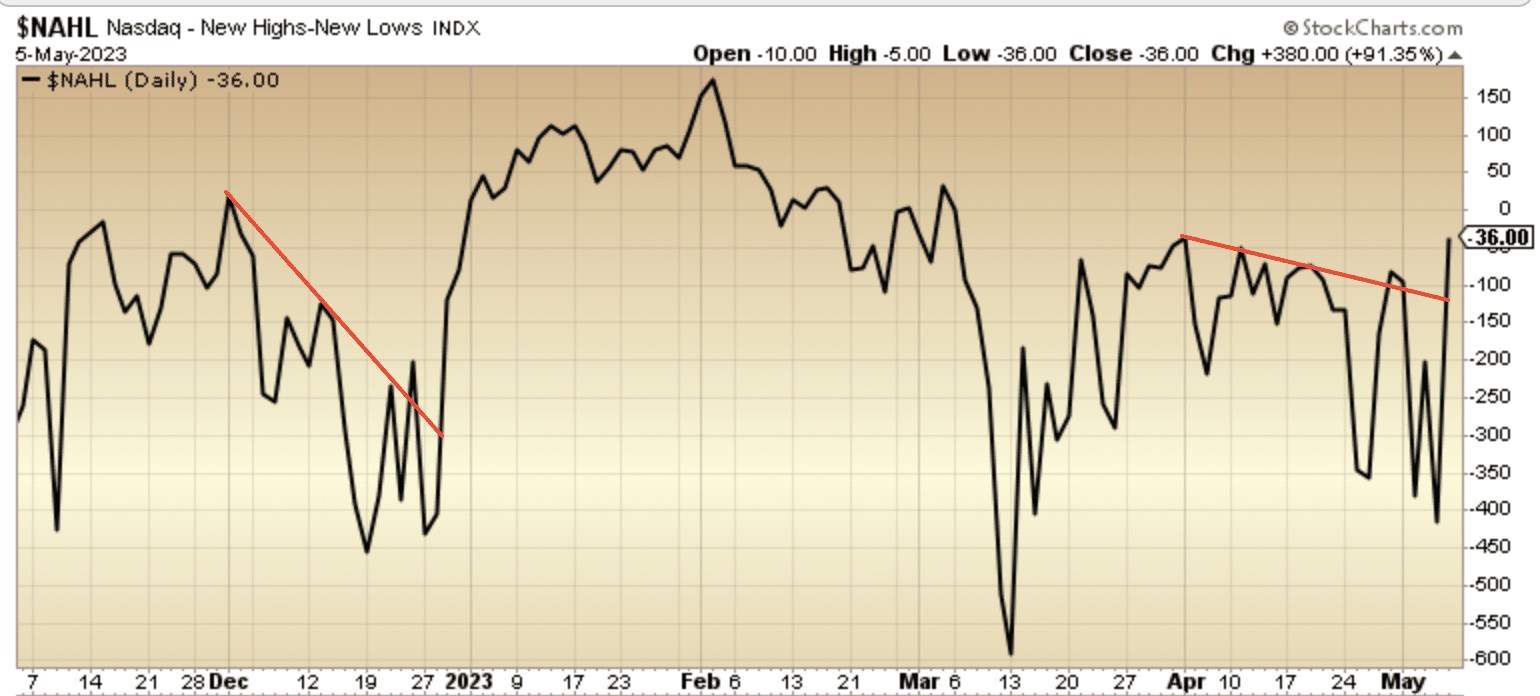
Market breadth can be manipulated to see what you want to see. If we are bearishly biased, the Nasdaq New Highs minus New Lows histogram chart above doesn’t look favorable. But I would encourage investors to recognize the very few Net New Lows that were made this past Friday. Also here is another way to look at the very same chart, but in trend line formation.
Research Report Excerpt #7
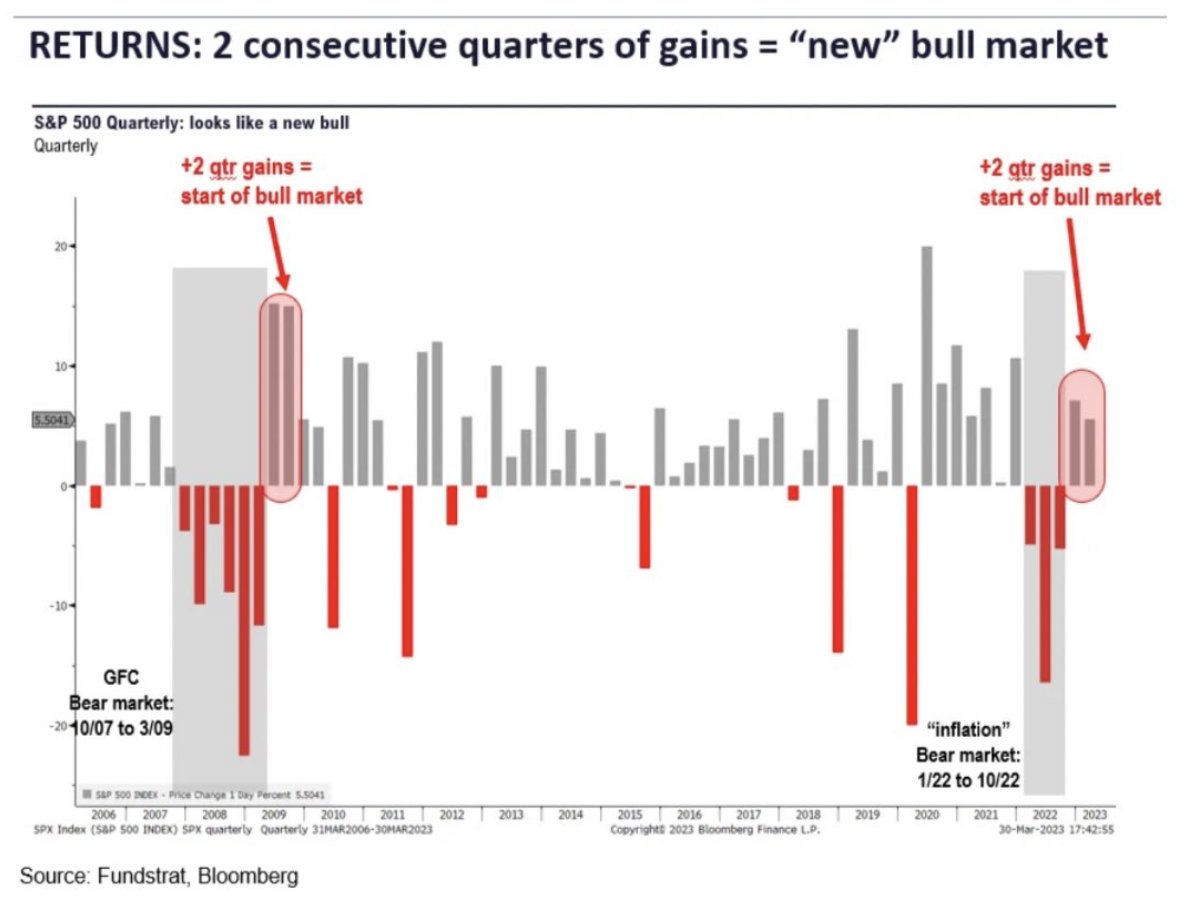
The S&P 500 has now posted 2 consecutive quarters of gains, a pattern not seen in any bear market over the past 50 years. “This solidifies our view that 10/12/22 was the market low and we are 6 months into a bull market… It is the bears who are trapped..” ~Tom Lee
Research Report Excerpt #8
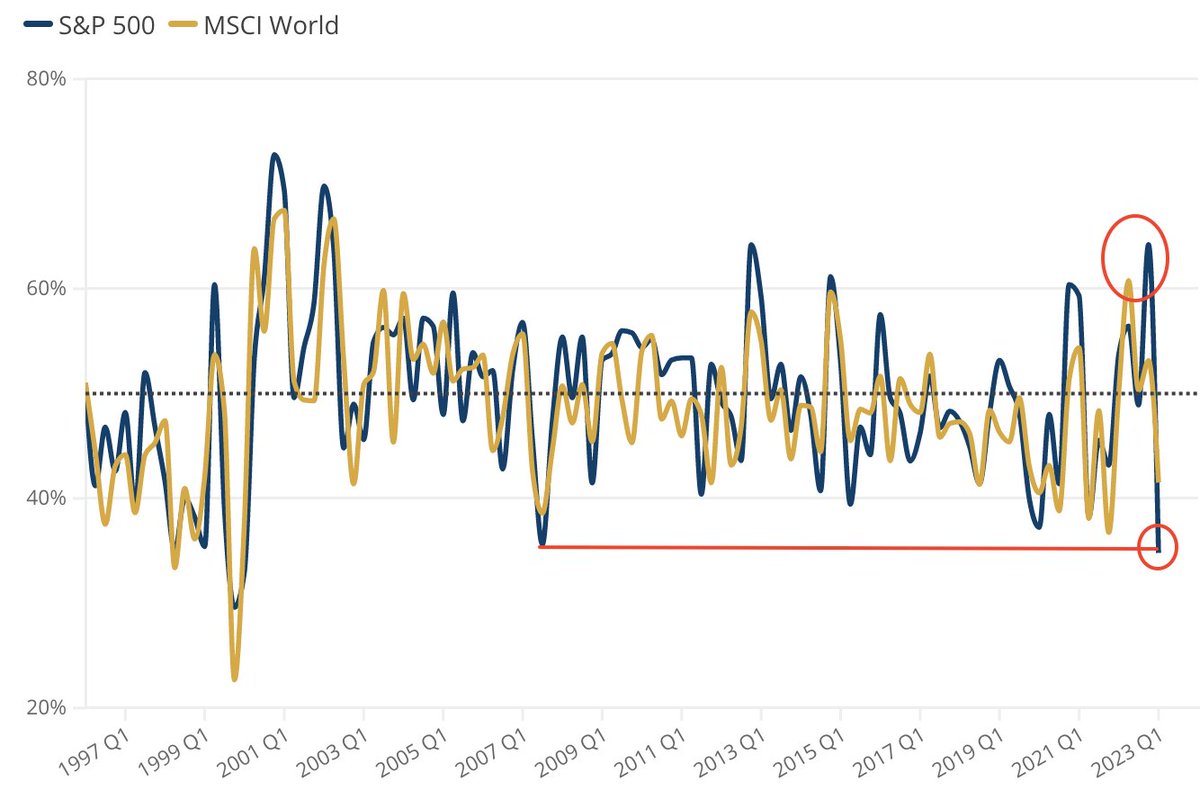
2022 was, indeed, a stock picker’s market. It had the highest percentage of individual stocks outperforming the index since 2013. The chart above evidences that 2023 is the worst stock picker’s market since 2007, with the fewest percentage of stocks outperforming the index.
Research Report Excerpt #9
The technicals for Technology appear quite strong. The chart displays the inverse head-n-shoulders pattern from 2022 into early 2023 has favored the bulls. The Technology sector ETF shows that the 14-day RSI has not held below 40 for each consolidation period in 2023, unlike the declines in 2022. This is typically the indication of a bullish trend.

The Accumulation/Distribution trend started to decline in April of 2022, then went sideways through year-end, but has been in Accumulation mode through 2023. Having said all of that, the breakout has failed to be achieved for the Tech sector to-date (closing 151.24 Friday).


