
Welcome to another trading week!! In appreciation of all of our Basic Membership level participants and daily readers of finomgroup.com content, we offer the following excerpts from our Weekly Research Report. Our weekly Report is extremely detailed and has proven to help guide investors and traders during all types of market conditions with thoughtful insights and analysis, graphs, studies, and historical data/analogues. We encourage our readers to upgrade to our Contributor Membership level to receive our Weekly Research Report and State of the Market Videos and take advantage of this ongoing promotional event today! Have a great trading week, be in touch, and take a look at some of the materials in this weekend’s published Research Report!
Research Report Excerpts #1
Besides the Industrials coming roaring back and speaking to the Russell 2000 small-cap stock index, I’m encouraged to see small caps outperforming to the degree they have in recent weeks. If you like whole numbers, guess how much the Russell 2000 was up this past trading week? The answer: A cool 6.00% exactly. The small-cap index outperformed all 3 of its large-cap cousins by a wide margin this past week; the Dow Jones Industrial Average (DJIA) came in 2nd place with a gain of 3.8 percent.
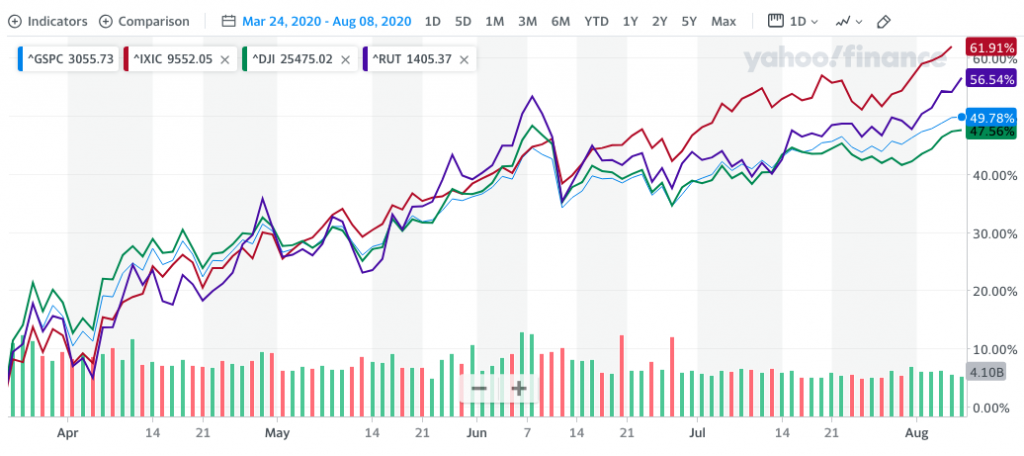
I think I’ll be cooking spaghetti tonight! Sorry, back to our narrative and analysis as the chart makes me think of spaghetti, home made sauce/gravy and garlic & onion meatballs. Anyone hungry? But in the chart above I position the big 4 major indices and dating back to the day after the March lows. Since that time, only the tech-heavy Nasdaq has outperformed the small-cap Russell 2000. I would say, as it pertains to defining a new bull market and how we typically see small-caps leading, by and large that is what is happening in this new bull market. In fact, the Russell 2000 is outperforming the S&P 500 by nearly 7% and the Dow Jones by nearly 9% since the March lows. If anybody suggests that small-caps are lagging, they would only be referring to the YTD time frame, which is not consistent with a new bull market cycle given the prior bear market intra-year. Permabears can prove really tricky with there verbiage. So to reiterate, small caps have been and still validate the new bull market!
Research Report Excerpt #2
The only thing worse than highlighting breadth divergence as a means for predicting price and/or using for trading decision would potentially be found in sentiment indicators. There are too many sentiment indicators and they have been telling different stories throughout this market rally. It’s because of the diverging sentiment indicators that many investors/analysts have been scratching their heads. Depending if you are bearish or bullish, it is fairly easy to create a narrative using sentiment to make your case. Just pick a sentiment indicator! While the bears have concentrated on this data point, however, the S&P 500 defies them, moving ever closer to new highs. The Nasdaq ridicules this crowd who focuses on sentiment indicators by posting its 32nd new high in 2020 this week.
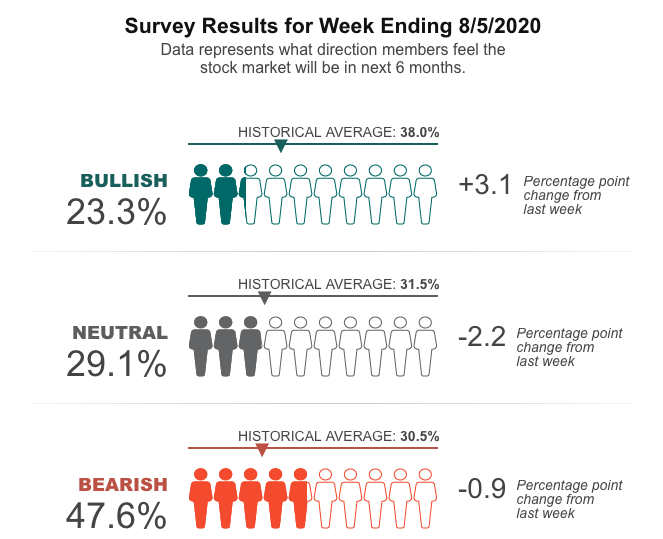
Two weeks ago, the AAII Investor Sentiment Survey showed that only 20.2% are bullish on the market; that is the lowest reading since the week of May 23, 2016, when it stood at 7.8 percent. Bears, on the other hand, soared to 48.5 percent. The Bears outnumbered the Bulls by more than 2-to-1. Bullish sentiment rose this past week to 23.3%, but this remains well below the historic average of 38.5 percent. These investors are quite pessimistic on the market as the bearish sentiment remains well above its historic average. This type of sentiment is seen at major market bottoms, not at market tops. It’s part of the wall-of-worry that the market climbs.
The CNN Fear & Greed Index paints a different story. As shown in the index below, it would assume that investors are mostly greedy at this point, not bearish or fearful.
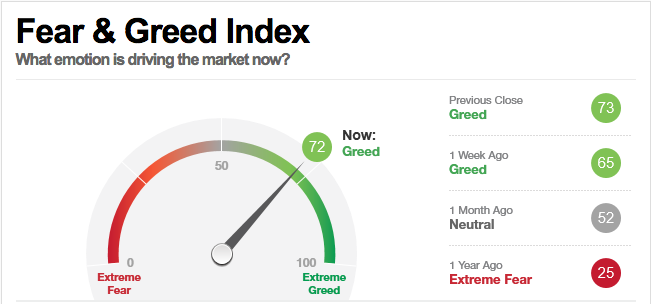
These sentiment indicators are assumed to be contrarian in nature, but both are sending different messages. When the CNN Fear & Greed Index rises to 80 or higher (Extreme Greed), that would be a cause for concern potentially. The index isn’t quite there yet.
Research Report Excerpt #3
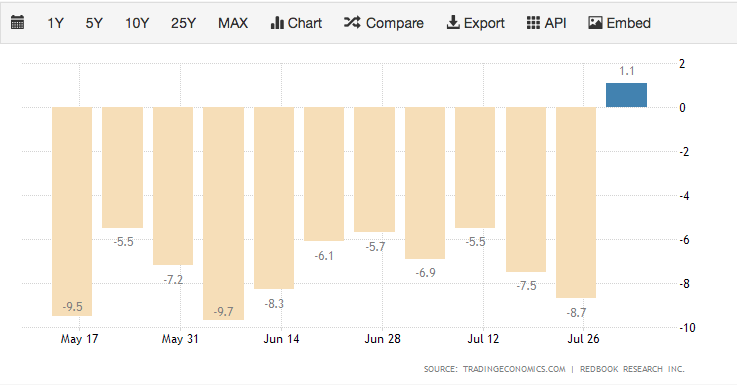
In looking into other high frequency data points we continue to monitor the weekly Redbook retail sales, which faltered heavily since mid-July, but had a sharp turnaround into the first week of August. The recent uptick is likely a function of the back-to-school shopping season.
Another high frequency piece of economic data that has recently become popularized in the financial media is the Google and Apple mobility app tracking data. As you can see from the mobility app heat map below, mobility has improved since the March and April period in the United States, but is failing to achieve the levels of Europe and the Asia Pacific regions. There is a lot less green in the heat map for the U.S., which indicates lesser U.S. mobility is taking place than around the world.
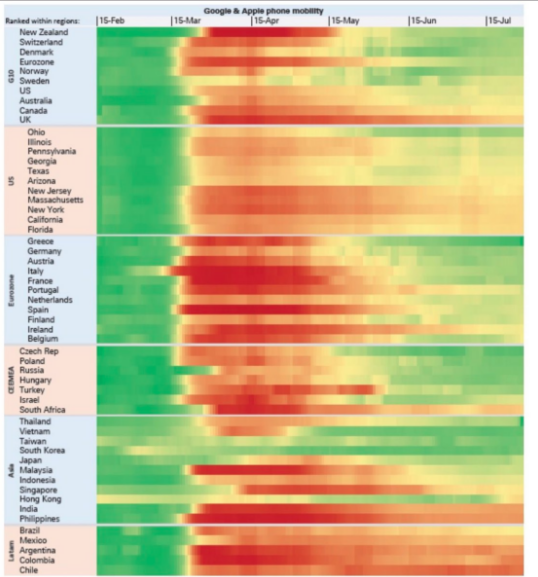
The worst regions of the world, as it pertains to the mobility app tracking remains S. America and Mexico.
Research Report Excerpt #4
The fact remains that jobs need to come back. Without jobs, incomes can’t come back. In the debate between should we or shouldn’t we pass another round of fiscal relief, a closer look at personal income numbers doesn’t leave much room for discussion. More stimulus is very much needed, and soon.
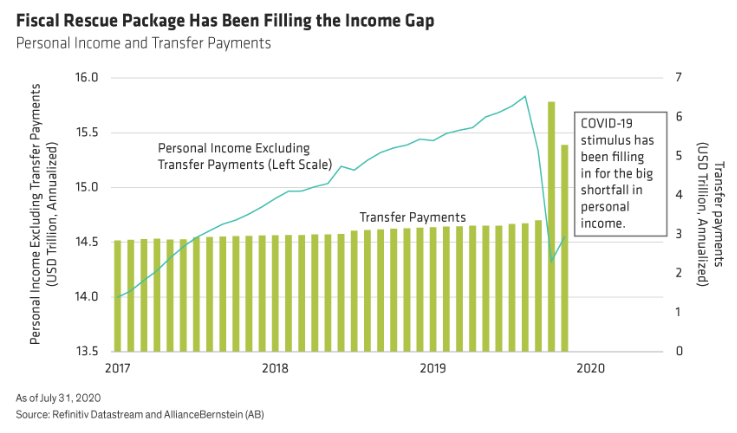
The COVID-19 crisis has left roughly 12 million people still out of work, nearly 10% of the total number of people employed before the crisis. The labor market has started to improve as the economy has gradually reopened, but there’s still a mountain to climb before things get back to normal. This means continued government support is necessary to keep households solvent and the U.S. economy on the path to eventual recovery.
Household income has held steady to this point, but only because of transfer payments, in the form of stimulus checks and enhanced unemployment benefits from the government.
Research Report Excerpt #5
he reality is that the Fed may have done too much in the way of it’s lending facilities and purchase programs this go around. Or at the very least the capacity of its facilities may have offered too much.
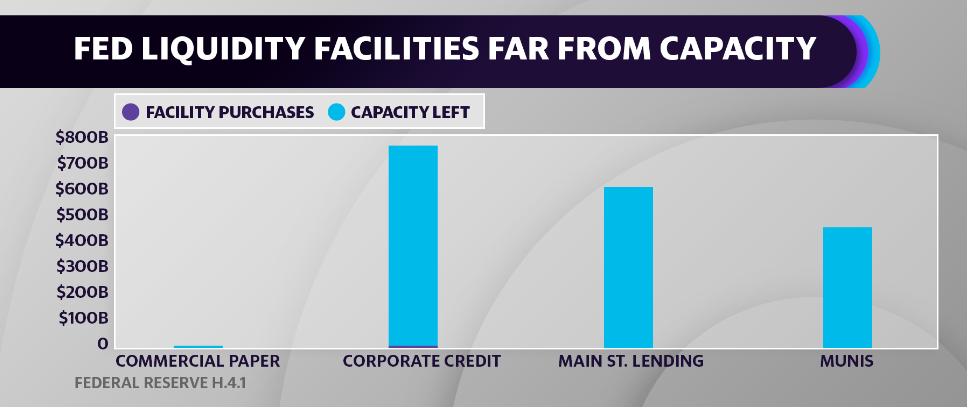
There is plenty of capacity left for the Fed to do much, much more. We’ll hopefully never see the need, but when we review any of the Fed programs, they have a great deal of capacity still yet to be exercised.
Research Report Excerpt #6
The blended earnings decline for the second quarter is -33.8%, which is smaller than the earnings decline of -35.7% last week. Three sectors are reporting year-over-year growth in earnings led by the Utilities and Health Care sectors.
Insight/2020/08.2020/08.07.2020_EI/Earnings%20Growth%20Q2%202020.png?width=920&name=Earnings%20Growth%20Q2%202020.png)
Research Report Excerpt #7
I’ve heard it all before, “The put/call ratio is sending a warning signal.” Whether it is or not is irrelevant if it isn’t going to indicate the magnitude of a market move that investors can position for. Without this piece of information, it renders little practical utility. Here’s another example to consider:
On 5/21/2020, the CBOE 10-day equity put-call ratio exceeded the 90th percentile for all instances since 2000. A 90th percentile reading is indicative of a low put-call ratio. We flip the ranking around for the ratio, as it is part of a broader sentiment composite where high readings in sentiment measures are indicative of optimism. As the graph below shows, the S&P 500 is up 10% and 258 stocks have outperformed the index over that timeframe.
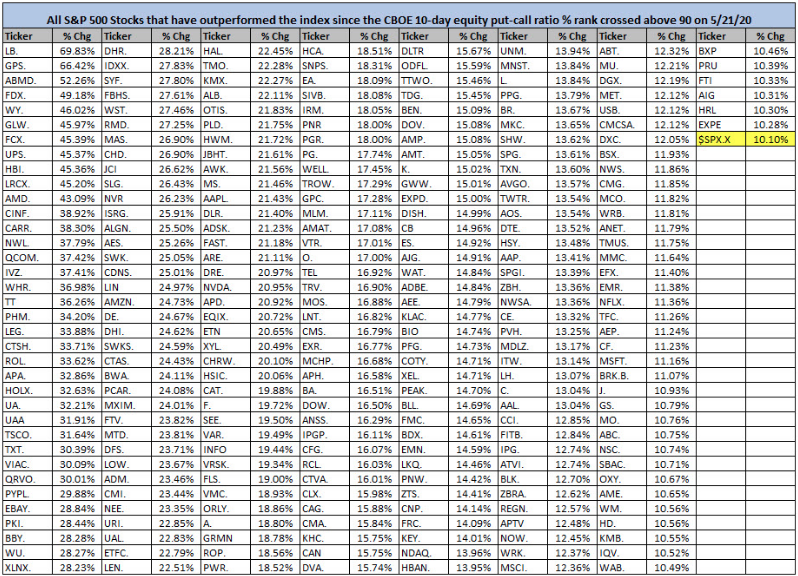
As a sentiment indicator, the varied put/call ratios that also exist with varied duration, lend poorly to defining sentiment and/or what an investor/trader should do with the indicator. As a rule of thumb and when considering sentiment, it matters most when…
- Financial conditions are tightening.
- High Yield bonds are imploding.
- The Fed is hostile.
- New Lows are expanding.
- Breadth Thrusts are absent
Thank you for joining us for another trading week and reviewing our weekly “Must Knows”! To receive and review our weekly, full-scale Research Report each Sunday and our State of the Markets weekly video analysis every Thursday, subscribe to our Contributor Membership level at just $7.99 monthly (Cancel any time)! With these two weekly deliveries, you’ll have all the unbiased and fact-driven market and economic data analysis at your fingertips. Don’t make capital allocation decisions based on headlines that brush the surface of what is and isn’t affecting markets. Let our deep-dive analytics supply you with bottom-up and top-down analytics. You won’t be disappointed. Upgrade today!!


