
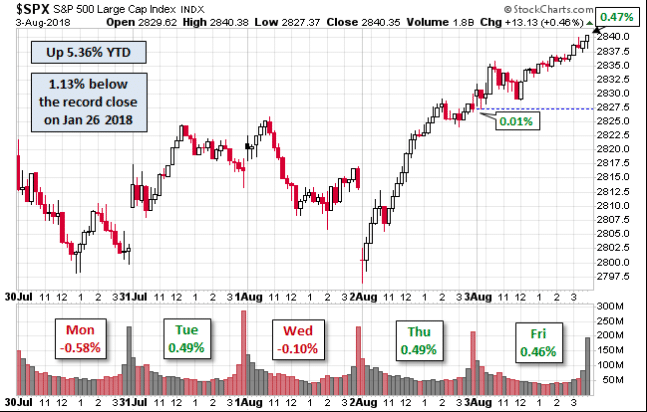
Last week, the finale of FANG reports was delivered by Apple Inc. (AAPL) and served to deliver the first $1trn market cap for investors and Wall Street. Some have even characterized the feat of magnificence as “market saving”. With some investor angst alleviated by Apple’s Q3 2018 earnings report, the broader market was pushed higher for the week. The Dow Jones Industrial Average gained 133 points on Friday, or 0.5%, to 25,459 to finish the week flat. The S&P 500 rose 13 points, or 0.47%, to 2,840 for a weekly gain of 0.8% while the Nasdaq Composite Index added 9 points, or 0.1%, to 7,812. The tech-heavy index closed out the week 1% higher.
The biggest economic data point last week came by way of the monthly Nonfarm Payroll report. Friday’s July Nonfarm Payrolls report showed that 157,000 jobs were created in July, compared with MarketWatch consensus estimates for 195,000. Despite missing economists’ lofty expectations, the markets moved higher post the report. A total revision for the months of May and June equated to additional 59K jobs created. For the July period, the annualized rate of wage gains was unchanged at 2.7%, suggesting no immediate pressure on inflation. The unemployment rate fell to 3.9% from 4% in the prior month.

Market Pundits
What remains an important fact since the February correction for investors is that the markets have yet to achieve a new all-time trading high in the S&P 500. That long awaited accomplishment is now at investor doorsteps with the SPX set to begin the trading week some 30+ points shy of the present record level. The expected move for the week to come is $28, hence, at the doorsteps.
When it comes to the elongated bull market cycle, not every analyst or financial institution is found with an optimistic outlook for markets going forward. Morgan Stanley has been signaling a bear market scenario for several months and was most recently found reiterating their stance. Here is what Morgan Stanley’s chief U.S. equity strategist Michael Wilson said on the heels of Friday’s jobs report.
“I’m a bit leery about the fact that small caps have become a perceived safe haven in the event of trade conflicts,” and that this “perception may now be overpriced.
Just remember that those last innings can bring a lot of excitement and anguish, too, depending on which team you are rooting for.
It is important to recognize that the forecast, insights and go-forward strategies put forth by Wilson and Morgan Stanley are reiterations. According to Wilson, Morgan Stanley recently sold 25% of its large-cap growth position, rotating that into large-cap value strategies. In addition, the investment bank reduced its small-cap equity holding positions by 30%, putting that into cash equivalents.
What most investors have heard for the bulk of 2018 surrounds the notion that only a handful of stocks (FAANG) have held up or promoted the bull market cycle further. Finom Group disagrees with this mantra that has been largely negated with factual data and supporting NYSE A/D line record levels as the year has progressed. Moreover, the recent record levels for the Russell 2000 also negate the notion of highly concentrated market breadth. So let’s dig a little deeper into the trending market breadth further and which supports our FY18 view on the markets.
Below are a few reasons why Finom Group still sees broad participation and a continuation of the bull market, as offered by LPL Financial:
- The Advance/Decline (A/D) lines for the NYSE and S&P 500 both closed at all-time highs last week.
- The Dow A/D line made new highs earlier last week.
- The Value Line Geometric Index is less than 2% from its all-time high. This index equally weights all stocks and is a good gauge for how the median stock is performing.
- The Technology Equal Weight Index made a new high recently
- The Nasdaq 100 Equal Weight Index made a new all-time high recently.
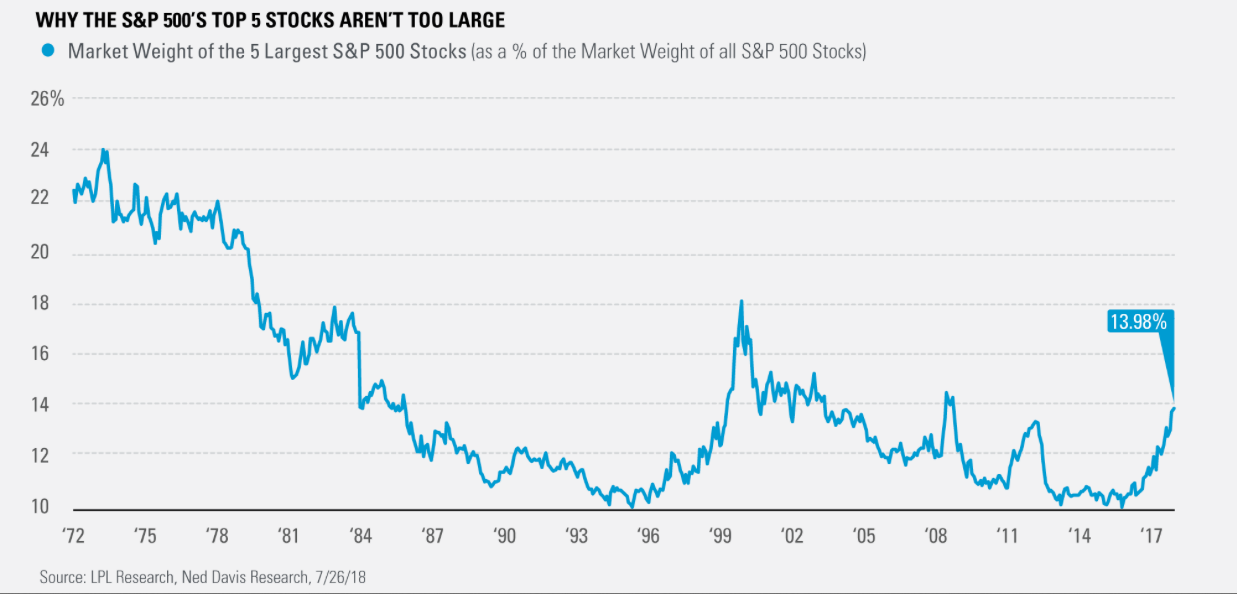
Data from Ned Davis Research (NDR) shows that the top five stocks in the S&P 500 account now for 13.98% of the total index. As the following chart from LPL Financial shows, the current weight of the top five stocks is actually beneath the average of 14.33% using NDR’s data going back to 1972.
In other words, there’s been a great deal of negative discussion concerning market breadth for much of 2018 that is completely negated against the market’s very own historical data. What the data points show is that the market is largely performing as it always does or even to a lesser performance level when viewed for historic market breadth.
Corporate Buybacks
As consistently as market pundits lay claims to poor market breadth, and with error, there has also been a lot of talk about corporate buybacks distorting true earnings growth. Regardless of whether or not earnings growth is 100% organic and sales driven or not, one can’t deny the flow-power of buybacks. As such, firms like Morgan Stanley, while may be proven directionally accurate on the market at some point in the not too distant future, have clearly not weighed the impact of corporate buybacks appropriately since the February period. (See chart below)

More importantly and as the S&P 500 nears record levels, the average tendency is for buyback activity to spike in August, with an average 13% of total buybacks for the year taking place this month.
PBOC Takes Action Friday
Recall in a more recent research report, we denoted the Chinese Yuan devaluation that was being executed at levels not seen since August-September of 2015. But on Friday, the PBOC intervened with a 20% increase in Reserve Requirements. As a result of PBOC intervention, the Dollar softened and the Yuan firmed from a 15-month low hit earlier in the session.
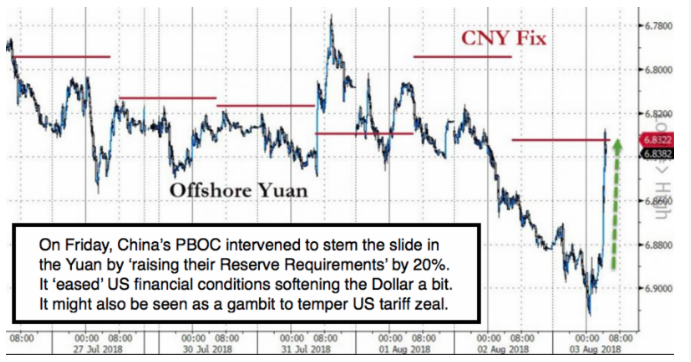
The PBoC will require a reserve ratio of 20% for financial institutions engaged in forwards trading, in a move authorities say is designed to head off macro financial risks in light of recent FX volatility stemming from the trade frictions with the United States. The new rule goes into effect on August 6. This may have been the first “blink” from China in its dispute on trade with the United States.
The intervention from the PBOC on Friday has been overlooked by most media outlets in favor of the reported retaliatory statement from the Chinese state media, citing an additional $60bn in tariffs to be implemented by China on the U.S. should the U.S. go through with its proposed additional $200bn in tariffs.
Market Complacency Against Tariff Backdrop
Given the recent measures taken by the PBOC and China officials with respect to the Yuan and trade tariffs, this calls into question just how complacent markets have become even as the trade war seems ever escalating. The question at the heart of the issue then is “why”. Why have markets brushed off the trade rhetoric/war and its potential impact on the economy and corporate earnings? It’s been several months now of global trade tensions, not just trade tensions with China but also between the U.S. and its European and former NAFTA allies. Given the markets complacency and investor bewilderment as to why the market has reacted as it has, Finom Group has been forced to consider more deeply why investors have put the trade conflict on the back burner. We’ve compiled a number of rationales as follows:
- GDP above 4%
- Inflation is still tepid at best
- Rates are rising, but not seen reaching or surpassing levels expressed at the peak of the last bull market cycle
- Corporate earnings growth is at levels not seen since 2010
- Cash flows and liquid asset valuations are at hogh levels, which makes debt levels easily managed in a rising rate environment
- Corporate buybacks are at record levels, providing a backstop for markets even as liquidity is being drained from the markets
- Albeit at a modest pace, wages are rising
- Unemployment levels near record lows
- Job growth remains strong
Even with the many bullish bullet points noted above, a trade war escalation should prove to curb investor appetite and put a lid on equity market performance. It could easily be argued that this has been the case since February and the reason the S&P 500 hasn’t achieved a new all-time high level since January, but for the sake of well-advised risk management, let’s say it isn’t the case and respect historic market valuations. After all, the forward 12-month P/E ratio for the S&P 500 is 16.5. This P/E ratio is above the 5-year average (16.2) and above the 10-year average (14.4).
White House Impact on Markets Mid-term
Finom Group’s careful analysis (full report available to subscribers only) and exploration of investor psychology has extrapolated a rather rational explanation as to why institutional investor participation hasn’t waned in the face of trade war escalation and potential fall-out from the issue. The bottom line is they don’t believe the current U.S. Administration, President Trump included, will be able to implement it’s policies/tariffs by September’s implied implementation deadline.
A grand bargaining agreement between the U.S. and China has a 50/50 probability. We have not seen any advantage in favor or against a grand bargain. But to the point of the White House being able to implement the current tariffs proposed, we have to bring forth this perspective in conjunction with the ongoing Mueller investigation. With mid-term elections upon us in the coming months; the probability for the Mueller investigation to conclude or to offer a statement on the investigation are given ABOVE even odds. No one can really predict what the market will do next. But you can identify when risks are elevated and we believe that will be the case post mid-August.
S&P 500 Earnings in Focus
Moreover, Finom Group remains focused on our FY18 outlook, which also juxtaposes the geopolitical variables with market fundamentals. As such we conclude our weekly research report with a look at the corporate earnings forecast for the S&P 500. The following statements are offered by FactSet with respect to S&P 500, Q2 earnings results.
“For Q2 2018 (with 81% of the companies in the S&P 500 reporting actual results for the quarter), 80% of S&P 500 companies have reported a positive EPS surprise and 74% have reported a positive sales surprise. If 80% is the final number, it will mark the highest percentage since FactSet began tracking this metric in Q3 2008.
For Q2 2018, the blended earnings growth rate for the S&P 500 is 24.0%. If 24.0% is the actual growth rate for the quarter, it will mark the second highest earnings growth since Q3 2010 (34.1%).
Looking at future quarters, analysts currently project earnings growth to continue at about 20% through the remainder 2018. However, they predict lower growth in the first half of 2019.”
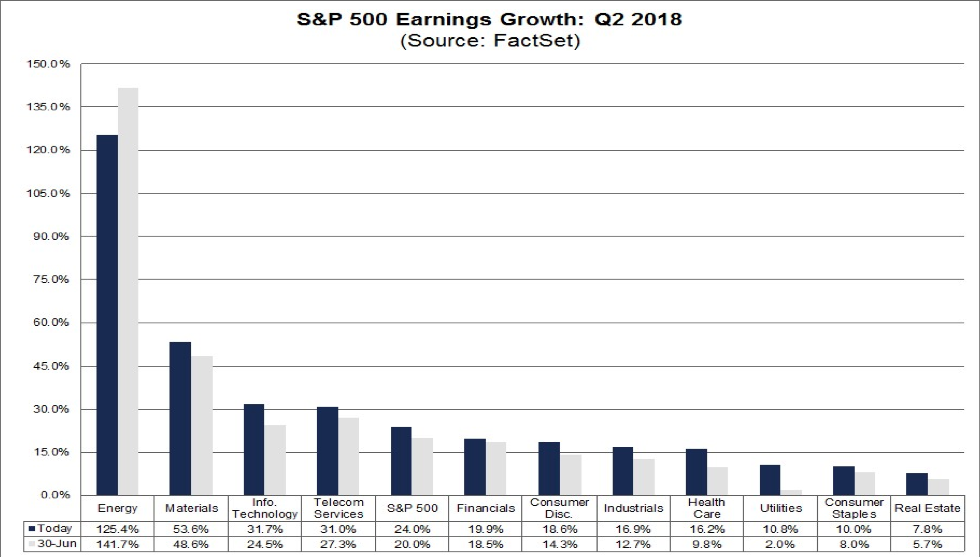
As depicted in the table above, the S&P 500 earnings growth forecast has grown 4% since June 30, 2018. The blended earnings growth outlook presented by FactSet is mirrored with optimism from Thomson Reuters’ forecast as follows:
S&P 500 Aggregate Estimates and Revisions
- Second quarter earnings are expected to increase 23.5% from Q2 2017. Excluding the energy sector, the earnings growth estimate declines to 20.4%.
- Of the 500 companies in the S&P 500 that have reported earnings to date for Q2 2018, 78.6% have reported earnings above analyst expectations. This is above the long-term average of 64% and above the prior four quarter average of 75%
- The Q2 2018 blended revenue growth estimate is 9.2%. Excluding the energy sector, the revenue growth estimate declines to 8.0%.
- 0% of companies have reported Q2 2018 revenue above analyst expectations. This is above the long-term average of 60% and above the prior 4-quarter average of 72%.
** For the full version of this report, subscribe to finomgroup.com today**


