
U.S. indices look to end the Q3 2018 period on a high note and as portfolio managers complete their respective quarterly rebalancing efforts and exercises. If you wondered as to why there was such outperformance from the FAANG stocks in Thursday’s trading action, wonder no more as many portfolio managers aim to show ownership of at least some of the year’s outperformers.
After the realized rate hike from the FOMC this week and a slew of economic data hitting the tape on Thursday, the major averages managed to close the day in positive territory with the tech-heavy Nasdaq leading the way, up .65% on the day. Heading into the final trading day of the week, investors are weighing the upcoming earnings season against a positive economic backdrop and looming midterm elections. But in the pre-market trading, European markets are taking the lead with sharp declines across the region. Fears surrounding Italy’s budgetary activities blowing up are weighing heavily and seeping into U.S. investor sentiment.
Economic Data
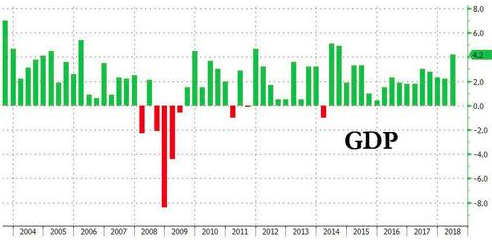
U.S. real gross domestic product for the 2nd quarter rose at a 4.2% annualized rate, unrevised from the earlier estimate, the Commerce Department said Thursday. The boom in second quarter growth was led by consumer spending, exports and federal and state government spending. Consumer spending rose 3.8% in the second quarter, unrevised from prior estimates.
This week’s report on initial jobless claims was disappointing, depending on how one looks at it. While economists were expecting claims to ratchet up to 210K, the actual reading came in at 214K. This week’s increase represents the largest 1-week rise in claims since May and put the actual reading at the highest level in a month.
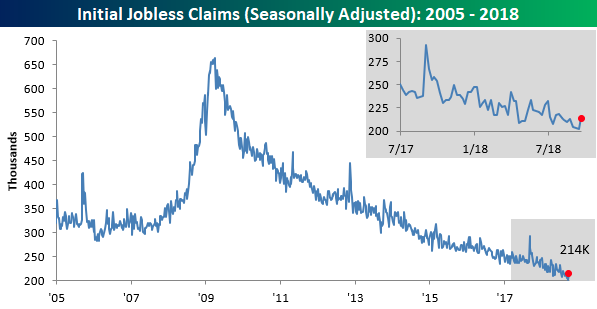
Even with the increase in claims, this week’s claims number represents the 186th straight week where claims were at or below 300K, the 51st straight week where claims were at or below 250K (longest streak since 1970), and the 12th week where claims were at or below 225K, as reported by Bespoke Investments.
Rates for home loans jumped along with yields in the broader bond market, taking financing costs to a recent high. To some degree, this has resulted in fewer consumers signing contracts to buy existing homes in August. Mortgage rates rose in August and are now nearly a full percentage point higher than they were one year ago. Job creation, however, is stronger as is wage growth, which is pushing more demand for housing. The Realtors expect total sales this year to be 1. 6% lower than sales in 2017.

While mortgage rates are moving higher, they are still extremely affordable historically and more affordable than even at the turn of the century. If we look at a 30-year fixed rate mortgage chart above, we can see that mortgage rates were significantly higher not even 8 years ago.
Supply continues to be the number one factor impacting the strength of home sales in the United States, which is also serving to push the median price of a home to all-time highs. With that said, pending home sales data was released on Thursday.
Pending home sales fell 1.8% for the month, according to the National Association of Realtors’ seasonally adjusted index. Sales were down 2.3% compared with August 2017. That was the 4th monthly decline in the past five months and the slowest sales pace since January.
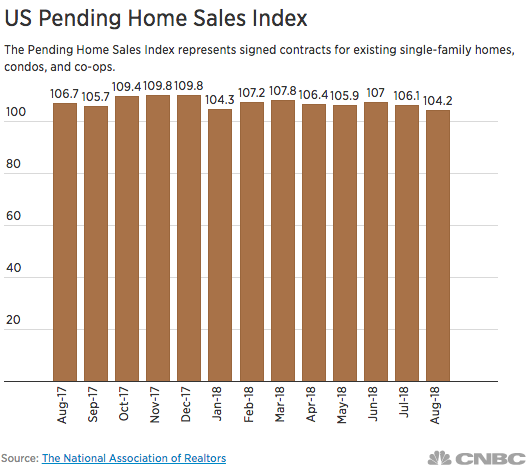
“The greatest decline occurred in the West region where prices have shot up significantly, which clearly indicates that affordability is hindering buyers and those affordability issues come from lack of inventory, particularly in moderate price points,” said Lawrence Yun, chief economist at the NAR.
While mortgage rates are on the rise and housing sales are softer YOY, the housing market remains healthy due in part to consumer strength that is uplifted by wage growth and tax cuts. Freddie Mac’s chief economist, Sam Khater, said “consumer confidence is at an 18-year high, and job gains are holding steady. These two factors should keep demand up in coming months.”
When reviewing the housing data, it’s important to recognize that soft patches are a normal part of the housing industry/market. We’ve seen soft patches many a time before and more recently from 2015-2016. (See chart below)
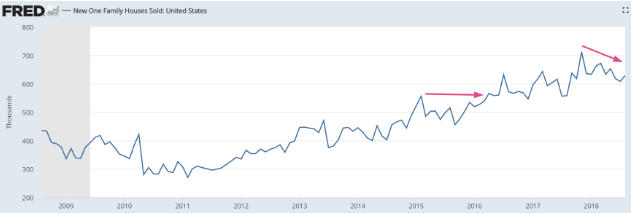
Based on the chart above, it has been 9 months since New Home Sales printed a new high (November 2017). Again, this is not an unprecedented occurrence as it took 14 months for New Home Sales to make a new high from February 2015 – April 2016.
The last data set of the week will come via Personal Consumption and Expenditures for the month of August. Both are expected to show an uptick of .4% for the month. PCE is the more relevant data used by the FOMC in determining inflation and adjusting for inflation. The data will be released at 8:30 a.m. Eastern Standard time and followed by consumer sentiment data at 10:00 a.m. Easter Standard Time.
In a recent interview discussing the monthly economic data sets, Finom Group’s chief strategist Seth Golden offered the following:
“As I review economic data throughout the year, I consider where we are in the economic and market cycle. It’s highly relevant to investing performance to spot indications of a weakening economy. At present, we see the most recent initial claims as negligible and still trending lower YOY. The soft patch in the housing market is something to keep an eye on as rates edge higher, but I don’t see anything abnormal in the housing market, which has been plagued by a lack of inventory for the last several years. Both jobless claims and housing can be used as indicators of the overall strength or weakness in the U.S. economy. Jobless claims tend to tick higher and home purchases tend to tick lower after an economic expansion has peaked. This does not mean the equity market will have peaked simultaneously, as data impact tends to lag consumption habits and actual earnings impact. Nonetheless, I am keeping a keen eye on all the monthly economic data sets.”
Taking a look back at the week that was, fund flows were actually positive. According to Tom Roseen of Thomson Reuters, for the first week in three, investors were net purchasers of fund assets (including those of conventional funds and ETFs), injecting a net $15.5 billion for Lipper’s fund-flows week ended September 26, 2018. However, fund investors padded the coffers of only money market funds (+$16.6 billion) for the week while being net redeemers of equity funds (-$582 million), municipal bond funds (-$385 million), and taxable fixed income funds (-$177 million).
With fund flows turning positive recently, we can also see that investor sentiment has also turned more bullish via the American Association of Individual Investors survey (AAII).
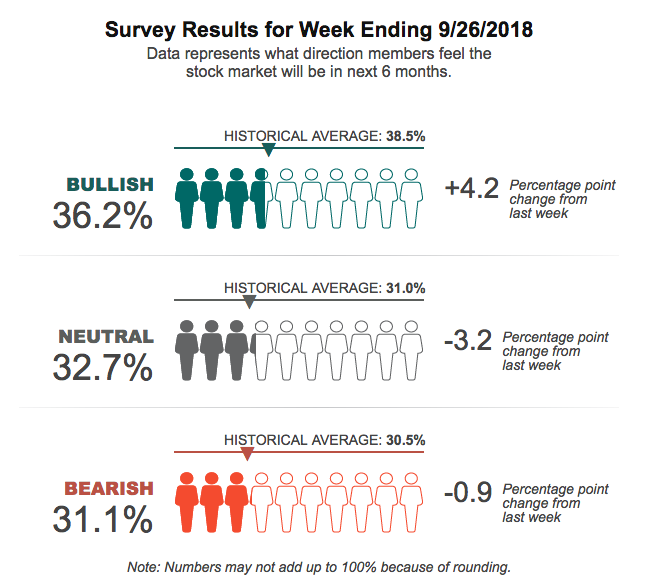
Optimism among individual investors about the short-term direction of the stock market rose but remains below average. The latest AAII Sentiment Survey also shows declines in neutral and bearish sentiment. Bullish sentiment rose 4.2 percentage points to 36.2 percent. Even with the increase, optimism remains below its historical average of 38.5% for the third consecutive week.
Neutral sentiment, expectations that stock prices will stay essentially unchanged over the next six months, pulled back by 3.2 percentage points to 32.7 percent. Neutral sentiment remains above its historical average of 31.0% for the 31st time in 32 weeks. Bearish sentiment, expectations that stock prices will fall over the next six months, declined by 0.9 percentage points to 31.1 percent. Pessimism is above its historical average of 30.5% for a third consecutive week.
At current levels, all three indicators are well within their typical historical ranges. Most of the responses for this week’s survey were recorded before yesterday’s Federal Open Market Committee (FOMC) meeting statement was released. The survey period runs from Thursday through Wednesday. In July, almost half of the surveyed AAII members said they favored further rate hikes.
As we close out the month of September and the 3rd Quarter of 2018, earnings season will come into greater focus next week. Expectations are running high after a roughly 25% YOY S&P 500 earnings growth for the Q1 and Q2 periods. We will dig into the Q3 earnings expectations more deeply in Finom Group’s weekly research report, published Sunday. With that being said, some economists and analysts fear that the recent U.S. decoupling from the global economy may prove temporary, unsustainable and a drag on earnings growth potential. If global growth doesn’t pick up, the bull market will face a major hurdle, market watcher Scott Wren says.
“I think really an all-out trade war is a relatively low probability. I’m more worried about: Is global growth going to slow down, stabilize, what’s going to happen there? We need some help from the overseas economies to get to the earnings estimates, and the type of targets that we’re looking at.
Valuations are not cheap. They are not extremely stretched to the upside, but I sense we could be in the early innings, very early innings, of the chasing activity that would typically take you to the top. That could play out over a year or two.”


