It was a strong showing for Wall Street yesterday and ahead of what is being called the launch of the largest economic trade war in history. The characterization was spirited overnight as tariffs went into place from both the United States and China on respective exports. Investors largely ignored the long since telegraphed tariff implementation that went into affect over night in favor of a modest ADP employment number and Fed minutes.
Private payrolls grew less than anticipated last month as businesses struggled to locate and hire employees, ADP and Moody’s Analytics said Thursday. Jobs in the U.S. grew by 177,000 in June, the report said, while economists polled by Thomson Reuters expected a gain of 190,000. Jobs growth for the previous month, however, was revised up by 11,000 to 189,000.
“Business’ number one problem is finding qualified workers,” Mark Zandi, chief economist at Moody’s Analytics, said in a statement. “At the current pace of job growth, if sustained, this problem is set to get much worse. These labor shortages will only intensify across all industries and company sizes. ”

The jobs market and its 3.8% unemployment rate is not just a concern of Zandi’s as it came into question and concern amongst Fed officials. Fed Members noted in their June meeting what has now become a frequently mentioned economic concern, the difficulty employers are experiencing in finding qualified workers to fill job openings. Business owners are increasing salaries and benefits to retain workers in some cases while others were offering training or turning to automation in lieu of searching for new workers.
Today we’ll get even more data on the labor and employment front via the June Nonfarm payroll report due out at 8:30 a.m., ahead of the market open. Now let’s quickly review some of what we learned through the Fed’s June meeting minutes. We’ll kick this segment of our morning market briefing off with the following paragraph extrapolated from the Fed minutes:
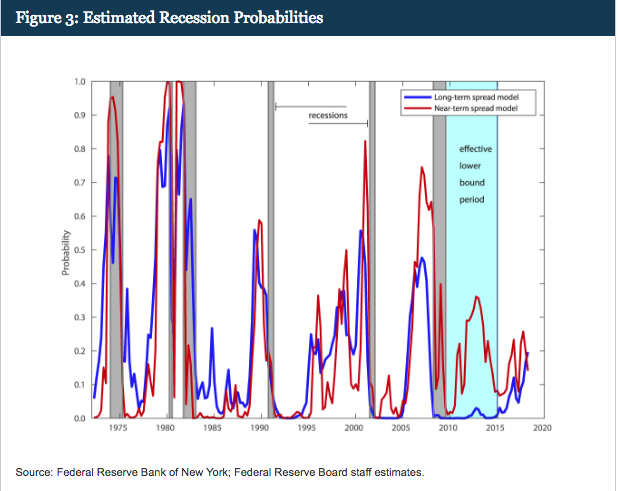
“Participants also discussed a staff presentation of an indicator of the likelihood of recession based on the spread between the current level of the federal funds rate and the expected federal funds rate several quarters ahead derived from futures market prices. The staff noted that this measure may be less affected by many of the factors that have contributed to the flattening of the yield curve, such as depressed term premiums at longer horizons. Several participants cautioned that yield curve movements should be interpreted within the broader context of financial conditions and the outlook, and would be only one among many considerations in forming an assessment of appropriate policy.”
Traditionally, economists have been forced to utilize the spread between the 10-year and the 2-year Treasury note as an indicator for a pending recession. Usually, the inversion of the yield curve results in a recession between 9-15 months, depending on the source. But within the Fed minutes noted above, it’s clear that the Fed is acknowledging that this time is indeed different. There has never been the depth of a recession in the modern era for which the need of quantitative easing has resulted in the protraction of a subsequent economic expansion. And that economic expansion has never been so modest over such a protracted period post such a dramatic economic decline. Given the anomalistic economic conditions over the last decade, the Fed has recognized paradigm shifts in the economy that are largely demand side activities that have also altered credit markets. But to the main point of these particular Fed minutes, while the majority of economists and analysts are focused on the spread between 2s and 10s as an economic recession indicator the Fed is alerting the public as to why they are using a new methodology to define when a recession may ensue.
The origins of the new Fed recession indicator come from a paper revealed on June 28,2018 and written by Eric Engstrom and Steven Sharp. The 2 staffers advocate looking at what they called a near-term forward spread. They suggest looking at the difference between the current implied forward rate on Treasury bills six quarters from now, and the current yield on a 3-month Treasury bill. This newfangled indicator suggests the current odds of a recession in the next year are only about a 15% chance, which isn’t that much different from what the yield curve suggests. (See graph below)
Coupled with the new recession indicator in the Fed minutes were concerns surrounding the Fed allowing the economy to run hot for a period of time. Some members expressed “concern that a prolonged period in which the economy operated beyond potential could give rise to heightened inflationary pressures or to financial imbalances that could lead eventually to a significant economic downturn. While the fear of overheating remained amongst the group of Fed officials it did not curtail the appetite for future rate hikes. The possible offset to an overheating economy may come in the form of trade tensions, as offered in the Fed minutes through its business contacts.
“Fed business contacts “expressed concern about the possible adverse effects of tariffs and other proposed trade restrictions, both domestically and abroad, on future investment activity.” Moreover, they indicated “capital spending had been scaled back or postponed as a result of uncertainty over trade policy.
Most participants noted that uncertainty and risks associated with trade policy had intensified and were concerned that such uncertainty and risks eventually could have negative effects on business sentiment and investment spending.”
Given the uncertainty around global trade, it could very well come to be that the previously outlined growth in corporate expenditures comes to a screeching halt. After a period of Capex curtailment from 2016-2017, an uptick was expected through 2018, as reported by many S&P 500 companies during the Q1 2018 period. With the unknowns surrounding tariffs, corporations may be forced to update their capital spending plans during the Q2 earnings season.
As a U.S./China trade spat ramps up and officially begins with tariffs firmly in place, equity market investors are left to forecast the next move by both parties. In the meantime, the impact of the first round of tariffs on $34 billion in Chinese goods will be “quite small,” said Ethan Harris, head of global economic research at Bank of America Merrill Lynch. But he doesn’t “see the war ending until there are casualties.”
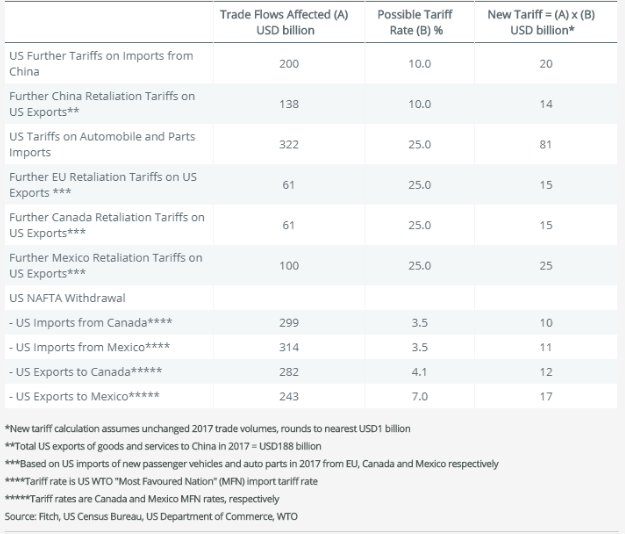
Fitch ratings is also out with its warning to President Trump regarding the trade tariffs. Fitch Ratings warned that rising tensions between the U.S. and its trading partners could lead to new measures with a greater impact on global growth with as much as $2 trillion in global trade in jeopardy.
There will be two dominating themes to end the trading week. The first theme, of course, will center on the “trade war”. It will likely portray all the negatives and ancillary consequences of the current trade tariffs implemented. The second theme will center on the reported June Nonfarm Payroll report. So let’s see what we can expect from the report.
Wages have been a hot button topic this year when it comes to the labor market. After rising sharply in January, that monthly report did not turn into a lasting trend with wages stagnating since. Economists are convinced wages will move higher, perhaps crossing the 3% barrier later this year for the first time since 2009. Having said that, economists estimate the yearly rate will edge up to 2.8 percent.
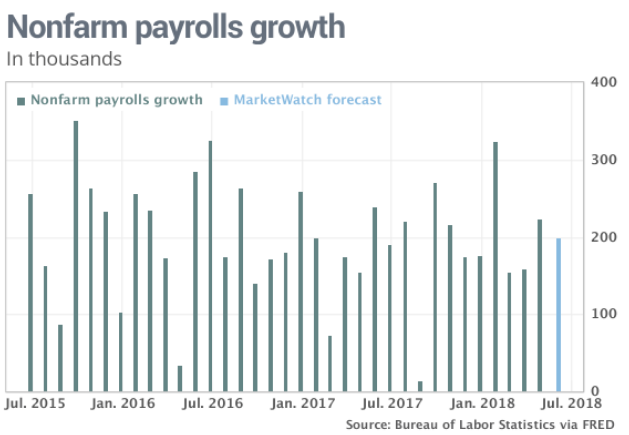
While the pace of jobs is expected to slow in the coming quarters and years, economists predict the U.S. economy added close to 200,000 new nonfarm jobs last month. Economists predict the unemployment will remain steady at 3.8% in June, but it’s widely believed the jobless rate will soon move toward 3.5 percent. But again, probably the most important metric within the labor report will be the wage metric, given the low unemployment rate. A low unemployment rate has long been associated with rising inflation, but prices are still relatively low even though they are higher over the past year. The conundrum for economists is that even with very low unemployment, wages aren’t rising all that quickly…yet! Moreover, the link between employment and inflation appears broken or in a state of hibernation.
It remains to be seen just how equities finish the week with a great deal of headlines that have the potential to affect economies align at week’s end. Outside of the economic data and geopolitical realm we can look at some anecdotal indicators for equity market direction. A recent academic study by Darien Huang, a former finance professor at Cornell University and currently a Quantitative Trader/Researcher at Tudor Investment Management, and Mete Kilic, a professor of finance and business economics at the University of Southern California looks at the performance of Gold and Platinum as an indicator for equity market direction over time. They found that the gold-platinum ratio is a good stock market predictor; it’s bearish when the ratio is low, and bullish when it is at high levels.
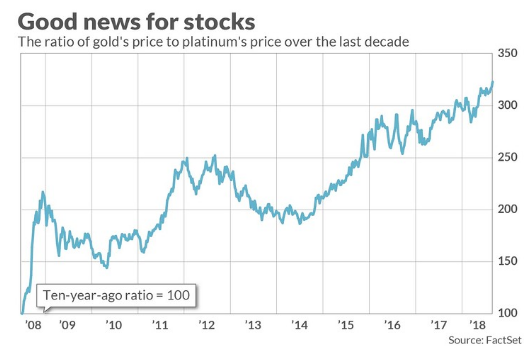 As shown in the chart above, the ratio is at an all-time high level. Huang and Kilic found that, at least since 1975, the gold-platinum ratio has had a significantly better track record than 9 other well-known indicators that researchers previously found to have predictive ability including the Cyclically-Adjusted PE Ratio, or CAPE, made famous by Yale University’s Robert Shiller.
Another market indicator may be characterized as a contrarian indicator in nature. This was originally put forth in an article authored by Troy Bombardia of Bull Markets. It’s called the Dennis Gartman indicator.
“Dennis Gartman said, “We are in the beginning of a bear market”. This guy is one of the best contrarian indicators out there.”
Truth be told, this is a well-known fact and one of the reasons Gartman, who used to be a regular guest on CNBC, has been sidelined over the last couple of years and only appearing sparingly on the network. By performing a Google search with the key words “Gartman is a contrarian indicator”, you’ll find a host of articles on the subject matter. In fact, the compilation of his market calls has been found in error more than 50% of the time.
It was just a couple of days ago, and again, that Gartman outlined why we are in a bear market. I state “again”, as the infamous investor and commodities analyst has been a permabear for years now. You’re welcome to review the video from an interview on CNBC from September 2015 denoting why we were in a bear market then if you have the time. Simply click the link.
Gartman is the perfect example of headlines, fear and living in the moment that tend to get investors and traders in trouble. But as it pertains to anecdotal equity market directional indicators, he’s long since been a great contrarian indicator. Eventually he’ll be right; by that we mean eventually we have to enter a bear market and as such all he has to do is maintain his bearish stance on the equity markets.
So let’s see how the jobs report looks as we look to trade what the markets deliver and to end another trading week at Finom Group.


