Research Report Excerpt #1
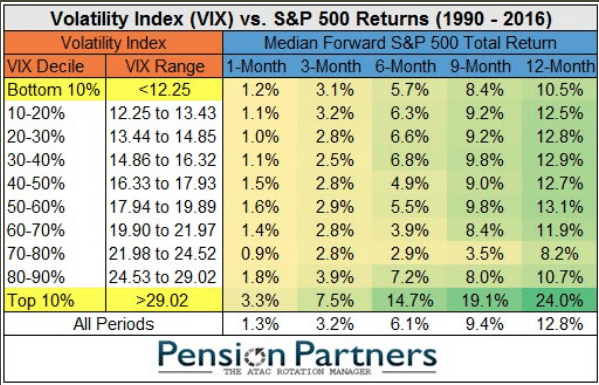
It may prove counterintuitive to many market participants, but the higher the VIX moves, the better the long-term returns. Having said that, we may have to withstand more volatility as we trek through weekly headlines and a CPI delivery this coming week. With an average intraday trading range of 2 percentage points, the S&P 500’s average intraday range in the first 41 trading days of the year has been the widest since 2009, and the only other year besides 2009 where the average range was wider was 2008. There’s something promising and antagonizing in the offered years. In 2008, the market had a dreadful bear market. In 2009, the market had a glorious recovery.
Research Report Excerpt #2
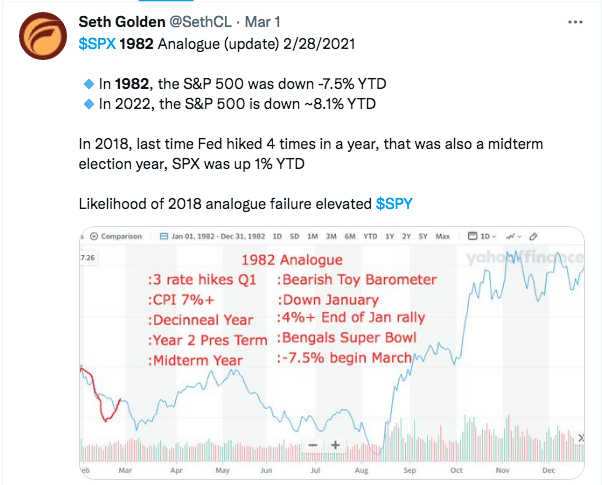
Unfortunately and depending on time horizons, the 1982 Analogue is playing out with strong precision. For the week ended 3/5/1982, the S&P 500 was down -10.7% in 1982, a hair greater than the 2022 drawdown year-to-date, but following the same path. It wasn’t until the very next week/weeks ahead that the S&P 500 found its correction low for the first half of 1982.
Research Report Excerpt #3

Analyzing the S&P 500 above, we can see that I’ve constructed a “volatility” box. The Volatility box defines the upper bound and lower bound prices, whereby volatility is likely to persist while the S&P 500 maintains price within the volatility box. Recall what we offered in last week’s Research Report, as I defined a probable trading range developing:
“While I was not of the opinion that the lows were in for the year, and since the former low of 4,222, I’m finding it more difficult to believe we haven’t seen an interim low this past week. I remain open-minded to new lows after a 14.5% correction, but with earnings still expected to grow 9-10% in 2022, a trading range from here of 4,114 -4,600 may prove the more likely outcome over the coming months. Over this period of time, it is necessary for stocks to stop going down before they can start going up. Furthermore, the absence of weakness is not a sufficient condition for strength.”
Research Report Excerpt #4
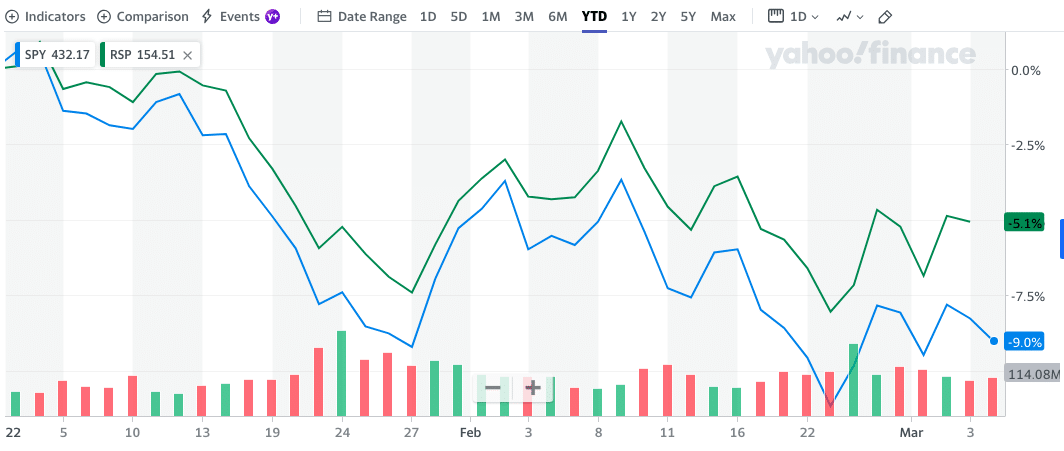
As we can see in the chart of YTD returns for the 2 ETFs below, RSP is down 5.1% while SPY is down 9% year-to-date. Large Cap/Growth is leading the indices lower, and keeping the major averages depressed.
Research Report Excerpt #5
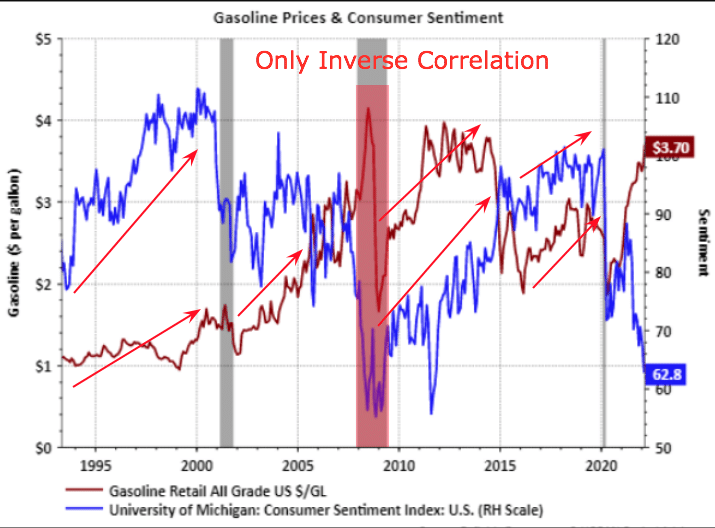
As shown in the chart above, Consumer sentiment does its own thing regardless of rising gasoline prices, since 1995. Most of the time, gasoline prices are rising (red line). Consumer Sentiment, however, is a minefield of peaks and troughs. The arrows identify that even when gasoline prices are rising, Consumer Sentiment is generally doing the same thing. The middle recession bar highlighted was the only time since 1995 that we had gasoline prices rise above $4.00/gallon for the national average and with Consumer Sentiment plunging.
Research Report Excerpt #6
As the chart below shows, worldwide supply chain pressures remain very high (3.3 standard deviations from pre-pandemic normal). About the only good news is that they are down from almost 5 standard deviations (4.5, to be precise) at the end of 2021. Even still, February 2022’s reading is scarcely better than May 2021’s 3.1 standard deviations from the mean.

Research Report Excerpt #7
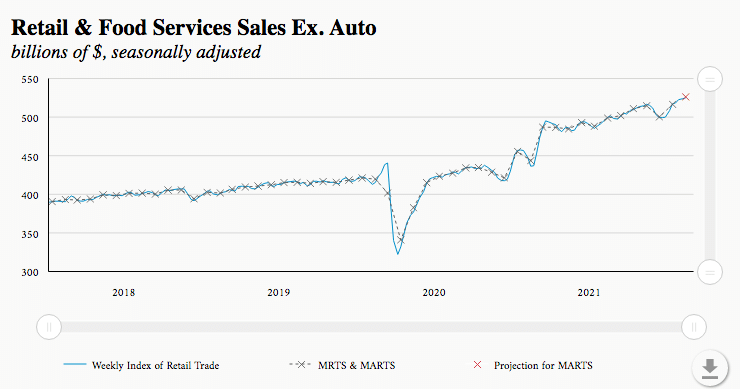
On the consumer front and as we offered in this past Thursday’s State of the Market, the consumer remains in spending mode. In the second week of February, the Weekly Index of Retail Trade increased 0.2% on a seasonally adjusted basis after increasing 0.2% in the previous week, according to the Chicago Fed Advance Retail Trade Summary. For the month of February, retail & food services sales excluding motor vehicles & parts (ex. auto) are projected to increase 1.8% from January on a seasonally adjusted basis and to increase 1.2% when adjusted for inflation.
Research Report Excerpt #8
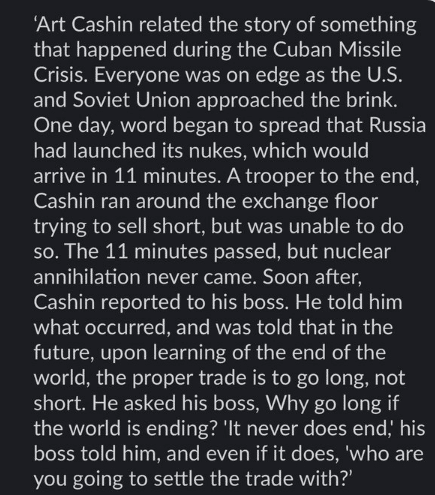
The anecdote depicted above is exactly the point made earlier in this week’s Research Report regarding Armageddon-like fantasies and fears. The difference between now and the Cuban Missile Crisis is that while we may have higher gasoline prices, we don’t have missiles pointed at the United States. Either way, I think the American consumer can handle the former, the higher gasoline prices!
Research Report Excerpt #9
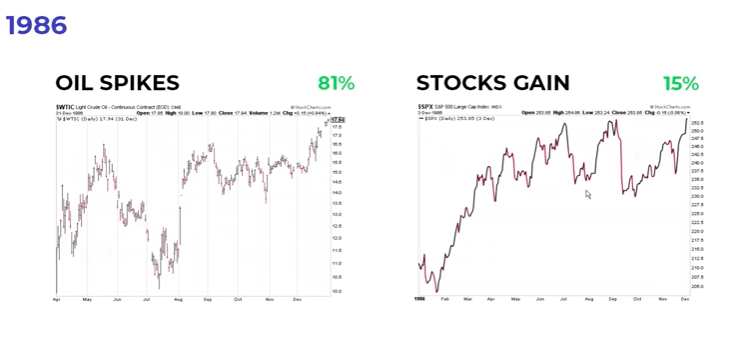
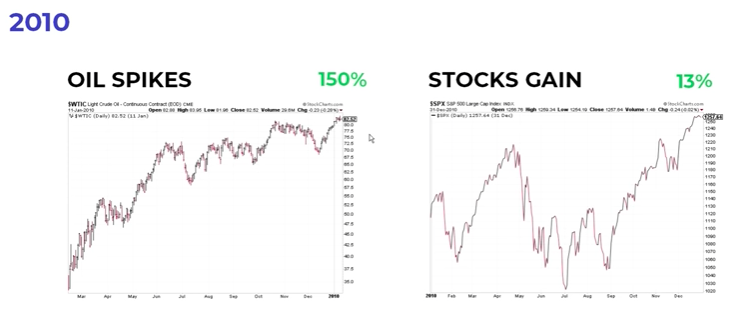
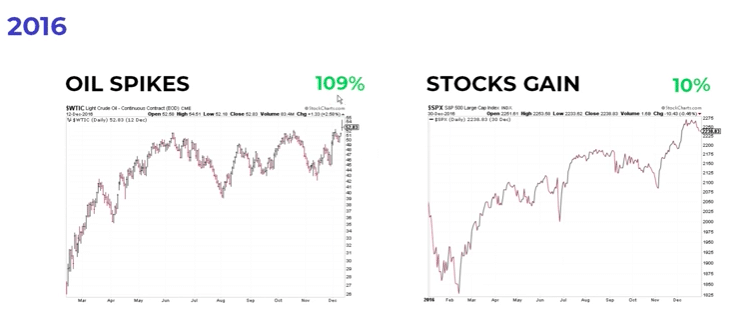
Higher gasoline prices don’t help the economy, so with disseminating the following charts from Chris Ciovacco, it shouldn’t be determined that they do. Having said that, the economy has proven that it can withstand higher gasoline prices in the past and since 1986. The charts below identify oil spikes in the past, which coincide with higher gasoline prices, and the corresponding S&P 500 gains for the year: