
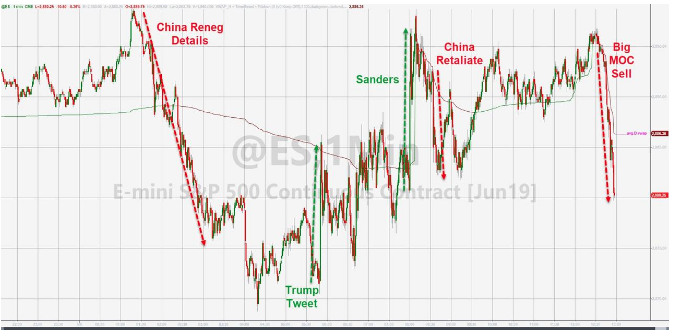
Investors simply aren’t willing to go out on the risk curve with risky assets (stocks) presently and with a very binary outcome anticipated from U.S./China trade talks set to commence Thursday. This was very apparent in Wednesday’s trading activity that was impacted by a series of headlines suggesting that China was arriving in the United States specifically to “make a deal”. China’s Ministries suggesting any further tariff escalations would find a retaliation quickly dulled such headlines. In the late evening, President Donald Trump presented an audience with his case for raising tariffs on the Chinese due to a breach in negotiations that were assumed to be agreed upon in the past. When it was all said and done on Wednesday, the major indices finished relatively flat as investors/traders went to cash. The following chart identifies the wild ride mastered by headlines recently.
An escalating trade spat with China hasn’t hurt U.S. consumers and the economy to-date, but if tariffs are increased this would weigh more heavily on the U.S. economy.
Oxford Economics predicts gross domestic product will grow about 2.2% this year, but it could slow to less than 2% in 2019 if higher tariffs kick in and no deal is reached. Inflation might also rise a bit faster.
The biggest damage, economists say, would result from the heightened uncertainty the standoff creates among businesses and investors. Companies could cut back on investment or struggle to find lower-cost suppliers to replace Chinese partners. And Wall Street would have to gauge the effects of a trade war on the health of the U.S. and global economies. This could have a spiraling effect that lingers.
A new round of tariffs “would likely drag on business confidence and investment,” said Lewis Alexander, chief U.S. economist at Nomura. “The deterioration in equity markets since Trump’s tweet over the weekend highlights that vulnerability.”
Nomura sees a 5% chance U.S.-China trade negotiations completely break down and China is found retaliating. Bank of America Merrill Lynch isn’t as sanguine.
“This is a big deal in our view .. The global econ took a sharp turn to the worse when the US introduced the 10% tariff .. last year. A further escalation from the US and a likely retaliation from China would be a full-blown trade war, .. with very negative implications ..”
While the focus for investors remains with trade talks on Thursday and with Asian stocks taking a beating over night, U.S. investors may be overlooking another concern. The 3-month Treasury and 10-year Treasury are once again on the verge of inverting. (Charts via Bespoke Investment Group)
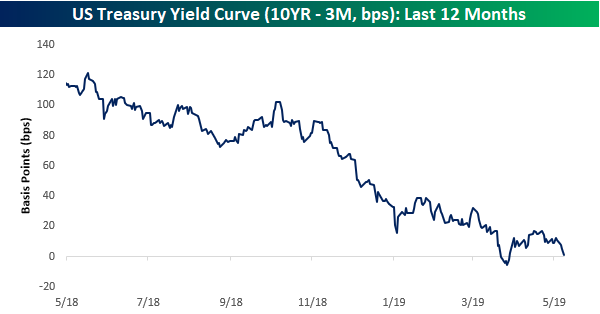
After a 5-day inversion in late March, the yield curve started to steepen again in April. Over the last few days and as markets began to retrace YTD gains, the flattening trend has returned with and as of this morning is just 1.5 bps from inversion again. If that happens, market participants will raise concern over the yield curve even as they contend with an ongoing trade feud. It’s a double-whammy of sorts.
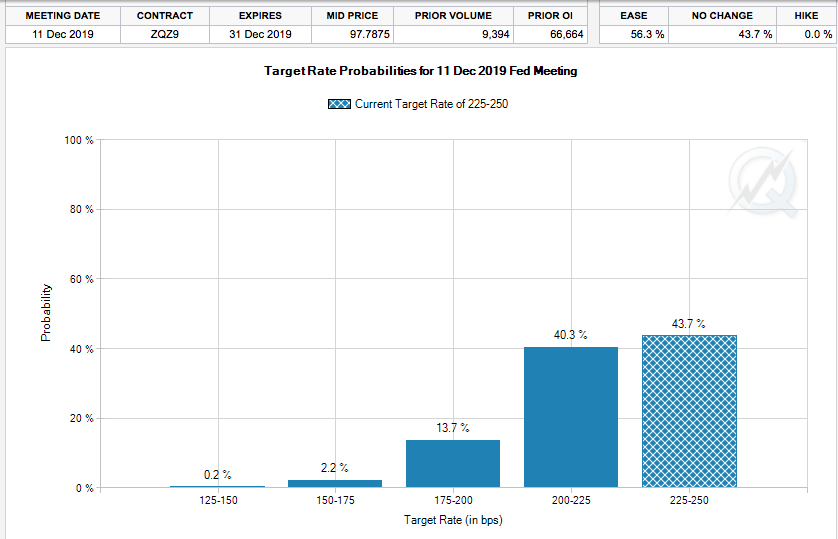
There are already heightening concerns that the Fed will need to cut rates later this year, a yield curve inversion for a 2nd time in 2019 will likely spur the Fed to reconsider such a move that it recently dismissed as being unnecessary at this time. At present, market participants are baking in a greater than 50% probability for a rate cut by year’s end according to the CME’s FedWatch Tool.
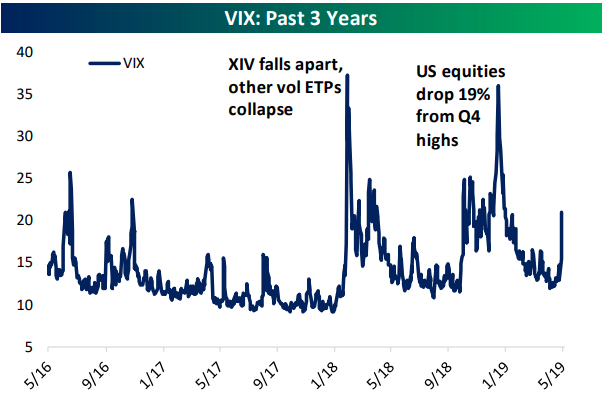
Given the current heightened state of fear in the market, as recognized by the sharp rise in the VIX, we are forced to recognize that investors are hedging their long portfolio positions. This is the third time the VIX has surged over the last 18 months, with the first being a huge uptick relative to a more modest equity price decline than the huge drop in Q4. That first spike was driven by a collapse of products designed to profit from low or falling volatility.
It’s no secret that the 2019 market rally has occurred with very few volatile price swings. For a comparison, significant moves for the main equity benchmarks are still running behind the pace of price swings over the past five years, with the exception of 2017’s market. (See chart below)
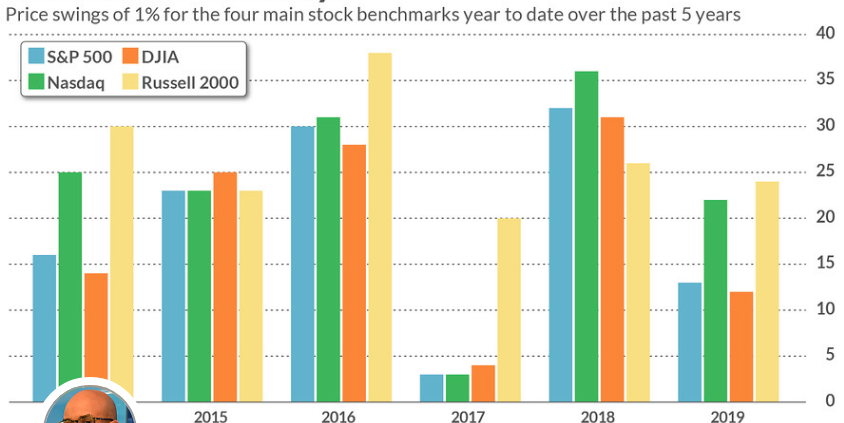
The S&P 500 has registered 13 total swings, nine up days and four down day, of at least 1% this year, compared with 36 such moves to this point in 2018, 31 such swings in 2016, 23 in 2015 and 25 the year before that, on a YTD basis. Only 2017, had fewer sharp moves, with three to this point in May. It is a similar trend for the Nasdaq, with 22 price moves of 1% so far this year, and 12 for the Dow.
With trade talks between the world’s 2 largest economies set to resume today, investors will be anticipating headlines and are already hedging their bets. The VIX is up some 11% in the pre-market hours on Thursday. Good economic data be darned at the moment. The feared future impact from increased tariffs is greater than the economic data that tends to be delivered with hindsight. With that being said and with investors still curtailing market exposure, Jeff deGraaf, founder of Renaissance Macro Research says rising policy uncertainty usually marks a buying opportunity, though current levels aren’t yet high enough to be considered bullish. “With volatility spiking around trade, there is little to do other than assessing where opportunities versus dangers lie,” he wrote in a Wednesday note to clients.
Policy uncertainty would trigger a bullish signal if it reaches high enough levels, as measured by the Economic Policy Uncertainty index, composed by economists Scott Baker, Nick Bloom, and Steven Davis. But deGraaf wrote, “Policy uncertainty hasn’t actually reached bullish levels yet.”
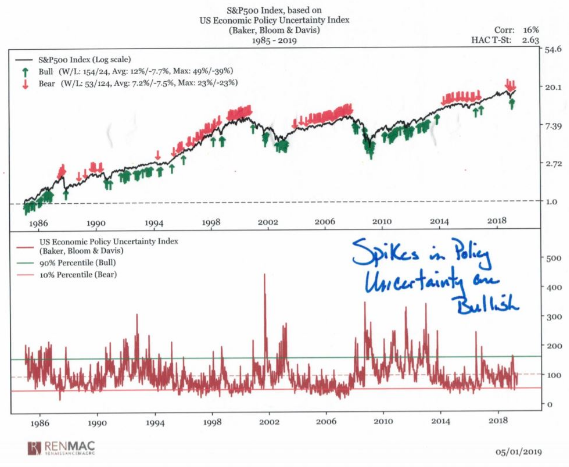
According to deGraaf’s analysis, when policy uncertainty rises above the 90th percentile, or a reading of 167.8, the S&P 500 tends to rise in value, and when it is in the 10th percentile, or 71.1 and below, that is a bearish indicator for stocks. In April, the economic policy index printed a reading of 109.3, after spending three of the previous four months at levels in the 90th percentile.
Sharing a similar sentiment with deGraaf, CNBC’s Jim Cramer also suggests that while near term fears are scorching equity markets, “this too shall pass”.
Cramer says that the noise surrounding tariffs may prove to be just that, noise. Furthermore, Cramer suggests that if the tariffs are raised and the markets decline further through Friday, the bull will return next Tuesday. Cramer recommends raising cash to benefit from any future stock market decline. The following bullet points outline Cramer’s thoughts on the potential for tariffs and markets.
- The Chinese need a deal more than we do.
- A deal may still be on the table that delivers a stay of execution on the higher tariffs.
- If tariffs are raised, this will prove to find markets dropping sharply.
- The President may quickly change his policy to safeguard markets and the economy.
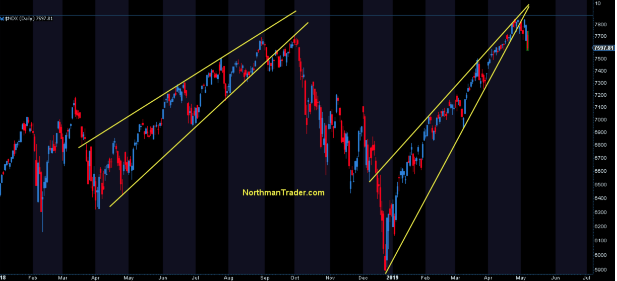
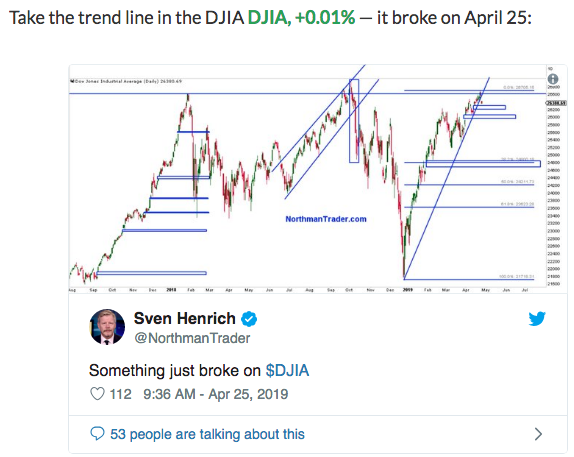
In sharp contrast to the more optimistic tone from Jim Cramer and Jeff deGraaf, Sven Henrich states that “the 2019 uptrend is shattered.”
“China trade concerns may be the trigger, but as I always say: Technicals paint a picture of things to come, and when things line up, markets will find a trigger to confirm the technical picture.”
While Henrich’s statement on technicals is completely illogical and insists technicals operate in a vacuum, absent fundamental genesis, he of course contradicts his statement by pointing to a fundamental, geopolitical variable. That tends to be the inherent fault of technical based trading analysis. Nonetheless, Henrich points to several index charts that have displayed rising wedge patterns in his bearish narrative, which is nothing new given his permabear presence in social media and within his articulations about the U.S. economy for greater than 10 years.
Henrich is due for a win as most of his narratives are found with great error, but the fly in the proverbial ointment could prove to be a positive outcome from trade talks. He points to this toward the end of his latest missive.
“As I mentioned at the outset, a turnaround on the China trade deal could produce a major relief rally at any moment. But clearly markets are rattled, and success is not guaranteed either.
Hence, further downside risk must be considered as well, especially since the patterns above have a lot of room to go lower should markets turn in earnest. While the VIX is getting short-term overbought, ES suggests risk of a repeat of February 2018 and October 2018”
Finom Group expects Thursday’s trading activity to somewhat mirror that of Wednesday’s end result, but with potentially more downside as investors scurry to the sidelines in the late afternoon. There is also an expectation that as hedging proliferates during the day, the VIX should remain elevated, thus pushing up certain VIX Exchange-traded products (UVXY, TVIX, VXXB). While VIX futures have seen a record short number of holdings, as reported by the CFTC, the VIX-ETPs have a very different Vega paradigm presently.
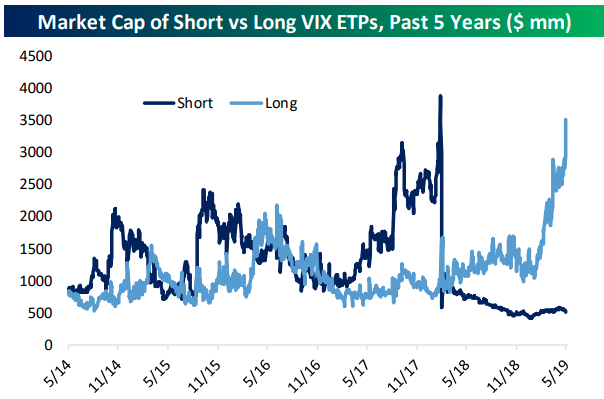
VIX-ETPs that are very long volatility presently. In 2017, a huge short position had built up via these ETPs and as the short-VOL trade became widely popular, with a VIX short market cap of almost $4bn while the long volatility ETPs had a combined market cap of less than $1bn.
Now, the market cap imbalance is completely the opposite: short-VOL products have only about $500mm in market cap while long-VOL products are higher than $3.5bn.
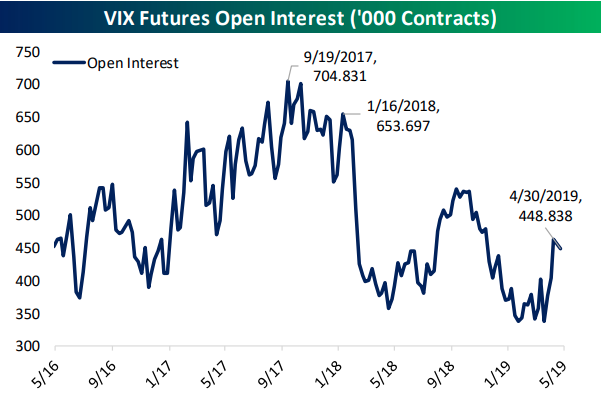
Additionally, total VIX futures exposure has fallen dramatically. Back in September of 2017, there were more than 704,000 VIX futures open, with more than 650,000 outstanding in mid-January of 2018. Today, that number is 36% below the peak and 31% below where things stood in January of 2018. So not only are retail traders positioned the opposite way, total market size and therefore exposure to the VIX has dropped severely.
While none of this positioning exonerates a substantial rise in VIX-ETPs during a volatility spike, it does limit that potential rise given the limited duration that defines VIX spikes.


