

Research Report Excerpt #1
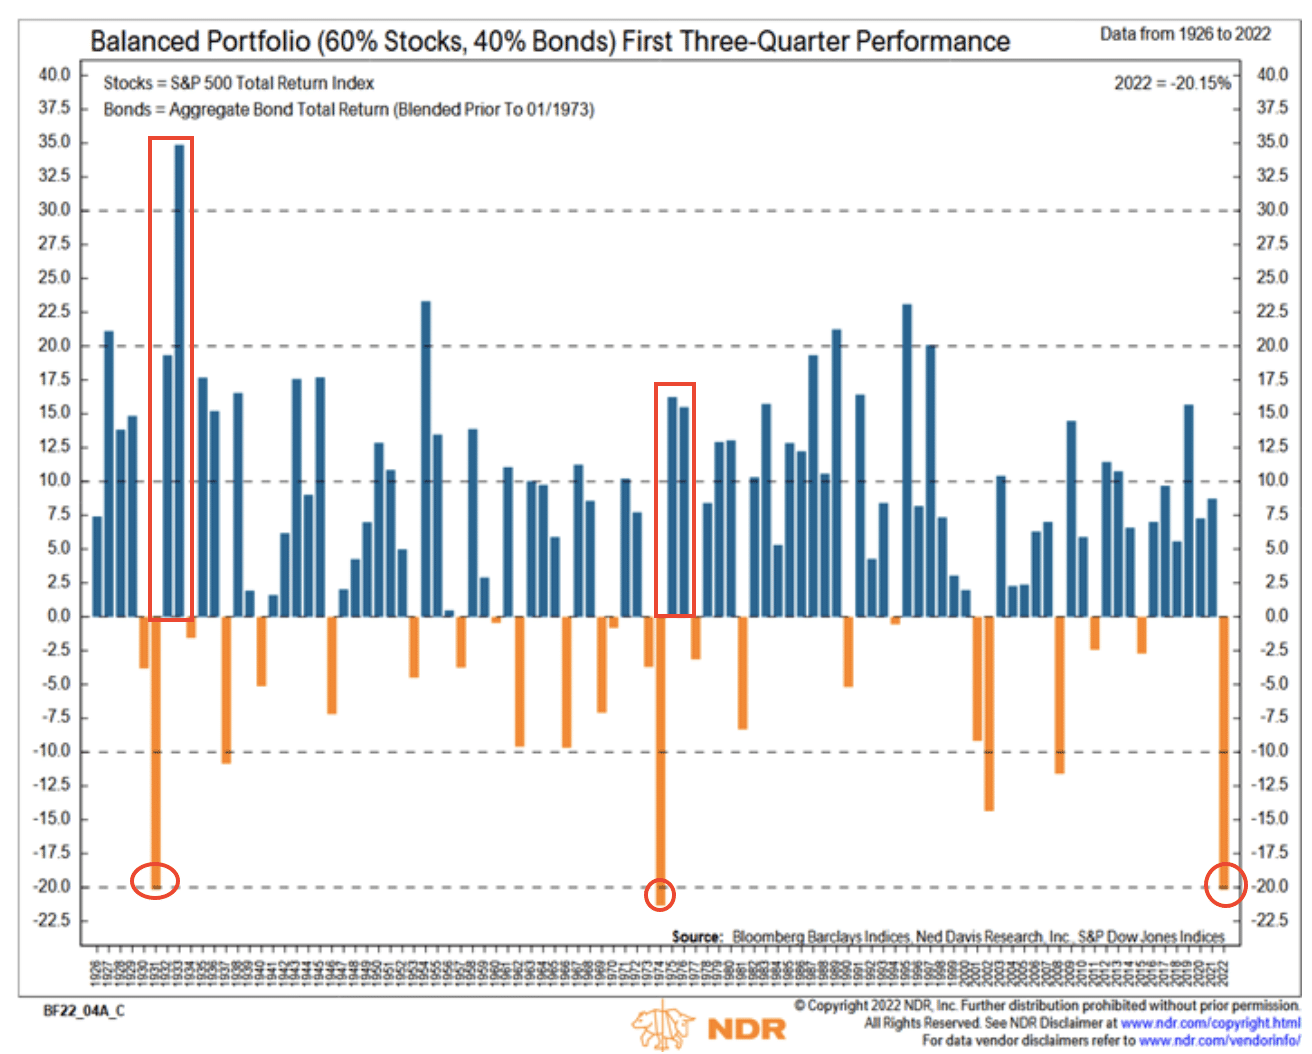
Year-to-date through Q3 had been the worst start for a 60/40 portfolio since 1974, which was also an inflation and Fed hiking regime. However, as detailed in the Ned Davis Research chart below, following the other 2 drops below -20%, the 60/40 portfolio then evidenced strong gains for the next 2 years. MAXIMUM OPPORTUNITY DRAWS EVER-CLOSER!
Research Report Excerpt #2
Through 198-trading days and over 250 calendar days, this is the 4th worst start to a market year and the worst since 2008. The S&P 500 (SPX) is down roughly -25%, the Dow Jones Industrial Average (DJIA) is down roughly -19%, and the Nasdaq Composite (COMPQ) is down the most, at roughly -34 percent. (Charlie Bilello)
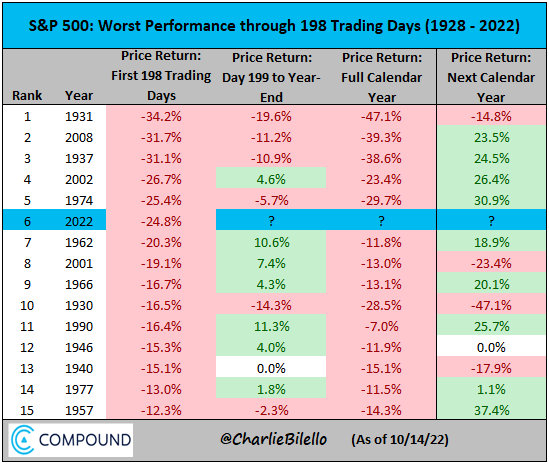
- 1931 (Great Depression)
- 2008 (Global Financial Crisis/Recession)
- 1937 (Recession)
- 2002 (Bursting of dot-com bubble/Recession in ’01)
- 1974 (High Inflation/Recession)
The table above from Charlie Bilello outlines the markets’ YTD performances likeness in each of the prior worst 5 starts to a calendar year. In the bullet points we can determine that each of those market years coincided with a recession, which is still not present in 2022, despite the punditry suggesting otherwise.
Research Report Excerpt #3
What’s being promoted lately in the financial media is that, at this stage of the bear market, it’s too late to sell and it’s time to think about buying, for the long-term gains ahead. Why is this being promoted? It is likely because it is too late to be a net-seller, given the already protracted bear market and declines ranging 20-34% across the major averages. But the idea is also likely being promoted because that is what is occurring, continued net selling action amongst investors.
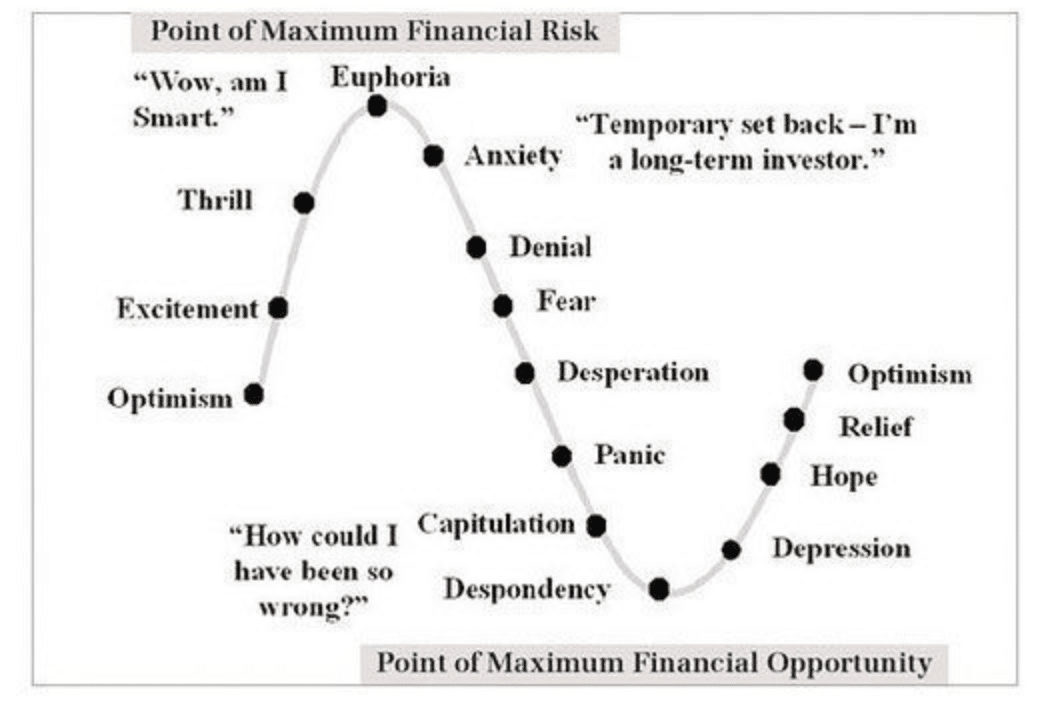
Investors are reaching ever closer to those climactic levels that usually result in the Point of Maximum Opportunity, as demonstrated in the investor Emotion Quotient cycle chart above.
Research Report Excerpt #4
For the first time in 2 years, U.S. consumers expect home prices to fall over the next 12 months. And for the first time since the pandemic, as of September, home prices did fall on a month-to-month basis.
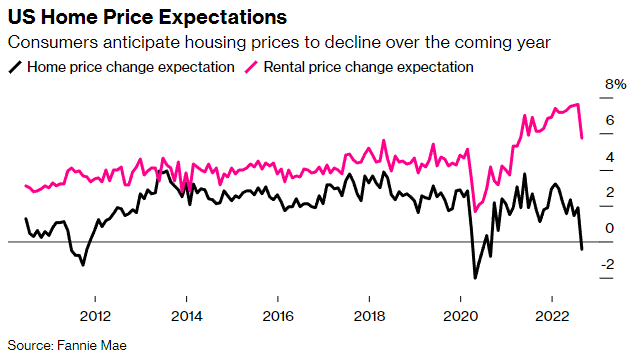
Home prices did indeed begin to decline in July. They fell -0.77% from June to July, the first monthly fall in nearly 3 years, according to Black Knight, a mortgage software, data and analytics firm. While the drop may seem small, it is the largest single-month decline in prices since January 2011. Black Knight then reported the second straight month of declines in August, with prices down -0.98% from July.
Research Report Excerpt #5
Month-over-month saw rents up 0.8%, after a string of 0.6% to 0.7% prints. The catch is we’ve seen some private measures of rents slowing down considerably, with the Apartment List national rent report showing a 0.2% drop in prices in September for the first time this year, while Redfin shows Rental prices down for the last 3 months.
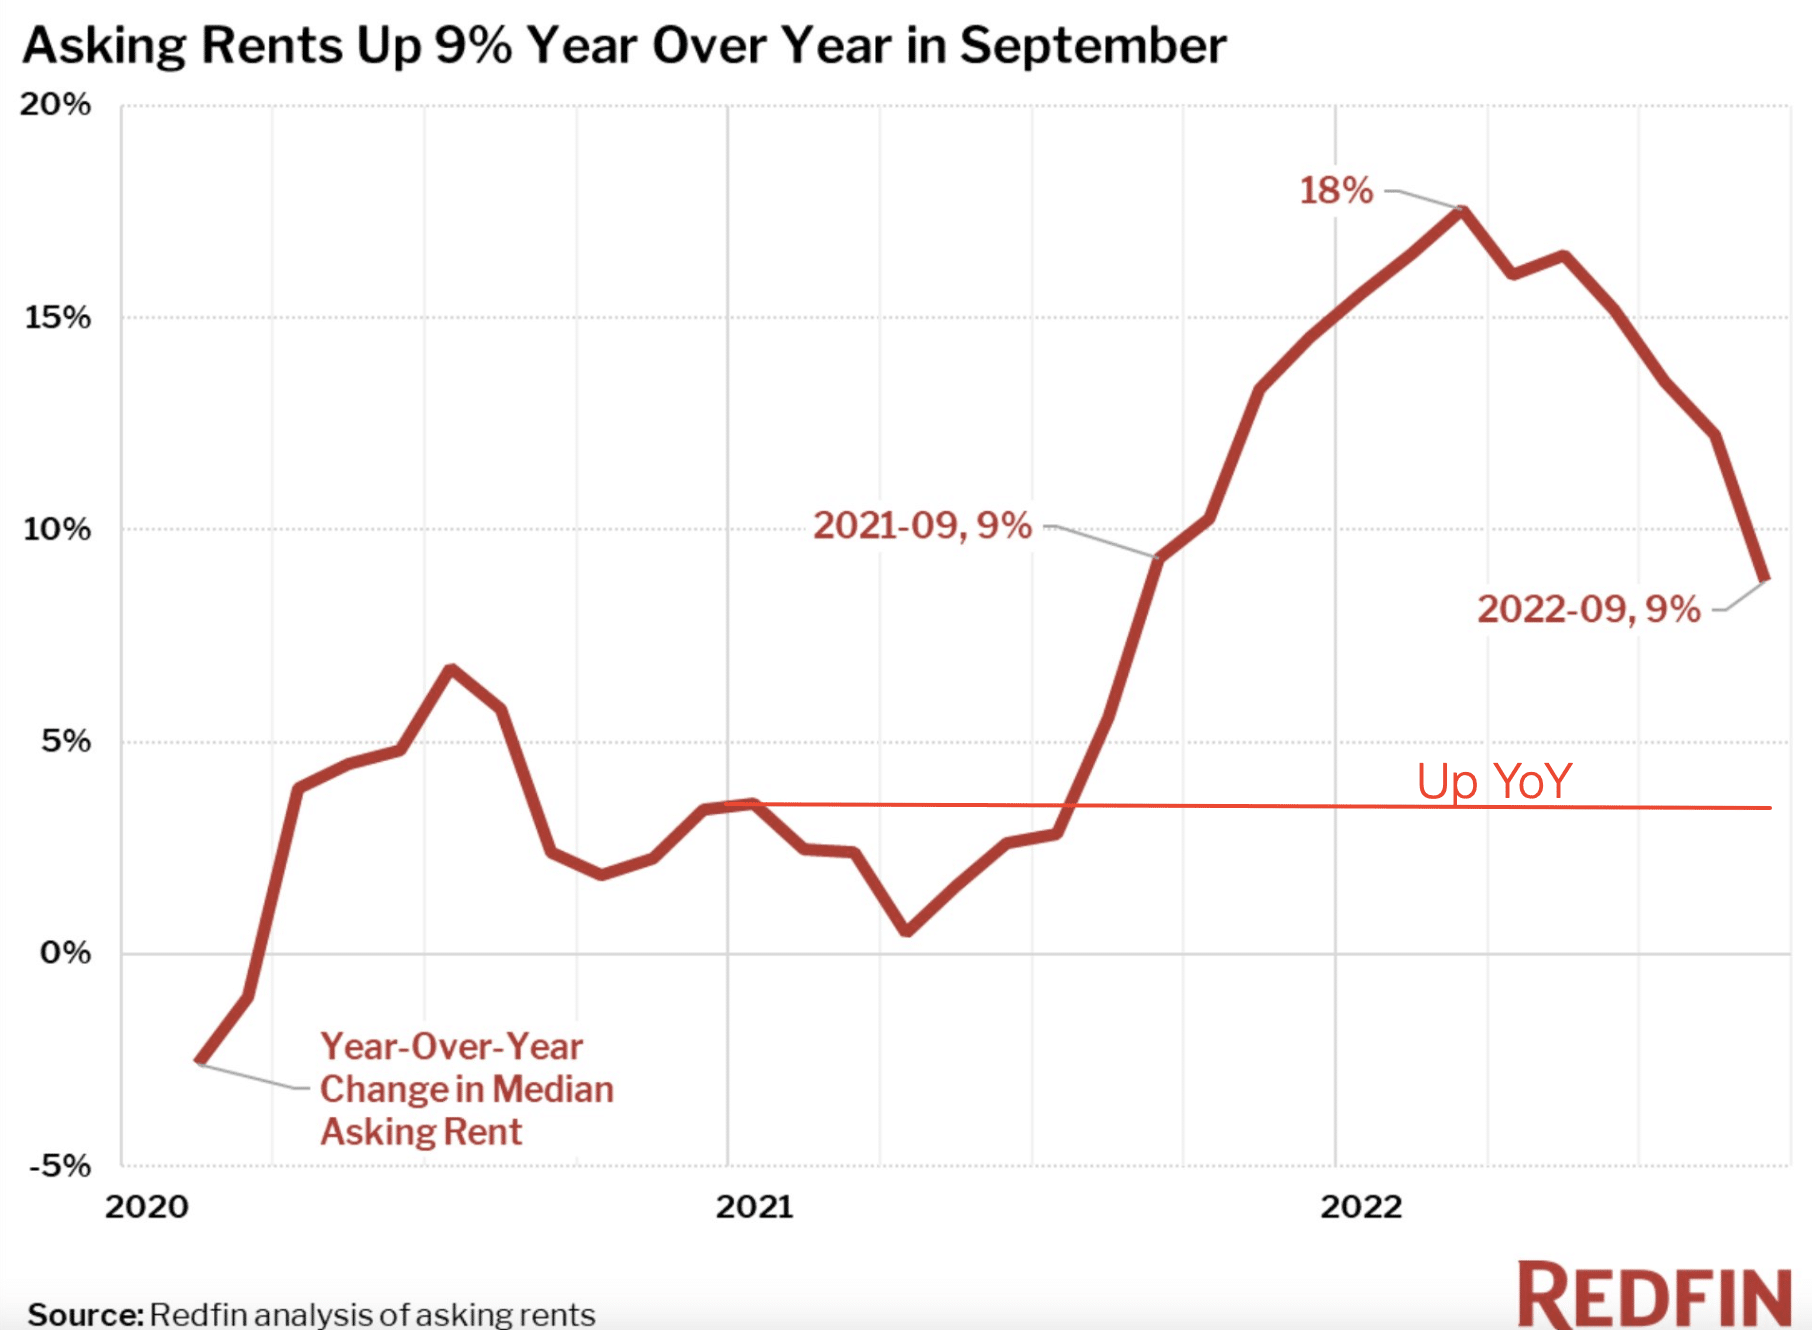
How can this be? The government says one thing, but private measures say another? Remember, the government looks at both existing and new leases, while private indices consider just new leases. Also, for the official data, rental units are sampled only every 6 months (given rents aren’t re-negotiated very often). For this reason, we expect CPI rental measurements to lag private indices by about 4-7 months.
Research Report Excerpt #6
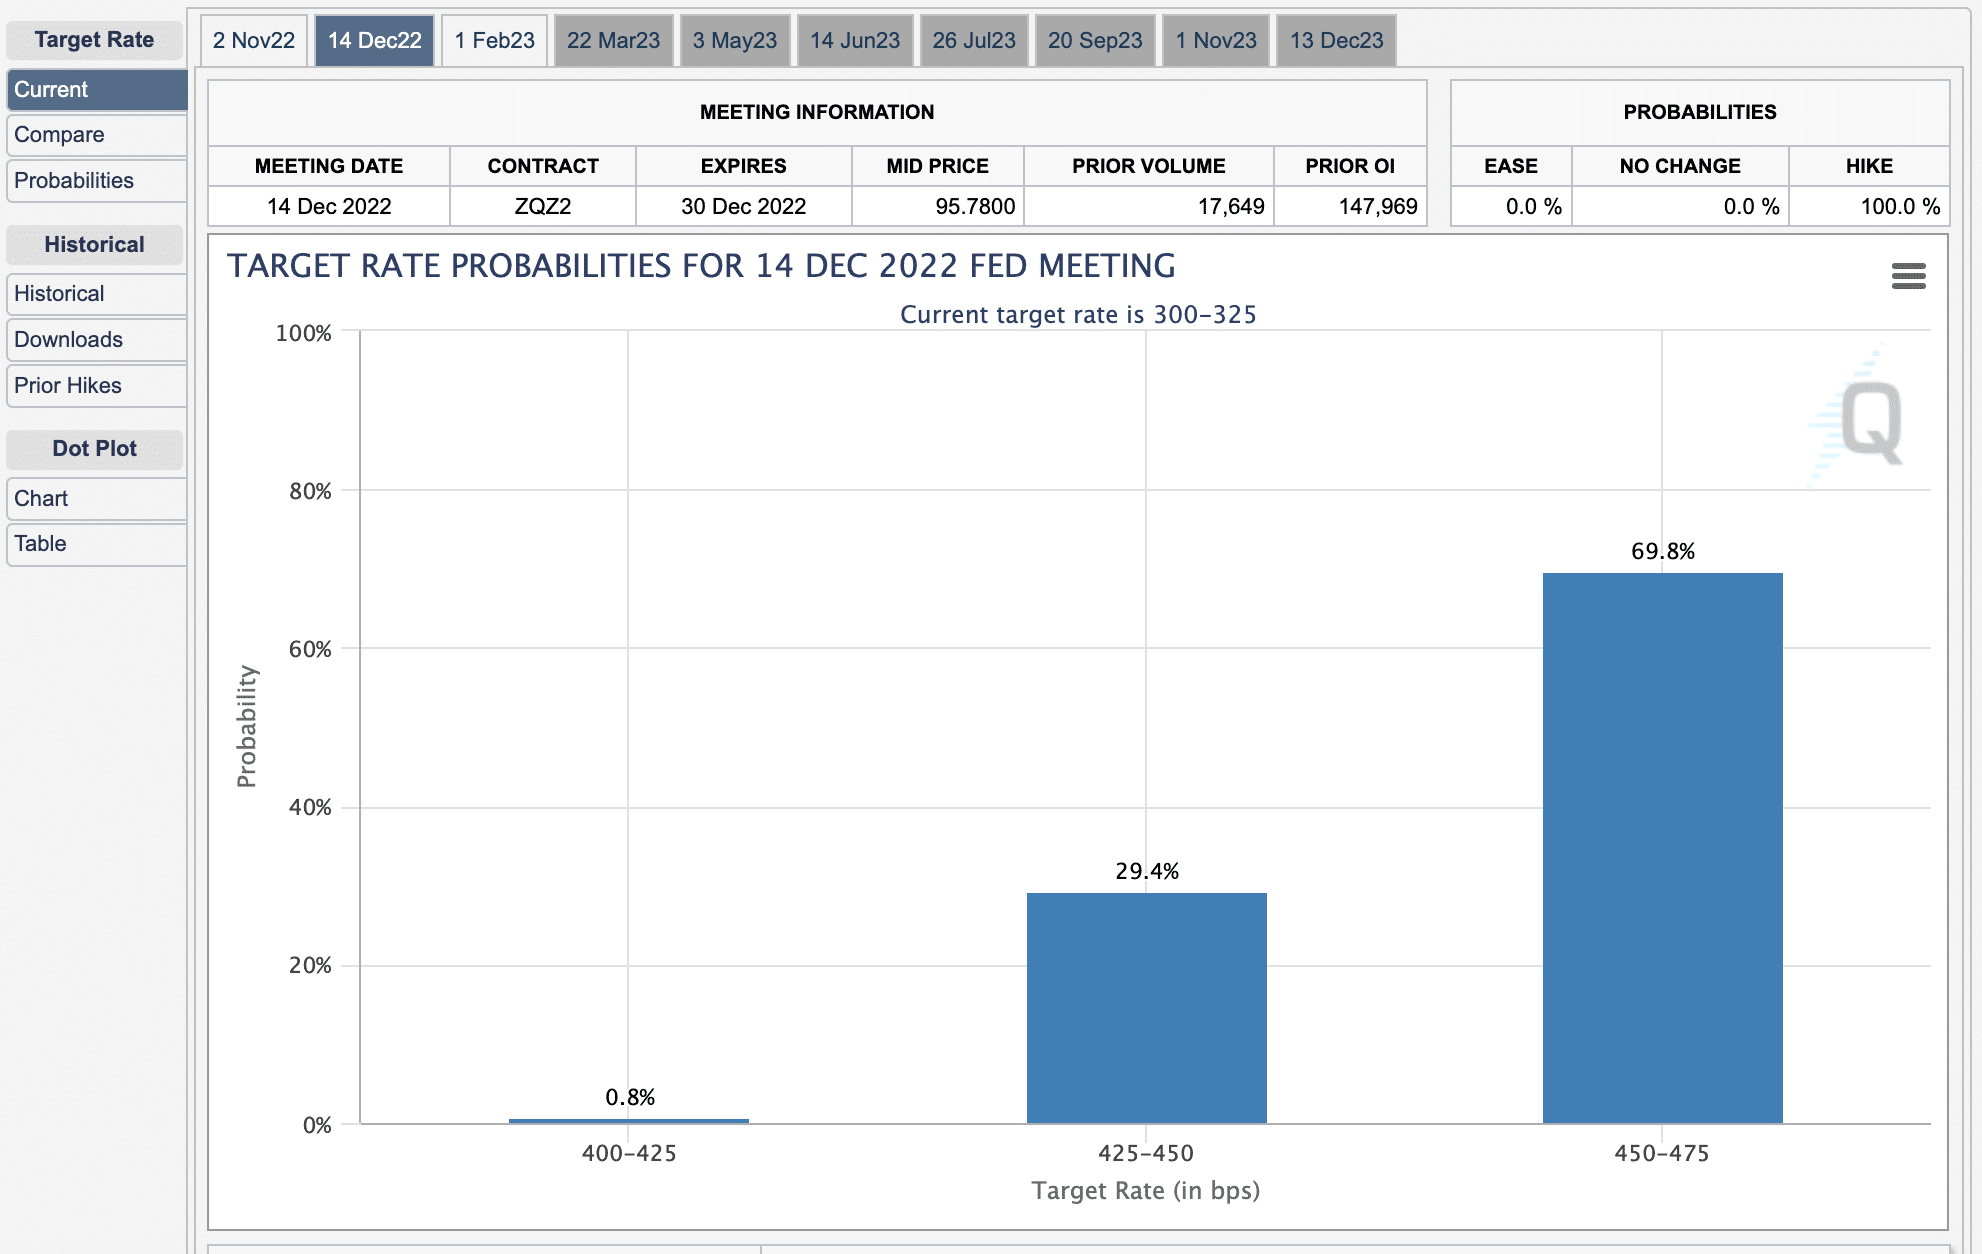
The former path of rate hikes assumed a 75bps hike at the upcoming November 2, 2022 FOMC meeting and 50bps at the December 14, 2022 FOMC meeting, for which the market had already priced, found lower-lows… yada yada yada. As we can see in the Fed Fund Futures chart above (CME FedWatch Tool), however, is that there is now a greater probability of a 75bps rate hike at the December meeting, rather than a 50bps. This shifts the projection for the Terminal Fed Fund Rate from 4.4% to 4.75 percent, hence equity and bond markets further de-rated, and found even lower-lows this past week. Yes, if something materializes to suggest that inflation is finally showing itself to decline more rapidly or the economy itself is slowing, these projections for the Terminal Fed Fund Rate can edge back lower, but until then the Fed is driving markets, as each passing month seems to price an even higher Terminal Fed Fund Rate.
Research Report Excerpt #7
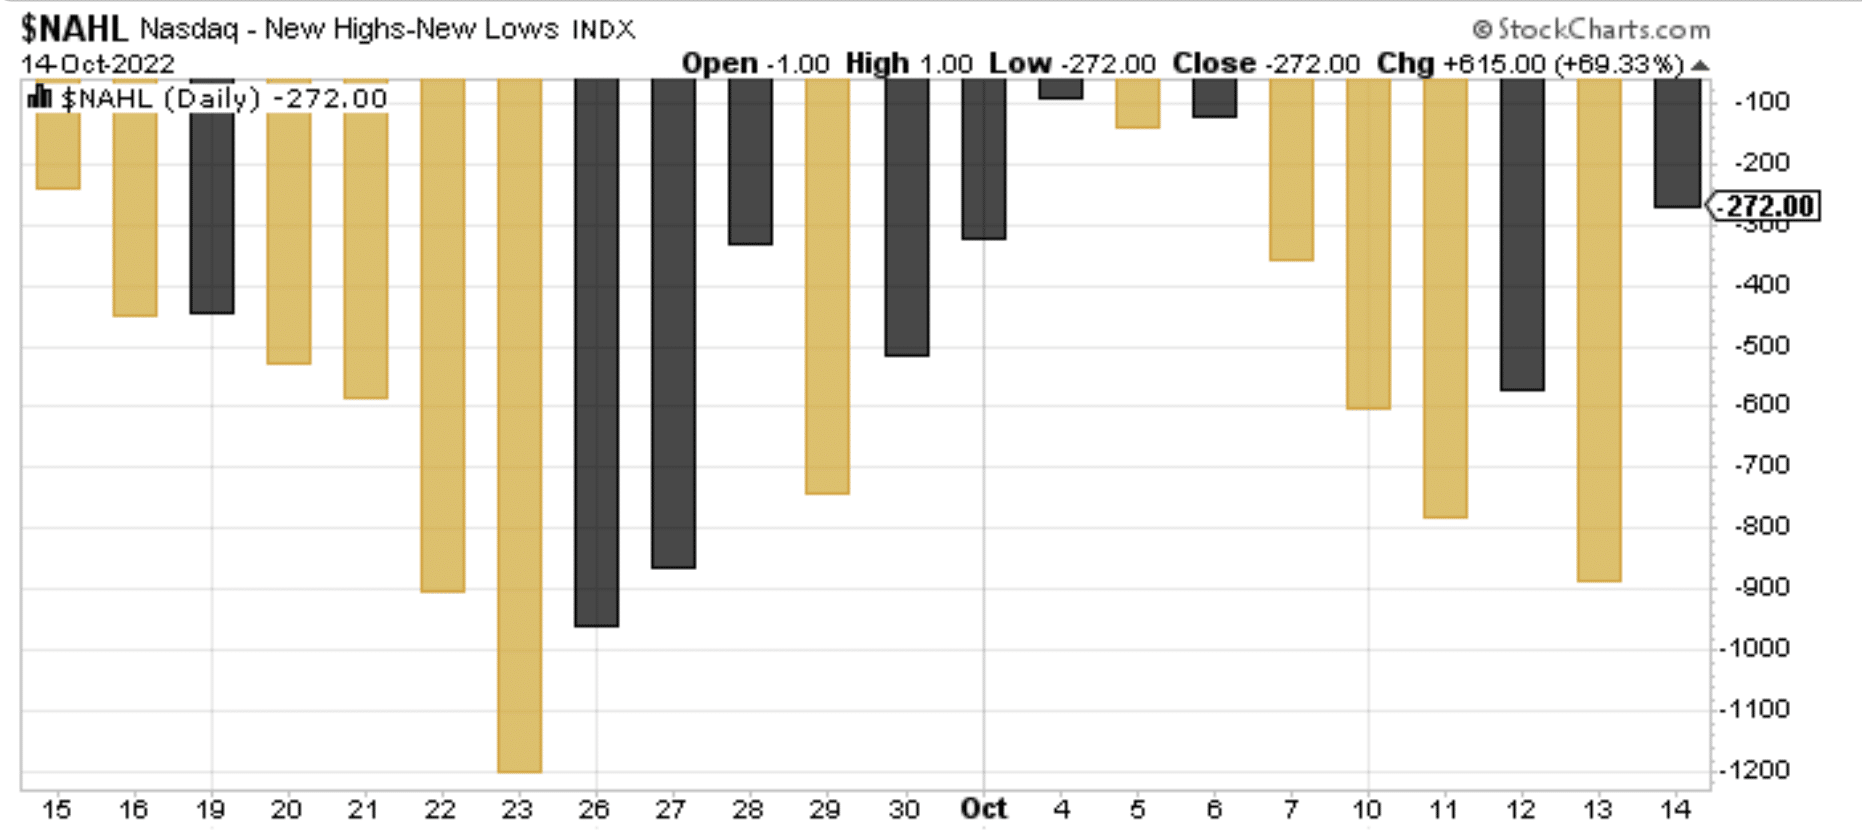
Recall that the market was down Monday, Tuesday and Wednesday, before Thursday’s outside reversal day. With Friday’s lower closing low for the week and lowest closing low, Nasdaq Net New Highs was greater than any day of the week. This divergence in breadth is not what I would want to see as a market bear, as it suggests the market is finding lower-lows without as many stocks finding lower-lows. In cap-weighted indices such as the S&P 500 and Nasdaq, we would need to see positive reactions to Q3 earnings in those more heavily weighted stocks to find a bounce in markets, as smaller weighted stocks within the indices are not able to drive the indices higher even with this breadth divergence. The setup for a bounce is clearly defined in all 3 charts analyzed, but the fundamentals will determine outcomes through earnings season.
Research Report Excerpt #8
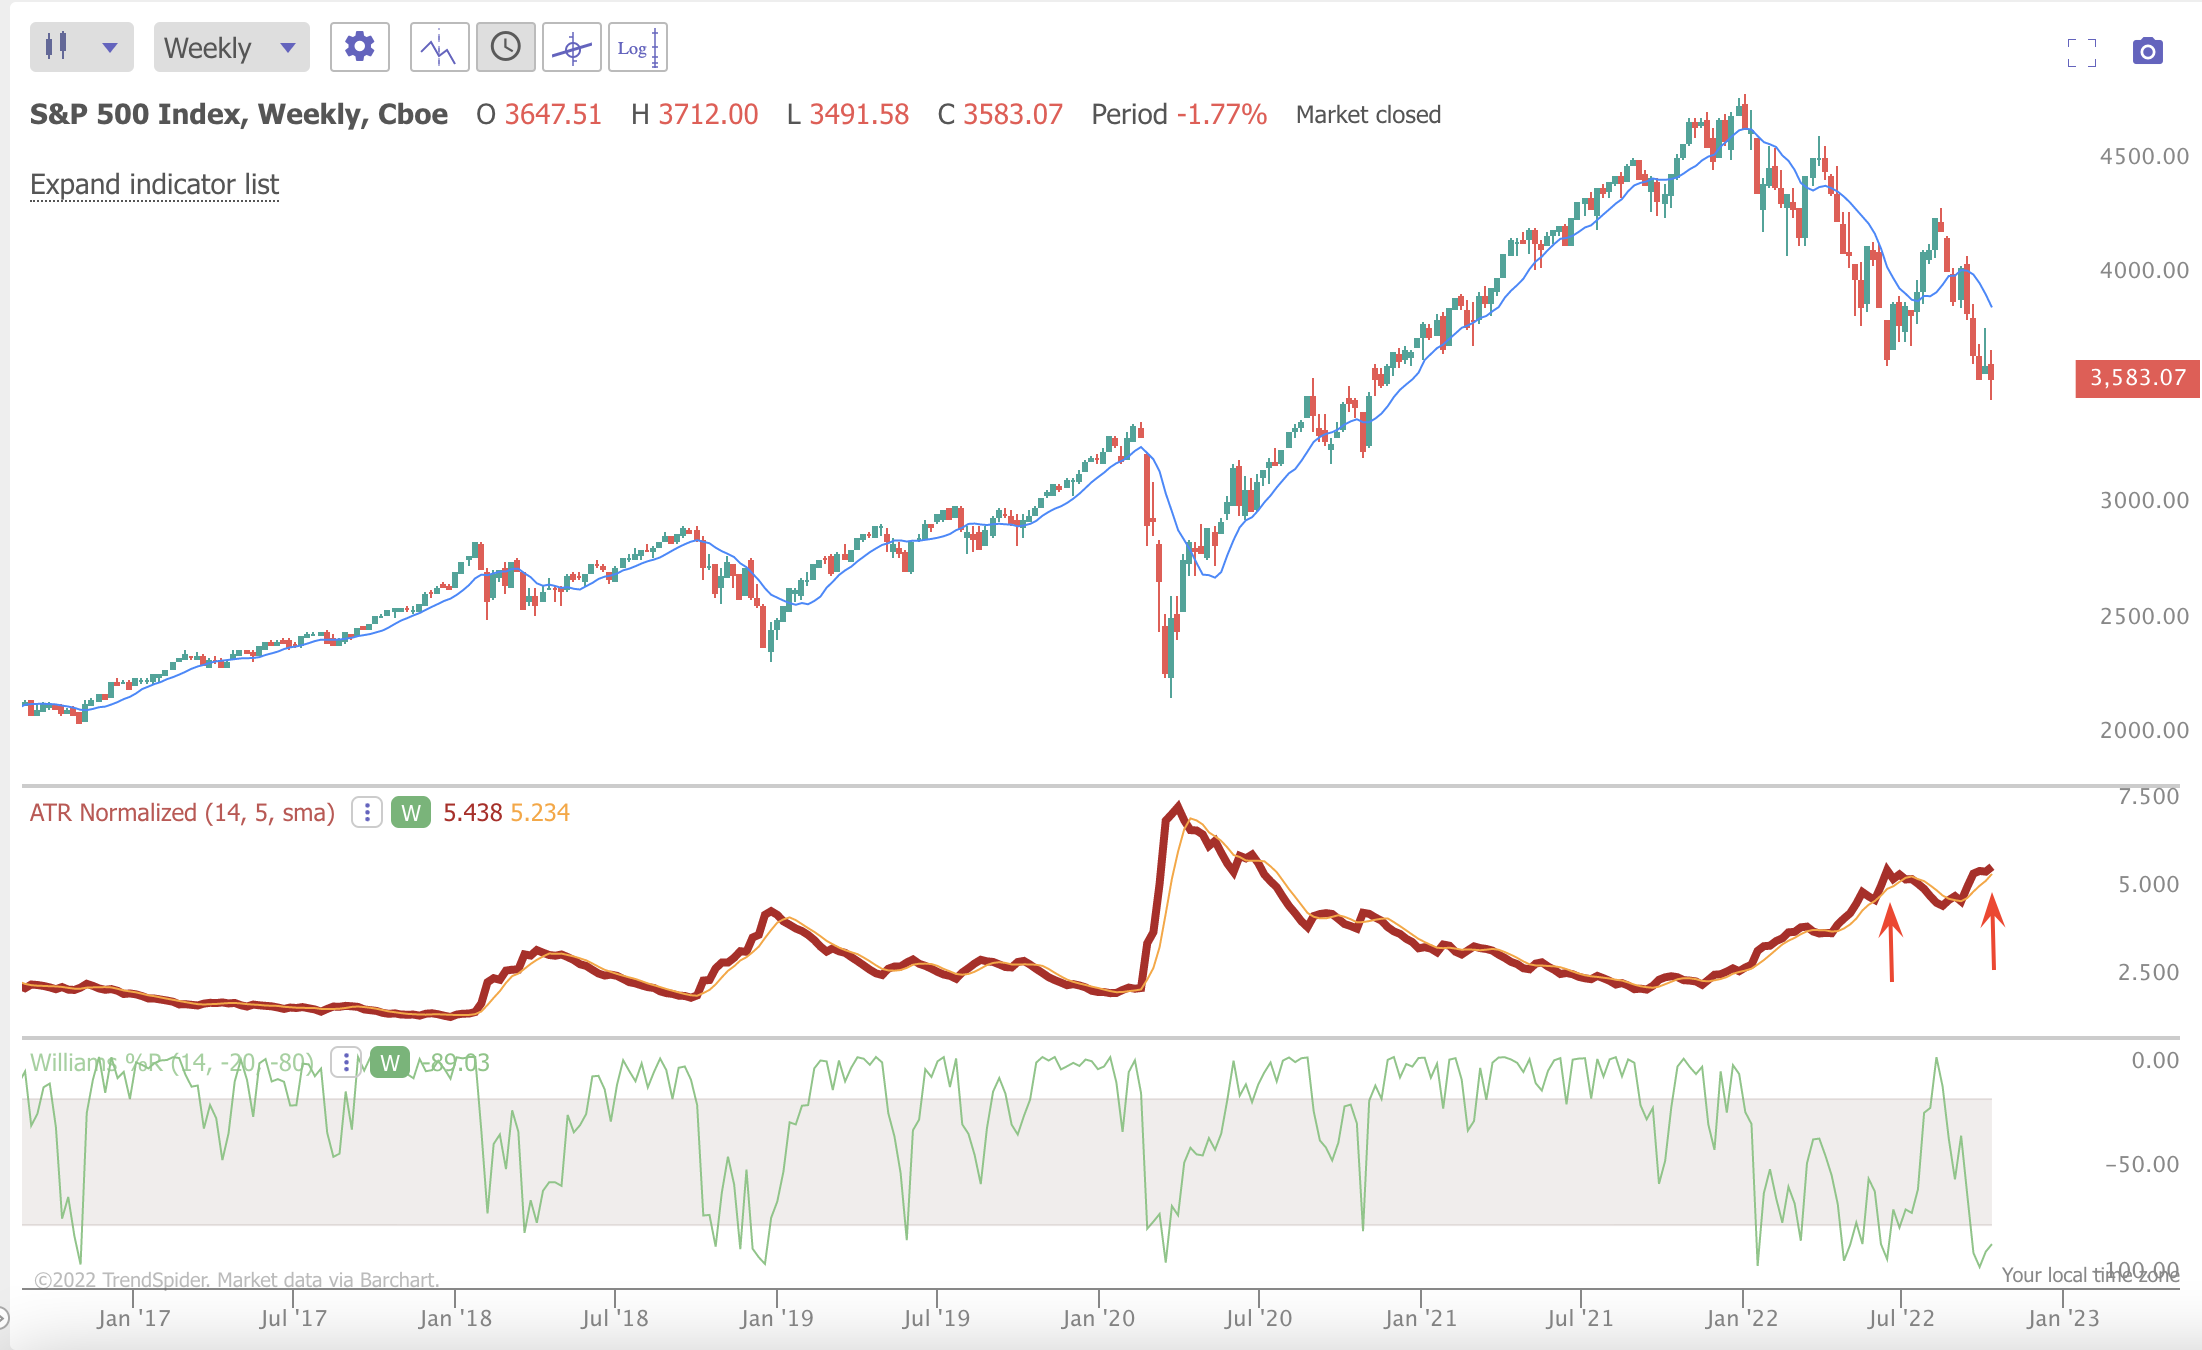
The weekly reading of the Williams %R and Average True Range Normalized (ATR) have achieved the same reading as demonstrated during the June 2022 market lows. If we think back to this week’s price action, indeed, there were wide ranging trading days for price action. As such the ATR went back to the year’s high. Again, this may be pointing to the current cyclical bear market type of capitulatory price action, which admittendly doesn’t reflect that of past capitulatory price action i.e. pandemic lows in 2020. The elevated level of the ATR and depressed levels in the Williams %R, nonetheless, have historically represented a value opportunity for investors.
Research Report Excerpt #9
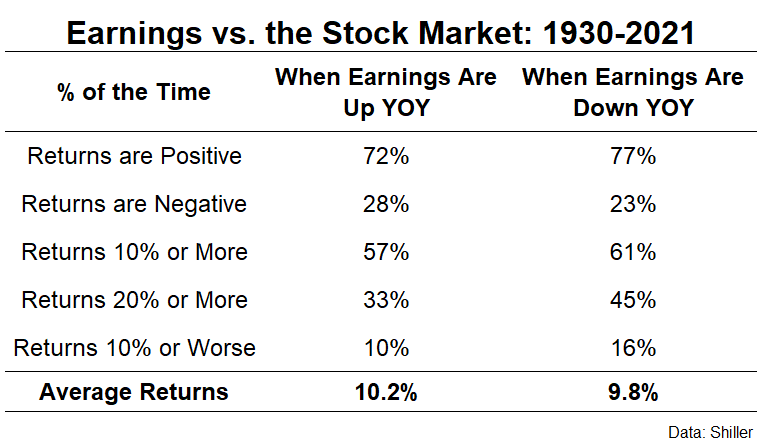
Over the last 90+ years, the stock market has been more likely to see positive returns, double-digit returns, and up years of 20% or more when earnings are down from one year to the next. People don’t often appreciate the fact that investing carries an intrinsic belief in earnings growth, and if that earnings growth doesn’t appear in the interim, the belief is that it will ultimately appear.


