

Research Report Excerpt #1

After a 3rd straight weekly decline in the major averages, the AAII investor sentiment fell back to one of the lowest Bullish readings in history, only trumped by the lows seen this past June. Headlines reinforced the fear that investors have felt throughout 2022, and the price action has mirrored the wild ride investor sentiment has taken.
Research Report Excerpt #2
A bear, what will make me a bear? Someone really asked me this question via Twitter. To me such labels have no merit and no reward. What matters is whether or not an investor has a disciplined strategy and long-term outlook for investing purposes. Labeling someone a bull or bear is another human behavior of categorization that proves natural, but bears no fruit at the end of the day… if that wasn’t a pun…but I digress. Being a market bear requires the following:
- Limiting disciplines
- Limiting duration/time horizons
- Limiting investor probabilities for repeatable profits.
Sorry, but I don’t find any of these to the advantage of a savvy investor. What about famed short seller Jim Chanos, you might ask? Being famous for a torturous career that finds repeatable underperformance is not my idea of succsess. The Kynikos Portfolio that he manages has underperformed the market over the last 12 years, up roughly 87% with the market up more than 200 percent.
Research Report Excerpt #3
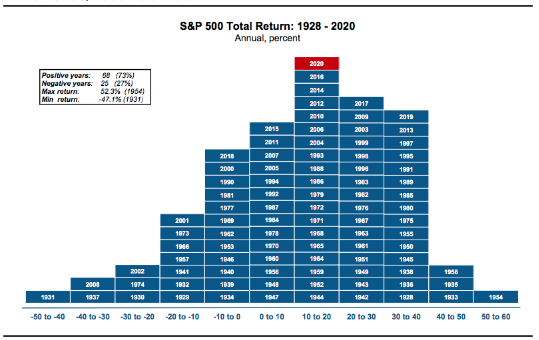
One way or the other, and there are only 3 ways, the market finds new highs: 1) Structural rebalancing 2) Earnings growth 3) Multiple expansion. Many of you have seen the Bank of America S&P 500 annual return pyramid chart above, denoting the annual percentage returns since 1928. Hard to believe, but the market is historically higher 75% of all years (including 2021). Secondly, the market is up between 10% and 20% more often than any other annual return percentage.
Research Report Excerpt #4
In the past, we identified the technical differences betwen today and both 2001 and 2008:
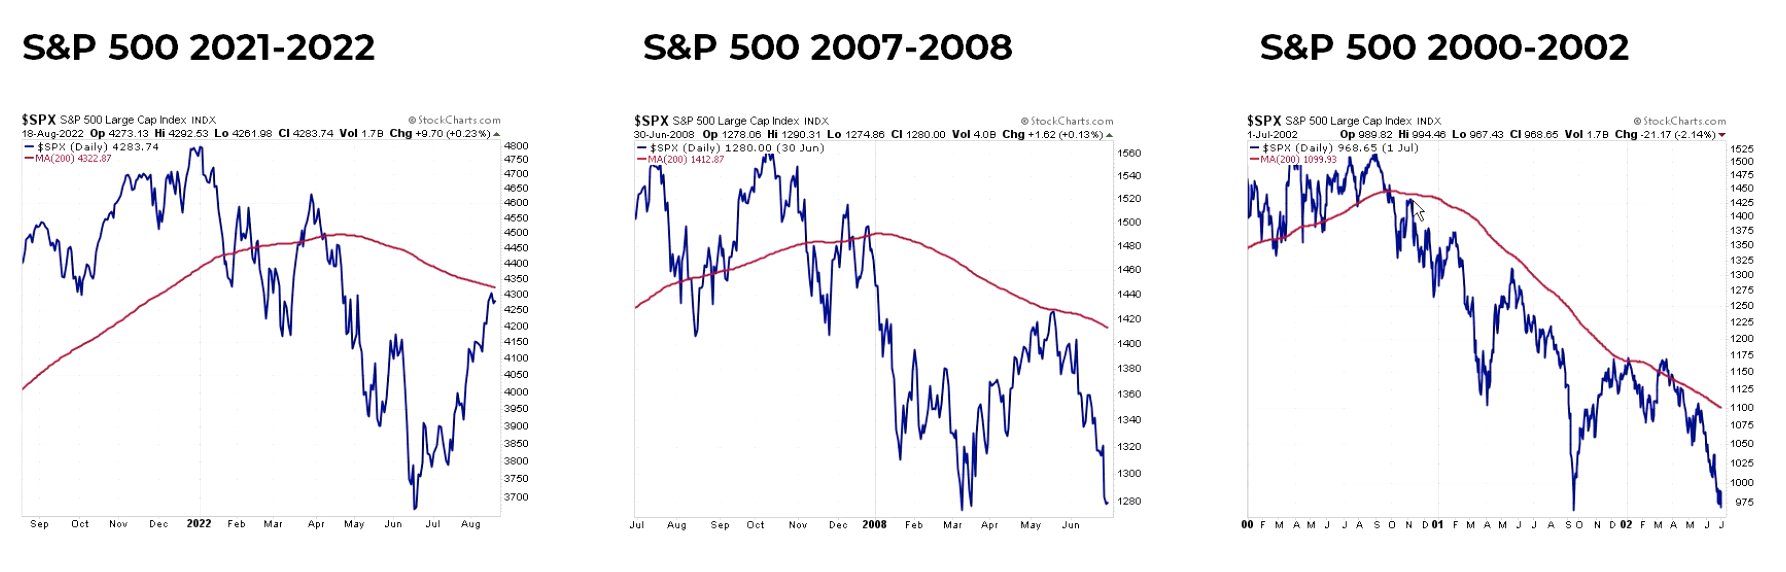
The charts above (from Chris Ciovacco) highlight failed attempts to rise above the 200-DMA in all 3 examples, including 2022. Nonetheless, there’s really no likeness between the former years and the present day. So what about the interim moving average, the 50-DMA for these analogues?
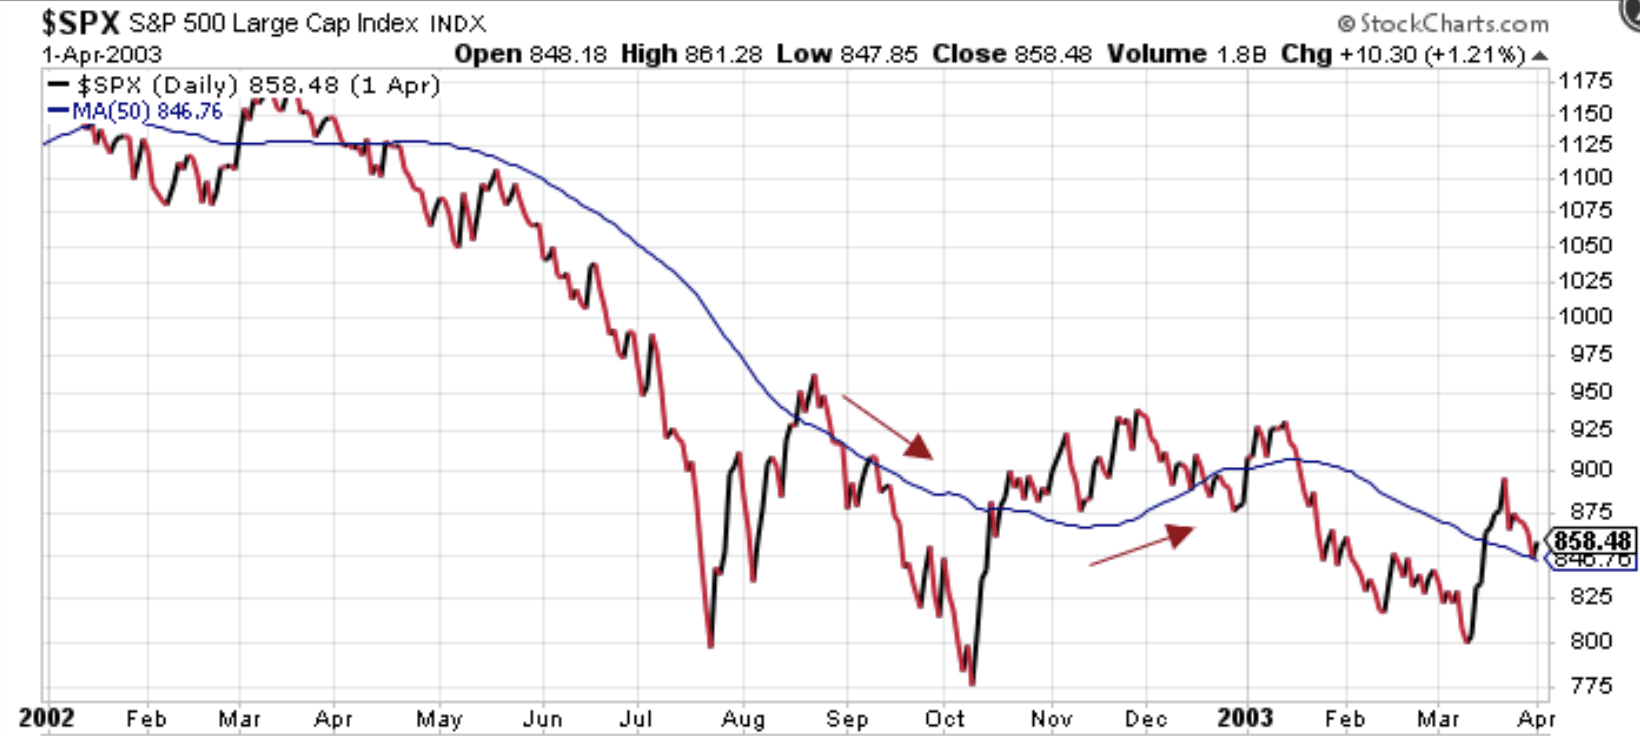
We know that the bottom of the Dotcom/9-11 bear market cycle was October of 2002. Indeed, in 2002 the S&P 500 got its sea legs, but that didn’t mean there wasn’t some choppiness thereafter. A key to determining the strength or weakness of the interim trend can often be determined by the slope of the 50-DMA. As we can see in the 2002-2003 chart above, while the S&P 500 managed to poke its head above the 50-DMA briely in August, the September swoon hit harder as the 50-DMA was still downward sloping. Investors/traders would have proven savvy to heed the September seasonality as well as recognizing the rally from July was not strong enough to revert the 50-DMA upward. That didn’t occur until November, but when it did it had also signaled the lows were achieved in October 2002. Now let’s look at 2008.
- A key difference with respect to the 50-DMA analysis and the 2002 price performance is that in 2002, while the index did test price levels above the 50-DMA, at no point did 90% of stocks trade above their 50-DMA.

Research Report Excerpt #5

As discussed in this past week’s State of the Market, the relative performance of the Consumer Discretionary sector (XLY) and the S&P 500 (SPY) has suggested that the recent 3-week skid in the market was not macr0-fundamentally driven. Investors weren’t overly concerned about the economy. If they were, they would likely be selling the Consumer Discretionary stocks faster or as fast as they were selling the S&P 500. Consumer Discretionary purchases are not the purchases consumers generally make when there is fear of a pending recession. With all that being said, we can see that XLY:SPY has continued to ouperform, breaking above the August highs to close the week. The RSI is also a healthy 66 percent.
Research Report Excerpt #6
The Institute of Supply Management (ISM) released the August Services Purchasing Managers’ Index (PMI). The headline Composite Index is at 56.9% and is up 0.2 from 56.7% last month. The reported number came in above the Investing.com forecast of 55.1 percent.

The Business Activity Index registered 60.9%, an increase of 1 percentage point compared to the reading of 59.9% in July. The New Orders Index figure of 61.8% is 1.9 percentage points higher than the July reading of 59.9 percent. On to the labor market data of relevance, jobless claims…
Research Report Excerpt #7
Market participants have often heard that higher gasoline and food prices have forced the lower-end consumer to reach more frequently for their credit card. Again, the data suggests otherwise.
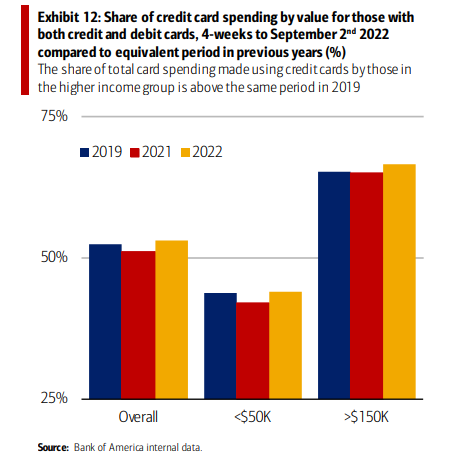
Credit card spending is up a little, but not much. And it’s the upper-income group doing it the most. What we are seeing in the factually evidenced data is a healthy and responsible consumer, again something that we have born witness to since the Great Financial Crisis.
Research Report Excerpt #8
Importantly on the inflation front, the high inflation rates this year will become easier comparisons in 2023. After all, the lower inflation rates last year proved a difficult comparison this year, and more so since the Russia/Ukraine war. The chart below validates the comparisons from one year to the next. (Chart from Larry Williams)
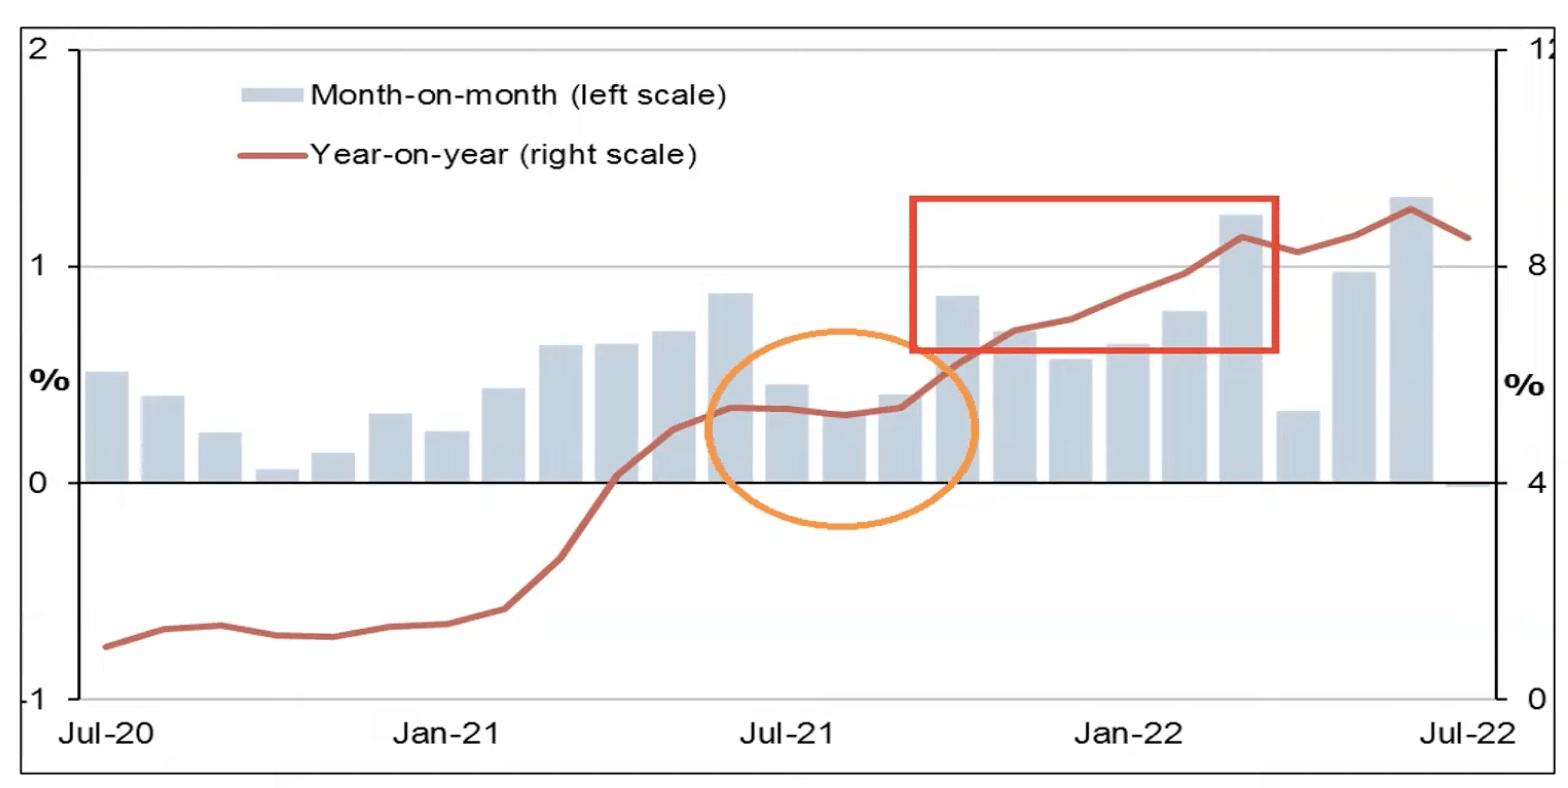
During the lean summer months in 2021 (circled), CPI comps were low. In 2022, we can see that the CPI comps proved a major headwind (rectangle), coupled with the war. Come the same time periods in 2023, the high CPI comps will prove a much easier to show heavy disinflation, keeping in mind that inflation is not 8%+, but the rate of change is 8%+ today.
Research Report Excerpt #9
As I mentioned before, Fed policy is no more cemented than are my feelings about vegatables. I will not order them or cook them myself, but if you provide me data suggesting my body is nutrient difficient and that certain vegatables will provide sustanance, I will choke them down every now and again  . NO promises! If the Fed sees data suggesting a disinflationary cycle is sustainable into 2023, we will likely see the Fed pivot. What does a Fed pivot mean or look like?
” A Fed pivot does not mean the Fed has to reverse rate hikes, it can take on different forms or reverse differnt postures. Today, the Fed is hiking rates and positioning very hawkish messages with an elevated Fed Fund Target Rate of roughly 4%. As such, a pivot could simply be a removal of hawkish rhetoric and or the supplanting of more conciliatory rhetoric that confirms the disinflationary regime is afoot. We would recognize this to be the initial phase of a Fed pivot, that would then lead to small rate hikes and an eventual pause of rate hikes altogether. Markets will likely pick up on this pivot chronology of events…


