
After a torrid start to the month of June, equities have cooled off a bit with Crude and Brent oil failing to find a solid floor and bond yields seesawing. In fact, even with crude oil falling to $51 recently, the S&P is nowhere near where it was even the last time Crude oil was at $55 a barrel. The last time Crude oil was $55; the S&P 500 was 2,750.
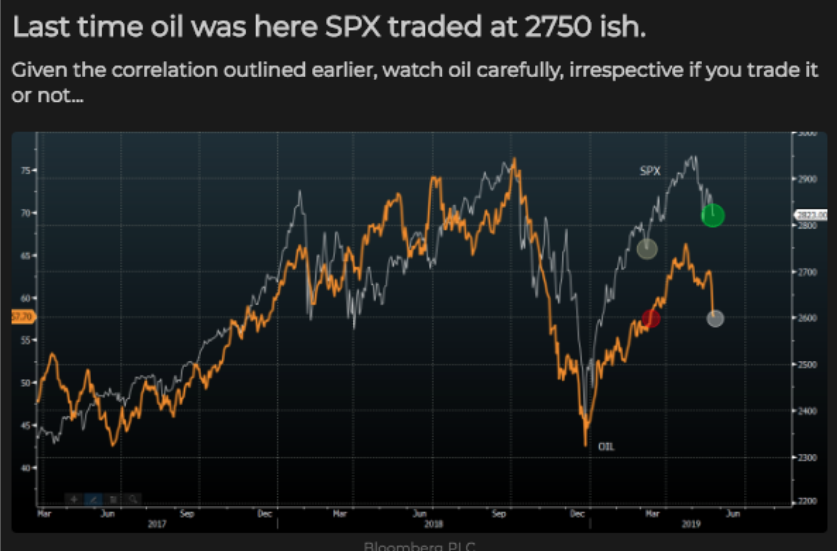
There is obviously a good deal of defiance here being performed by the S&P 500 despite the 6-week long decline in crude oil prices. As we awaken to another trading day however, Crude prices are spiking.

- Tankers the Front Altair and the Kokuka Courageous have sustained significant fire damage and its crews have been evacuated, according to shipping agents.
- U.S. Naval ships in the area are “rendering assistance” after forces in the region received two separate distress calls, according to U.S. officials.
- The cause of the fire remains unclear, but has sparked fears of attack and comes just weeks after alleged ship sabotage in the region.
What caused Crude oil prices continued decline on Wednesday was none other than stockpiles building further. The Energy Information Administration on Wednesday reported that U.S. crude supplies climbed by 2.2 million barrels for the week ended June 7. That marked a second weekly gain in a row. Analysts polled by S&P Global Platts expected a modest increase of 80,000 barrels for crude stocks, on average. The American Petroleum Institute on Tuesday reported a roughly 4.9 million-barrel rise, according to sources. The EIA data also showed that gasoline inventories rose by 800,000 barrels, while distillate stockpiles declined by 1 million barrels last week. The S&P Global Platts survey had shown expectations for a supply decrease of 380,000 barrels for gasoline and a climb of 704,000 barrels for distillate stockpiles.
The Organization of the Petroleum Exporting Countries (OPEC) on Thursday trimmed its forecast for growth in world oil demand this year to 1.14 million barrels a day, down 70,000 barrels from its May estimate of 1.21 million barrels. In its monthly report, OPEC said the revision largely reflected sluggish demand data from developed countries that make up the Organization for Economic Cooperation and Development. OECD countries are expected to see demand rise by 140,000 barrels a day, while non-OECD countries are expected to see growth rise by 1 million barrels a day. Oil demand grew 1.41 million barrels a day in 2018.
We’ve had 3 trading days completed for the week and at least 2 of those trading days are what we like to refer to as throwaway days. Not much happened after the opening of trading on these days and the market traded in a very tight range. After a nice streak of up days for the major averages, the Dow fell for a 2nd consecutive day on Wednesday and looks to recover on Thursday. The Dow Jones Industrial Average (DJIA) ended down 43.68 points, or 0.2%, at 26,004.83, marking its first back-to-back loss this month, while the S&P 500 index (SPX) lost 5.88 points, or 0.2%, to finish at 2,879.84. The Nasdaq Composite Index (NDX) fell 29.85 points, or 0.4%, to 7,792.72.
The major indices seesawed in and out of positive territory on Wednesday before ultimately succumbing to selling pressure. The major averages didn’t, however, finish at their lows of the trading day in part due to the pending “Fed put” deployment. With the Fed put and Trump put in play, markets are seemingly backstopped from significant downside as evidenced by the more simplistic takeaway from the crude-SPX price divergence recently. Remember, the energy sector has the largest EPS swing from 2018-2019. The price per barrel falling into a bear market once again will serve to pressure Q2 EPS results, increasing the probability of a negative earnings season for the S&P 500.
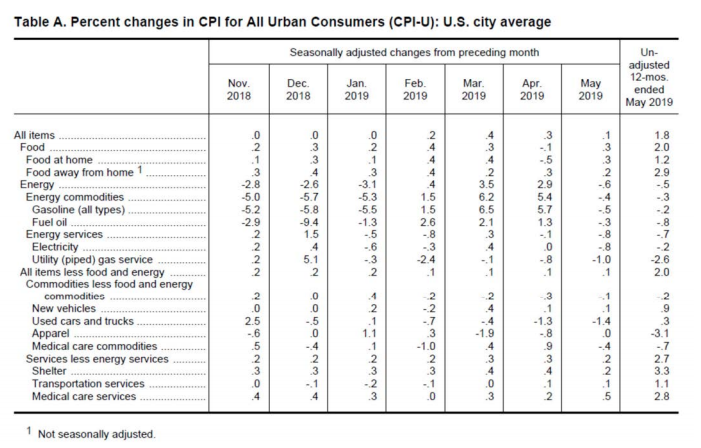
In terms of what brought the Fed put back into the spotlight on Wednesday, Consumer Price Index (CPI). As Finom Group has been offering for quite some time, a failure for the Fed to meet its symmetric inflation target was unlikely. The mere shift in language from “target” to symmetric target was signaling the Fed’s un-comfortability with this aspect of its dual mandate. But to the main point…
The consumer price index rose a scant 0.1% in April, the Bureau of Labor Statistics said Wednesday, matching the MarketWatch forecast. It was the smallest increase since January. More notably, the increase in the cost of living over the past 12 months slowed to 1.8% from 2%. The rate of inflation has tapered off from nearly 3% since last summer. Another closely watched measure of inflation that strips out food and energy also advanced a meager 0.1% last month. The yearly increase in the so-called core rate slipped to 2% from 2.1%, right in line with the Federal Reserve’s target for inflation.
In reviewing the areas where prices continue to decline in the CPI data we come to find that used cars and trucks have seen consistent and accelerating price pressure.
The automotive industry weighs heavily on the economy and with overall automotive sales having peaked recently; price pressure could have an adverse affect on the overall economy in the future. Layoffs in the automotive and industrial goods sectors are way up in 2019 compared to this time last year, according to a report from Challenger, Gray & Christmas Inc., an outplacement and business and executive coaching firm. Through April, the U.S. auto industry saw 19,802 job cuts compared to 6,451 cuts through the same period last year.
Andrew Challenger, vice president of Challenger, Gray & Christmas said companies are slowing down plans to cut workers for the spring and summer months.
“That said, high job cut numbers in the manufacturing and automotive sectors are troubling, as changes in these industries tend to have a trickle-down effect.”
While the issues surrounding used car pricing will not derail the economy, it will prove advantageous to study the ongoing issues, as trade wars have escalated in 2019 and have the potential to escalate further. A strong video that discusses the automotive sector issues on pricing and with respect to job cuts in the automotive industry can be found here, in an interview with Danielle DeMartino Booth.

Moreover, what would a trading day be without recognizing the escalating trade feuds and rhetoric that has pervaded the global economy? More recent commentary and analysis on the outcomes of the trade feuds has been offered by Citigroup’s Mark Schofield and Benjamin Nabarro, in a research report reported dated June 10.
The strategists make the case that a summer recess set to get under way for the U.S. Congress makes policy uncertainty a persistent threat to markets considered risky over the near term. Schofield and Nabarro say the most likely outcome in the international trade scuffles, with the U.S. at the center, is mounting tensions rather than a lessening of trade animosities. That includes the possibility that the U.S. will increase import duties, at least temporarily, on all Chinese imports in a ‘shock-and-awe’ strategy.
“Applying a game theory lens to the problem, one could argue that President Trump is likely to continue to take a hard line,” the analysts said. That could help drive stocks into a bear-market, which is usually defined as a drop of at least 20% from a recent peak.”
Citi analysts anticipate a trio of market outcomes as tariff negotiations progress ahead of the G-20 meeting this month:
Trade deal at G-20
- Stocks soar along with emerging markets as the outlook for the global economy improves, with the S&P 500 index jumping to around 2900
- The 10-year Treasury note yields about 2.5%
- Gold heads to around $1,300 an ounce from current levels
- The U.S. dollar heads slightly lower but capped by lower expectations for Fed rate cuts
No trade deal, nor Fed cut
- Stocks enter a “full-scale bear market.” S&P 500 falls to 2,350
- 10-year heads to 1.5% or lower
- Gold jumps to $1,600
- The dollar jumps against most currency rivals
No trade deal but Fed cuts rates 3/4 of a percentage point
- Stocks hit news highs, but not all stocks and sectors will perform well
- 10-year Treasury note trades at a range of 1.75% to 2% and the yield curve steepens
- Gold heads to $1,500
- U.S. dollar weakens
With a possibly more optimistic tone, J.P. Morgan Chase’s Marko Kolanovic suggests there is at least one major reason to be in equities right now.
“The U.S. economy is facing a quite unique situation in which one individual can disrupt global trade and investment plans of U.S. corporations, tax consumers on a broad range of imports, etc.”
“Given all of this — why are we not bearish on equities and the economy? Because this situation can also be undone on short notice and many market segments already price in worst-case outcomes.”
He notes the recent threat of Mexico tariffs that came and went fast. He thinks a U.S.-China trade deal — logical going into an election year — could reverse about half of the market damage seen so far.
“This would translate into a quick [approximately] 5% rally in broad markets, and a 10-20% rally in value and high beta. As a strong market and avoiding a recession would boost re-election odds, it would only be rational to expect this outcome. By value he means lower-priced stocks that have fallen out of favor, while high beta are viewed as riskier stocks, but can mean bigger reward.”
While Finom Group doesn’t disagree and has even uttered the same thoughts, “what man has done can be undone”, we don’t necessarily believe investors should rush out and increase equity exposure in one fail swoop. With several near-term events on the horizon, the optimal strategy would be a layered approach as follows:
- G-20 Summit meeting between Trump and Xi. If a truce is announced without additional tariff potential over the next 6 months, this would prove an ideal time to add S&P 500 exposure.
- June Nonfarm Payroll report. If a reversion to trend-job growth is found, this would prove an ideal time to add S&P 500 exposure.
- July FOMC 2-day meeting and EXPECTED rate cut! If this comes to fruition and the Fed cuts rates, this would prove an ideal time to add S&P 500 exposure.
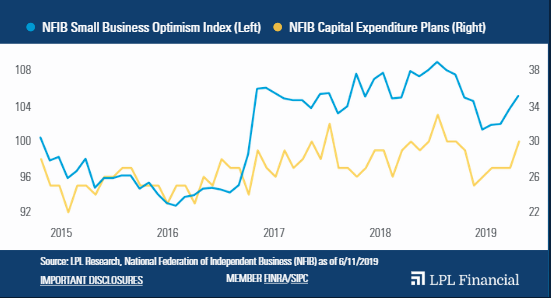
What proved to be a tad askew under the looming trade feud threats that have been ongoing for nearly 18 months is that the NFIB small business sentiment index recently rose during the month of May.
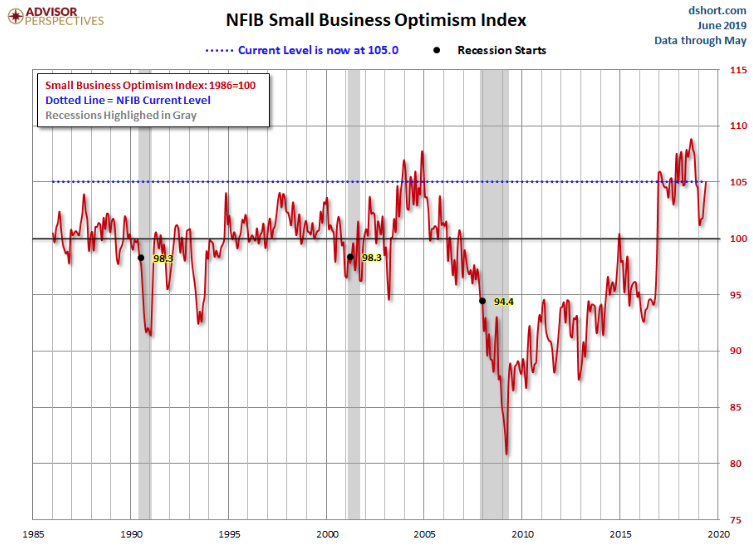
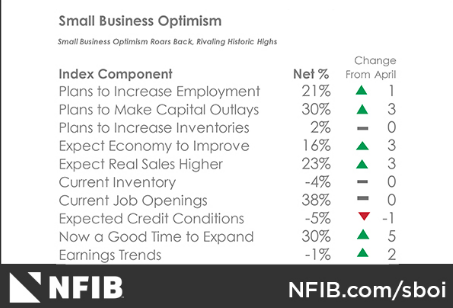
Small business optimism eclipsed pre-shutdown levels, increasing 1.5 points to 105.0 in May. Six components in the Small Business Optimism Index improved, three were unchanged, and one dipped. Capital spending plans increased along with actual outlays. Small business owners’ expectations for sales, business conditions, and expansion all rose, as the previously reported inventory imbalance was resolved. Earnings, job creation, and compensation remained very strong.
We’ll have to see if this was a one-off or if in fact business spending on scale will accelerate after some dormancy in the Q1 period found capital expenditures for S&P 500 companies at their lowest levels since Q4 2017.
And while business sentiment and consumer sentiment have been on the rise of late, investor sentiment has proven to wane through the month of May and into early June. Having said that, the latest AAII survey did show some signs of improving investor sentiment.
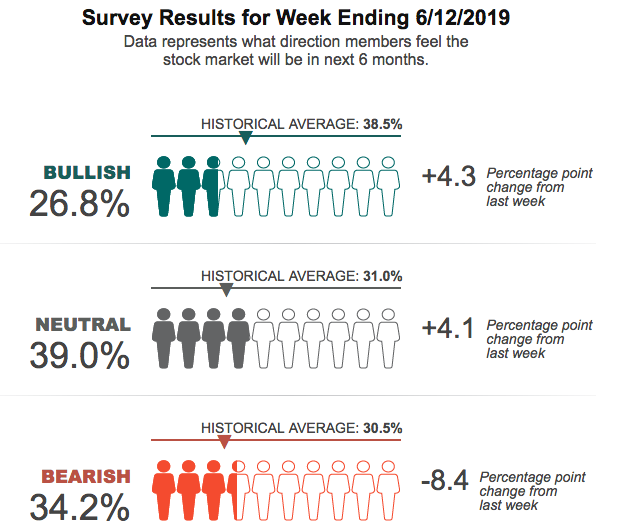
Bullish sentiment increased more than 4 points, but still rests below the historic average. Consequently, bearish sentiment took a sharp move lower, but remains above its historic average.
TD-Ameritrade’s Investor Movement Index also showed an increasing appetite amongst its account holders. TD Ameritrade clients increased exposure to equity markets during the May IMX period, increasing the IMX score by 6.94% to 4.93, up 0.32 from the previous period.
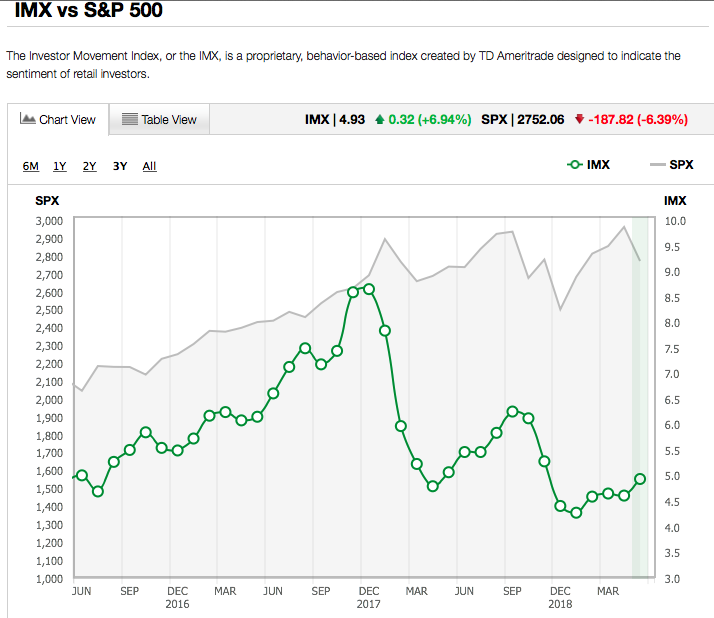
TD Ameritrade clients were net buyers of equities during the period, increasing their exposure to more risky assets. This helped push the IMX score to the highest level in six months. Net buying of equities reached the highest level since last October. Volatility of the S&P 500 also increased, with the S&P 500 registering four straight weeks of declines to end the period.
TD Ameritrade clients appeared hungry for new issues during the period. Recent IPOs UBER Technologies Inc. (UBER), Beyond Meat Inc. (BYND), and Pinterest Inc. (PINS) were all net buys. Both UBER and PINS reported earnings for the first time during the period, with UBER reporting a $1 billion loss and PINS reporting a loss nearly three times larger than expected. BYND increased over 100% since its IPO amid a plant-based meat craze, with TD Ameritrade clients buying on any weakness. Tesla Inc. (TSLA) was a net buy once again as the stock reached the lowest point in two years and is off more than 40% in 2019. The company is attempting to ramp up production in China and pass savings on to customers to spur sales. Occidental Petroleum Corp. (OXY) was a net buy as it announced final terms to acquire Anadarko Petroleum Corp.
Additional popular names bought include Walt Disney Co. (DIS), Canopy Growth Company (CGC), and Microsoft Corp. (MSFT).
Although being net buyers, TD Ameritrade clients did find some names to sell during the period. Facebook Inc. (FB) was net sold for the sixth month in a row. The company has become a focal point amid big tech antitrust scrutiny from lawmakers, with some calling for a breakup of the company, and traded lower during the period. Bank of America Corp. (BAC) also traded lower following revenue concerns on lower interest rates and trading, and was net sold. After reporting strong revenue growth early in the period, ROKU Inc. (ROKU) hit an all-time high as its market cap topped $10 billion, and was net sold. Wabtec Corp. (WAB) was net sold after the company traded lower as it tries to leverage its acquisition of GE Transportation. Widely held General Electric Co. (GE) traded higher early in the period after reporting better-than-expected earnings and reaffirming its 2019 forecast, and was net sold.
Additional names sold include Netflix Inc. (NFLX), Rite Aid Corp. (RAD), and Anadarko Petroleum Corp. (APC).
While fund flows have been consistently negative for equities in 2019, Goldman Sachs’ recent notes on Commodity Trading Advisors (CTAs) positioning suggests there is also a renewed appetite for equities. As of yesterday’s close, GS Strategists estimate U.S. equity net length for the systematic trend community stands at -$2bn. Over the last month, the desk estimates CTAs and trend followers have sold ~$64bn worth of U.S. equities, however, the last week saw CTAs purchase +$3.5bn worth of U.S. equities, as all trend signals (short-, medium-, long-term) have flipped positive in the S&P 500 and Nasdaq.
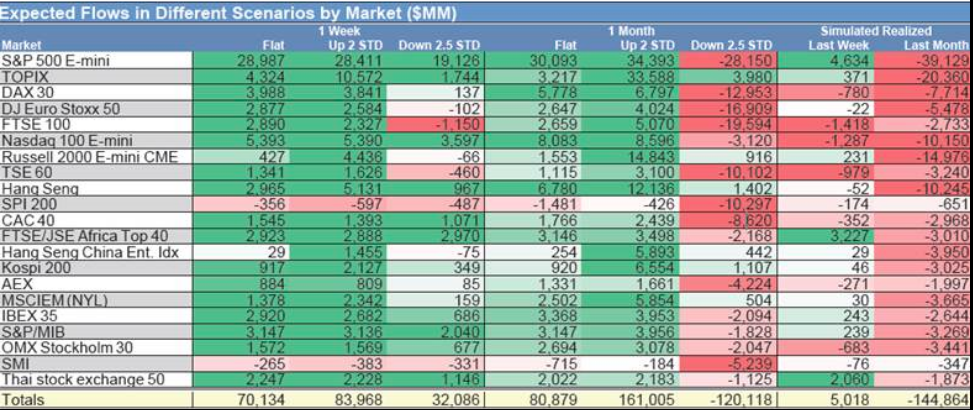
Looking ahead, the desk still expects very healthy demand for US equities from this community. In a baseline/flat scenario over the next week, the desk estimates CTAs and trend followers will purchase ~$35bn worth of US equities, which could increase up to $38bn if markets continued on an upward trajectory. Even in a scenario where equities sold off 1-2.5 SDs over the next week, the desk still expects an estimated ~$23bn worth of demand (full breakdown below).
The key S&P 500 levels to be aware of for this community of traders and trend followers, according to Goldman Sachs are as follows:
- Short-term threshold area: 2846
- Medium-term threshold area: 2801
- Long-term threshold area: 2723


