Research Report Excerpt #1

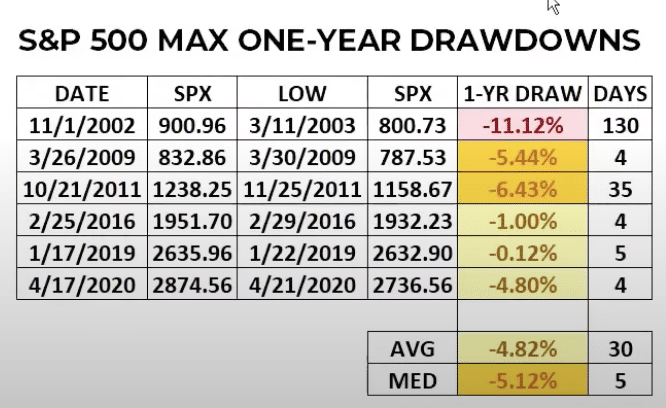
Over my career, I have experienced 7 market shocks, including the bursting of the technology bubble, the global financial crisis, and now COVID-19. I mention these events only to highlight the fact that market disruptions are a fact of life. It’s just a matter of time before the train goes off the rails. The chart above suggests these types of shocks and/or corrective waves happen every 4-5 years. Things have certainly sped-up a bit since 2018, with now 3 bear markets in just 4 years. Having said that, we’ve also witnessed ample bull market rallies to new all-time highs within the same span of time.
Research Report Excerpt #2
Despite this past week’s strong market rally across all indices, Asset Managers (smart money) and Leveraged Funds (dumb money) stepped up bearish bets against U.S. stocks to ever-higher levels. Asset Managers are still leveraged long (middle panel), but they are not doing so without ample hedges i.e. short S&P 500 futures (square box highlighted).
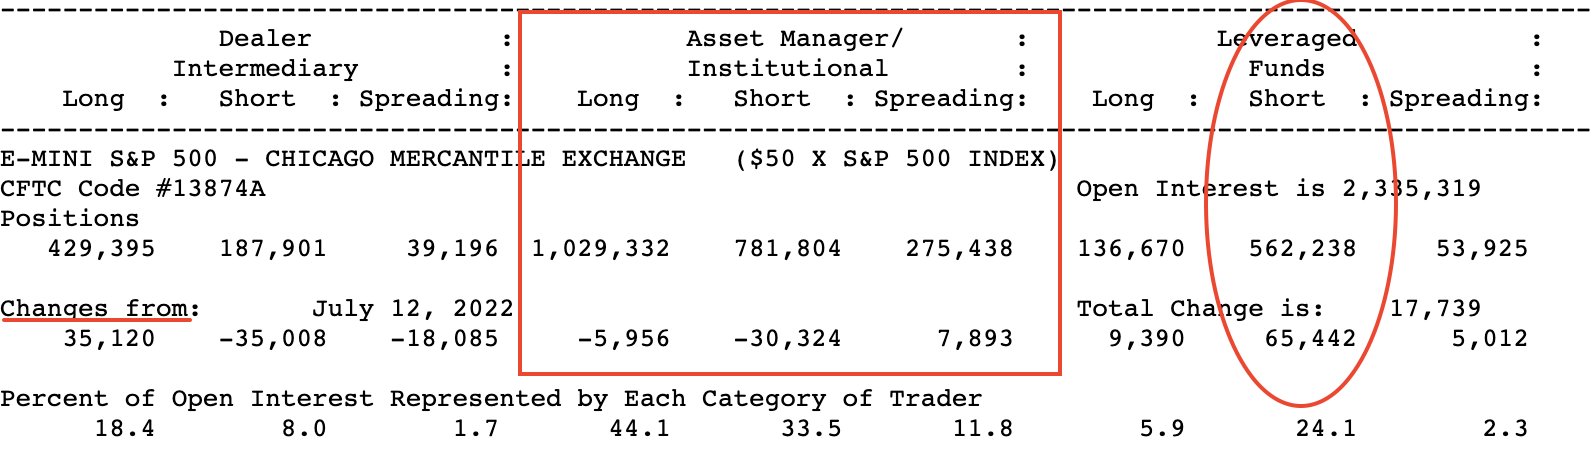
Leveraged funds are known as Hedge Funds, or Non-Commercials according to the CoT and CFTC weekly reporting. Typically, these market participants are also recognized as “dumb money“. For much of the year, and increasingly, the dumb money or Leveraged/Hedge Funds have been concerned about the market’s trend, and aligning for further downside. To-date, this strategy has worked, as dumb money has mostly moved to cash and/or been increasingly short the market.
Research Report Excerpt #3
In the following chart, from Fidelity, we can see the difference between a valuation reset (1946-49) and an earnings-led recession bear (1968-70 and 2000-02).
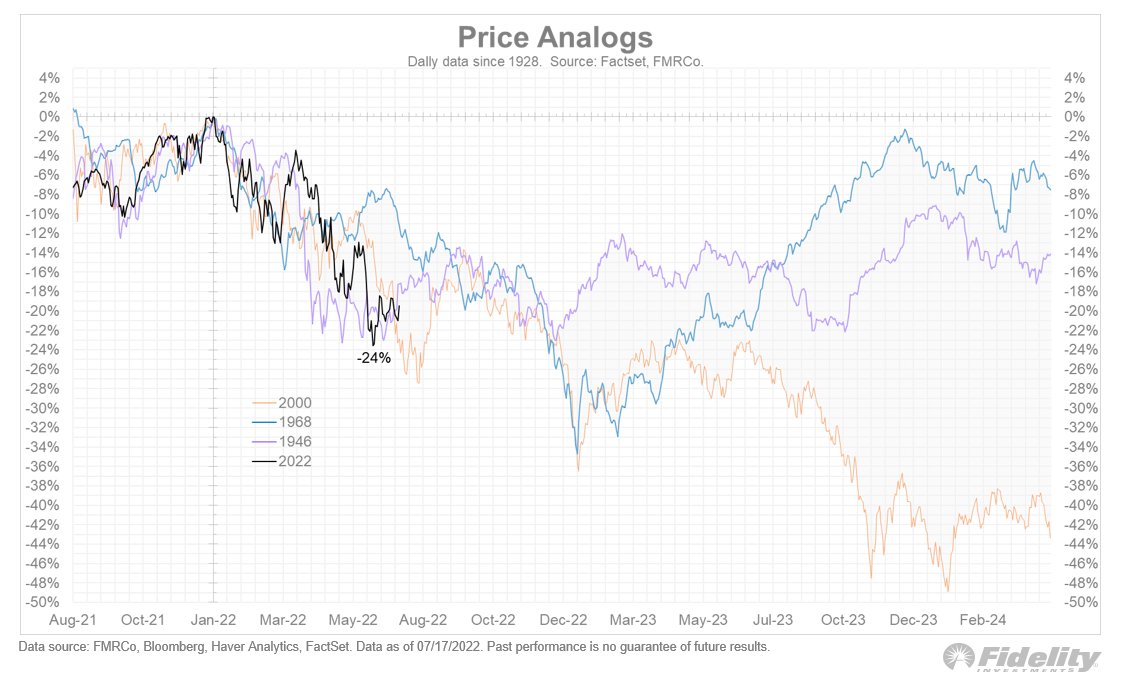
At this point, the situation looks a great deal more like a valuation reset than an earnings-led recessionary bear market. The only question from here is how the situation develops.
Research Report Excerpt #4
As reported just this past week, a consecutive monthly drop in Housing Starts; this must be recessionary, right?
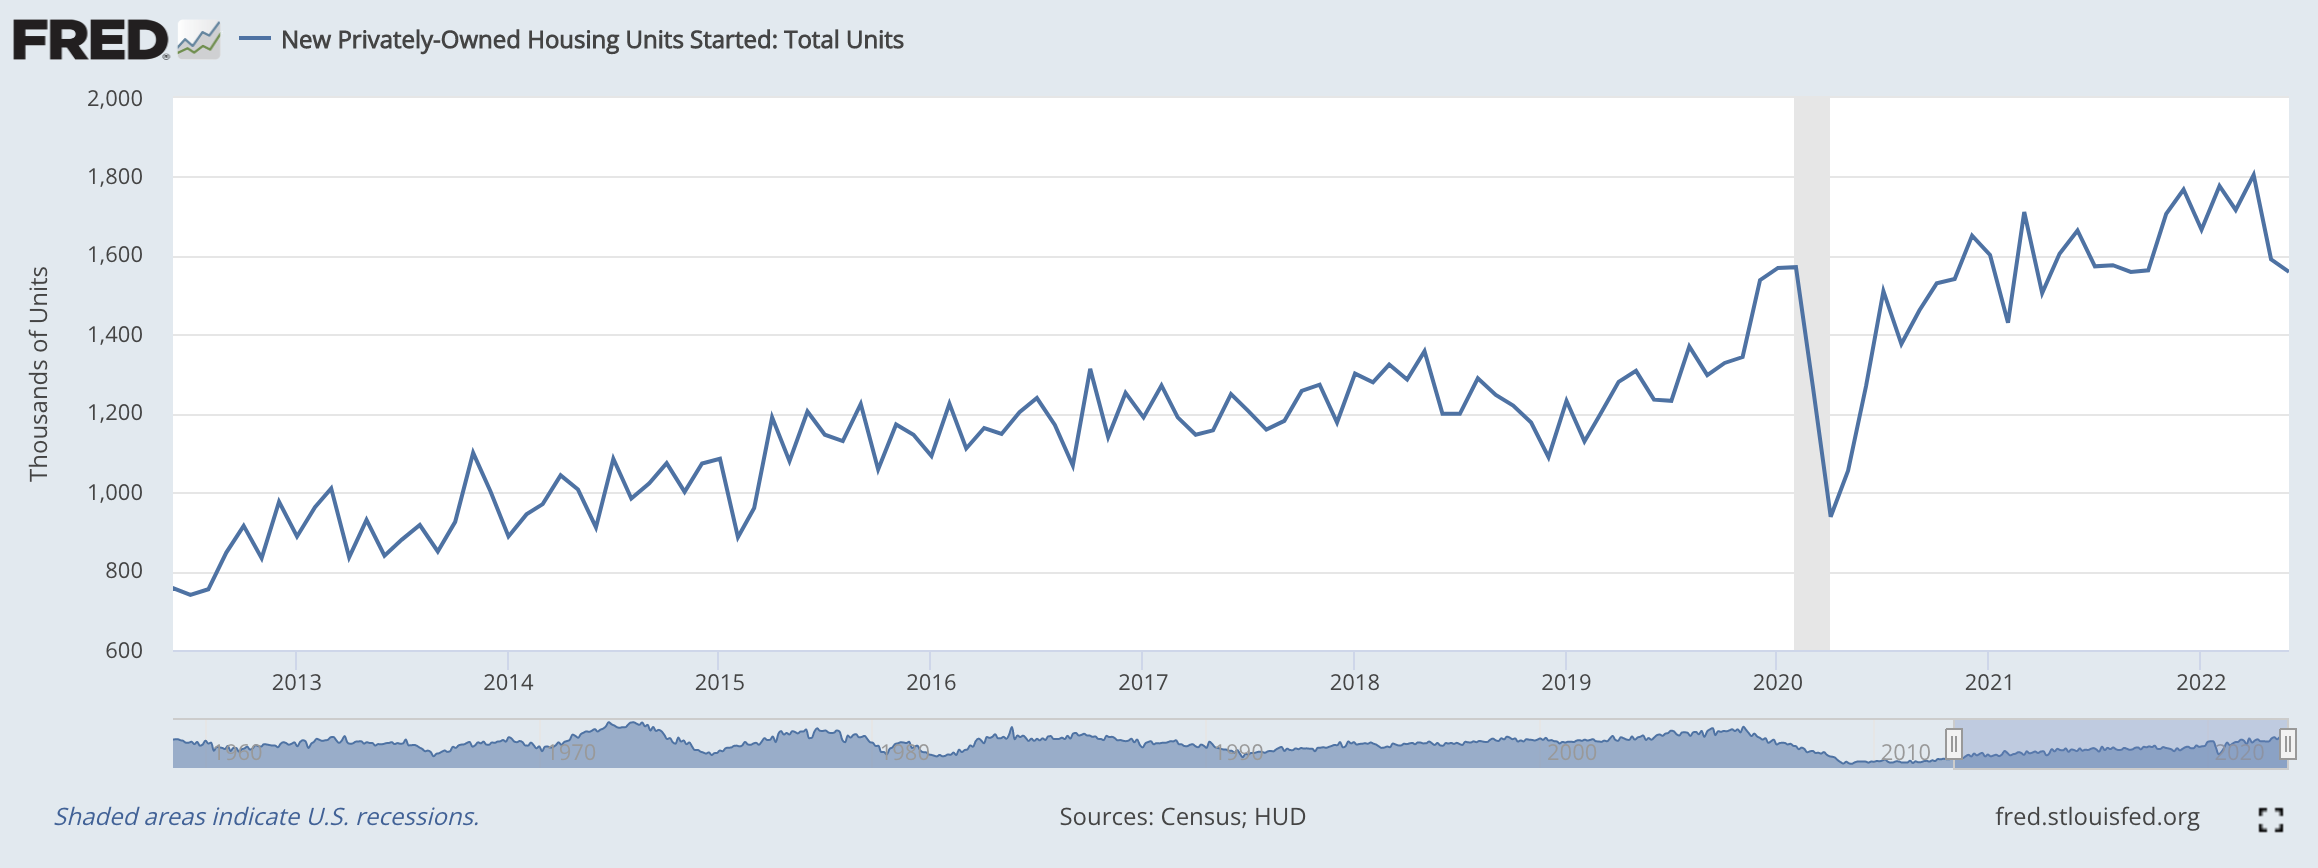
Wait a second! We saw similar drops in Housing Starts over the last decade that didn’t prove recessionary also. Furthermore, the monthly drops in Housing Starts recently came just after achieving a post Great Financial Crisis high in April of this year. So what is everyone panicking about?
Research Report Excerpt #5
U.S. Housing Affordability is at its lowest level since July 2006, which was at the peak of the last housing bubble. Back then, national home prices subsequently fell 25% to their low in December 2011. Naturally, we do not see a like occurrence this time around, as there are many differences between today and the run-up to the mortgage meltdown and GFC in 2008.
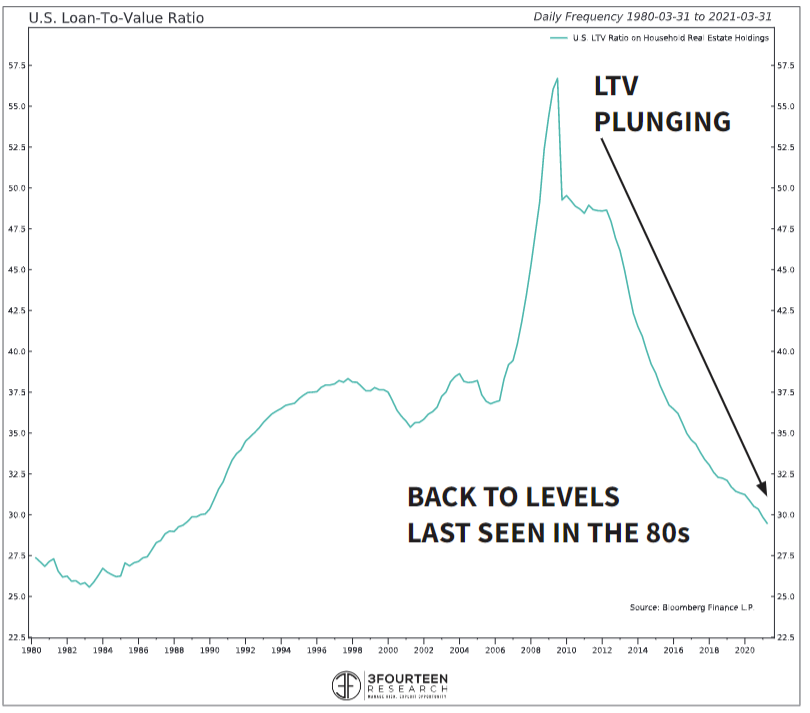
For one thing, Loan-to-Value ratios have plummeted and there are few signs of lending excess since the GFC. This is more likely to resemble resemble a ’90s-type cool down rather than a 2008 crash. Don’t let recency bias fool you into thinking otherwise.
Research Report Excerpt #6
In speaking of chronology as it relates to the latest Philly Fed data, we view the decline in New Orders, Inventories, and Unfilled Orders in negative territory while employment expanded as being a leading indicator. We think these represent bottoming levels, whereby all 3 metrics begin building again in August or September time period. On the inflation front, the Prices Paid component of the Philly Fed also suggests that peak inflation may have occurred in June.
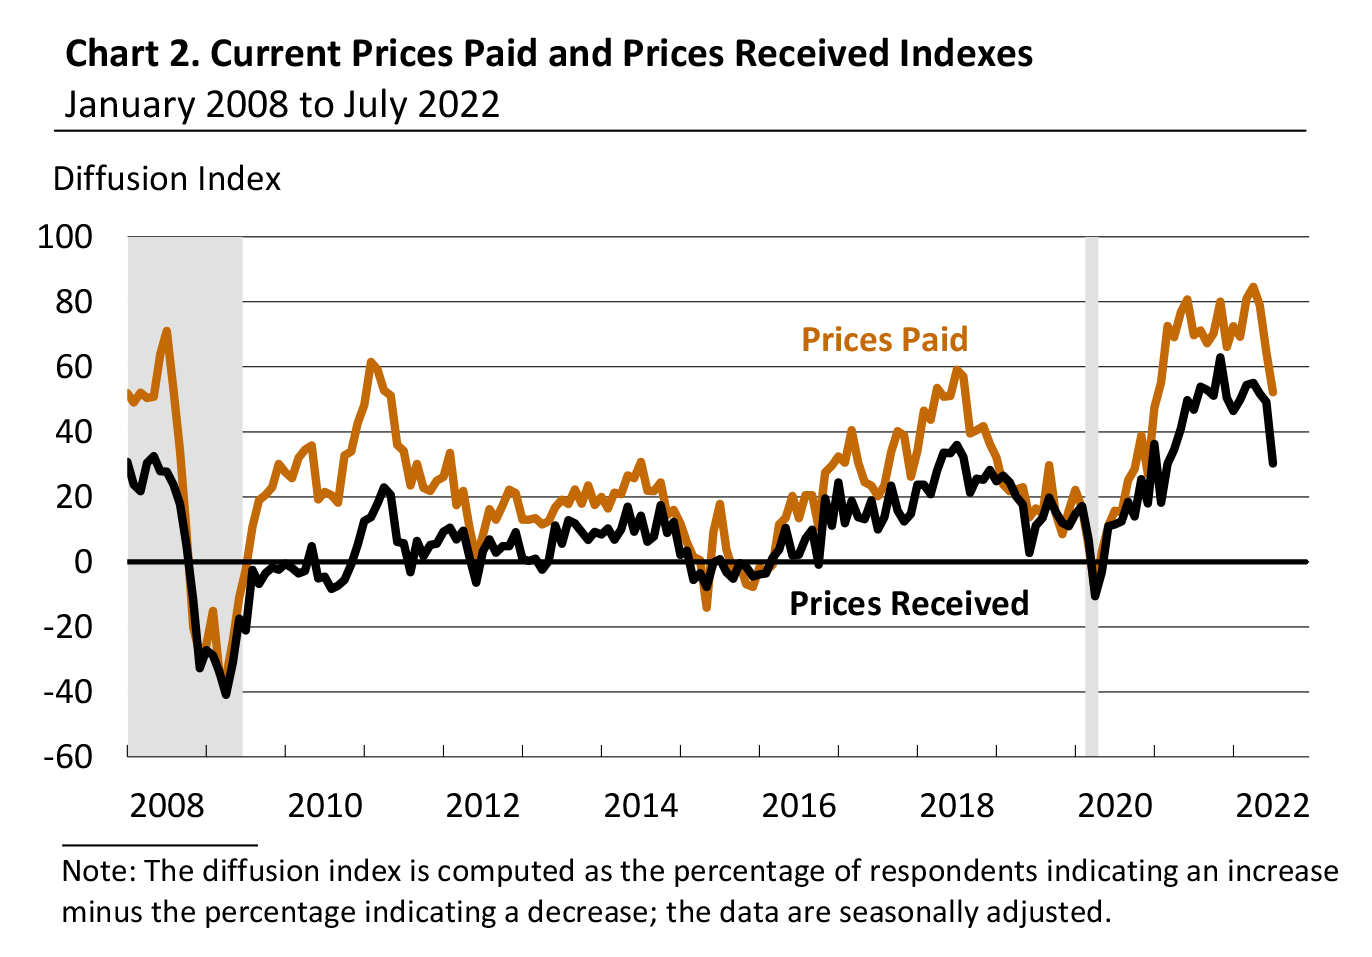
The indicators for Prices Paid and prices received declined for the third consecutive month but continued to suggest widespread price increases. The Prices Paid index fell 12 points to 52.2, its lowest reading since January 2021 (see Chart 2). Nearly 56% of the firms reported increases in input prices, while 3% reported decreases; 40% of the firms reported no change. The current prices received index dropped 19 points to 30.3. Almost 37% of the firms reported increases in prices received for their own goods this month, 6% reported decreases, and 57% reported no change.
Research Report Excerpt #7
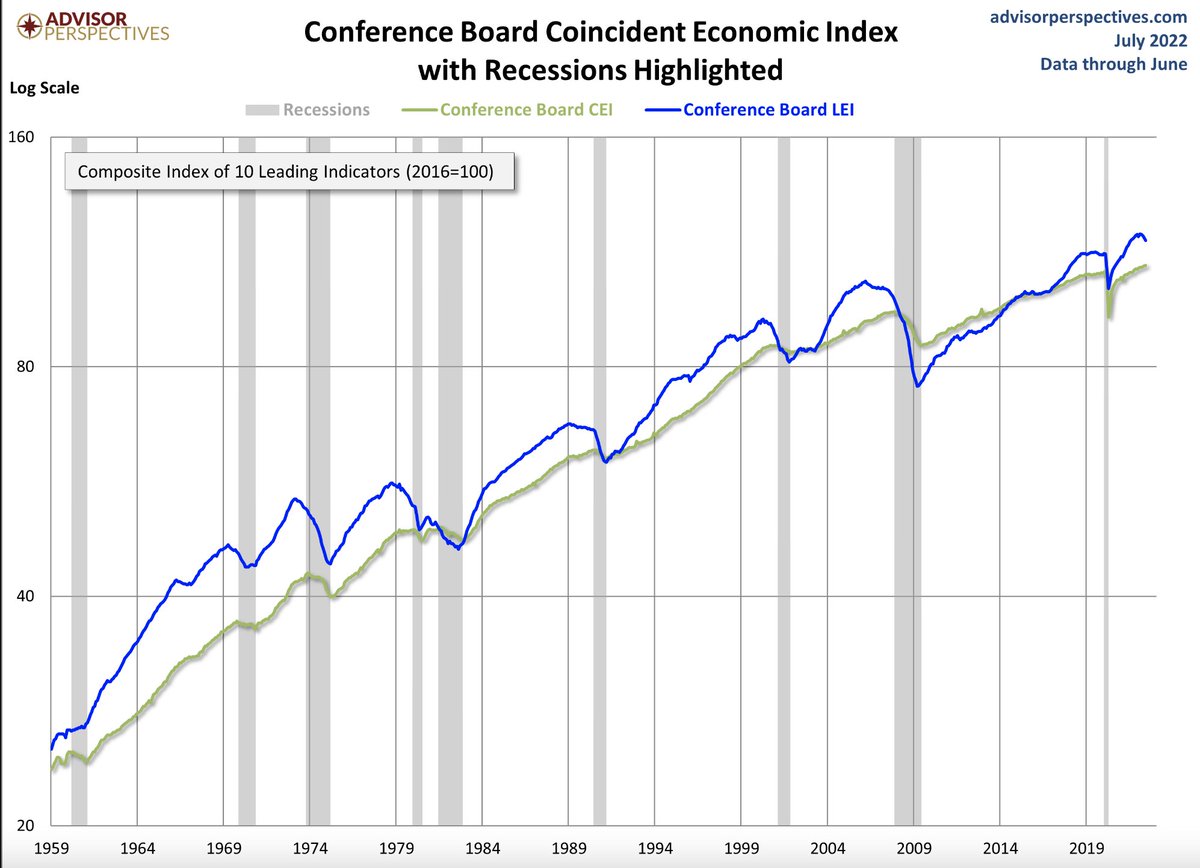
While the Leading Economic Index (LEI) is now down 4 consecutive months and declined -.8% MoM in the latest report from the Conference Board, a recession has never occurred without the Coincidence Economic Index falling. To-date, the CEI is up  every single month in 2022, including the month of June. The chart below tracks both the LEI and CEI since 1959:
Research Report Excerpt #8
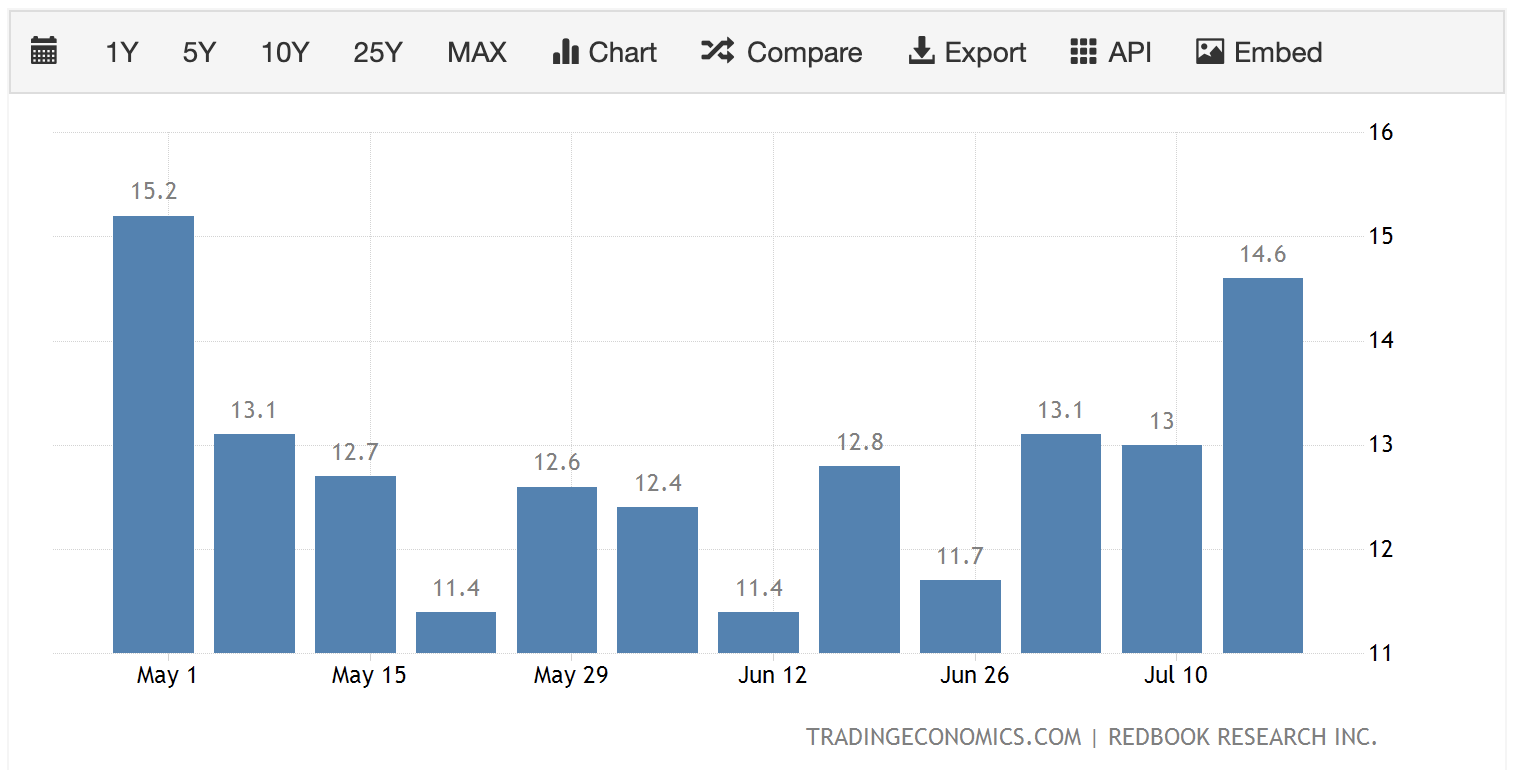
FINAL WORD ON THE ECONOMY IN ONE CHART:
Richard Bernstein Advisors: “Retail sales are nominal, but Johnson Redbook same store sales don’t even closely resemble those seen during a recession. In fact, they’ve accelerated over the past 4 weeks.
Research Report Excerpt #9

At the lows of the bear market, less than 5% of stocks had been trading above their 150-DMA in the Nasdaq 100. As of Friday’s close, 25% of Nasdaq 100 stocks are trading above their 50-DMA, as represented by the horizontal line from the left to right side of the upper panel (bottom panel S&P 500). Going back to 2002, a cyclical resurgence from such weak breadth in the Nasdaq 100 to stronger breadth, as signaled by the blue horizontal line (25%), has proven a bottom for the index and the S&P 500. One year later the market has been higher every time since 2002. (table below from Chris Ciovacco)