
Welcome to another trading week!! In appreciation of all of our Basic Membership level participants and daily readers of finomgroup.com content, we offer the following excerpts from our Weekly Research Report. Our weekly Report is extremely detailed and has proven to help guide investors and traders during all types of market conditions with thoughtful insights and analysis, graphs, studies, and historical data/analogues. We encourage our readers to upgrade to our Contributor Membership level ($7.99 monthly, cancel any time) to receive our Weekly Research Report and State of the Market Videos and take advantage of this ongoing promotional event today! Have a great trading week, be in touch, and take a look at some of the materials in this weekend’s published Research Report!
Research Report Excerpts #1
These two sectors (Materials and Industrials), if nothing else, speaks to healthy market consolidation that could give way to broadening market breadth once the market resumes its uptrend. The market will ultimately resume its uptrend, it’s just a matter of “when”. Within Industrials are the Dow Jones Transports (DJT), another chart that suggests the current market consolidation is just that and not something to be feared, but revered.
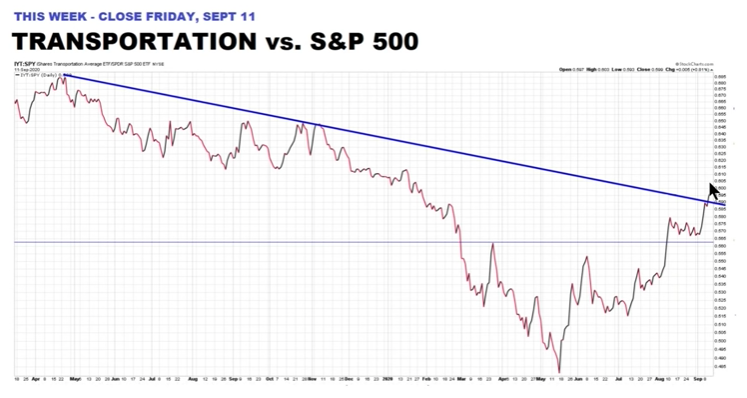
The Transportation stocks relative performance to the S&P 500 just broke above a long-term trend-line. Does this look bearish to you? If we condense our time frame and look at just the absolute performance of the DJT, here is what we see:
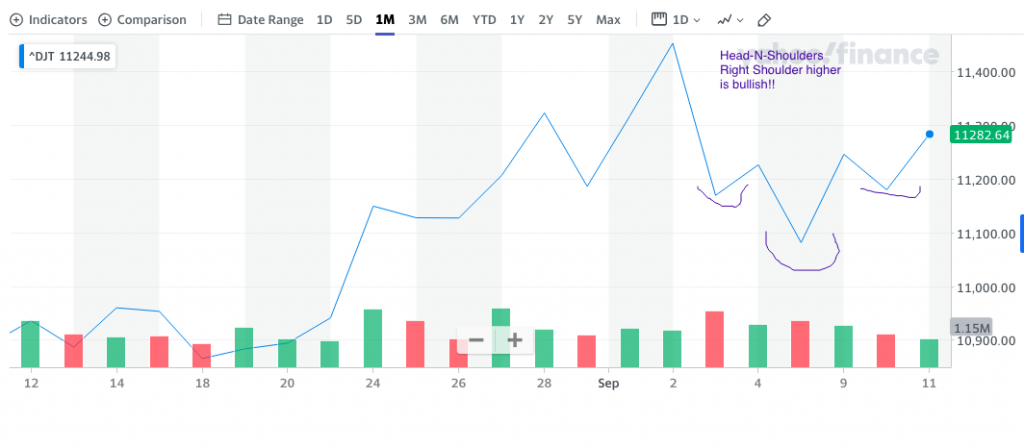
This is a bullish, inverse head-n-shoulder pattern. It’s bullish because the right shoulder is higher than the left shoulder. Potentially more importantly, in a week where the S&P 500 finished down ~2.5% and the Dow Jones Industrial Average (DJIA) finished down 1.66%, the DJT finished higher by ~.50 percent! Again, what I’m trying to emphasize here and push to the forefront of your consideration is not the correction afoot, but the characteristics of the correction, how it is happening under the hood. HOW corrections unfold inform our decision-making.
Research Report Excerpts #2
Here is another chart on the VIX and market volatility as we approach the election time period.
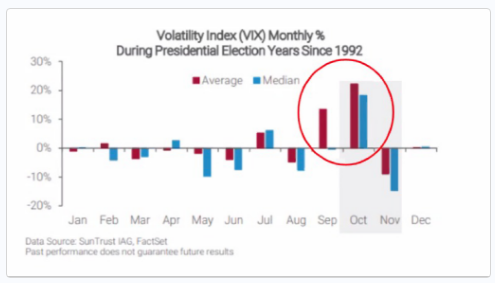
The chart basically outlines an increase of 4 points in the VIX ahead of the election since 1992. On the surface, that might seem scary and might be why the media continues to promote the idea of increased volatility ahead of the election, but… but, but, but… Look at the chart below of the VIX mean monthly reading going all the way back to 1990 and inclusive of the last 7 elections dating back to 1992.
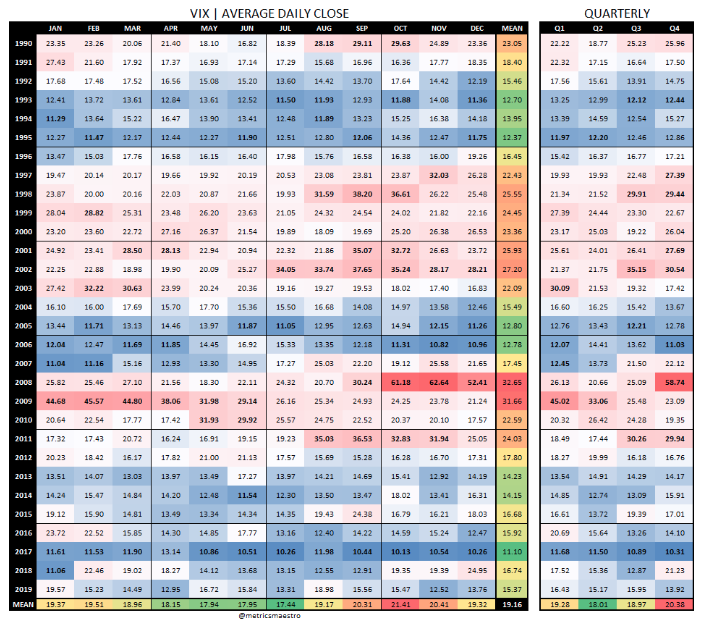
It’s really a 50/50 probability of a rising VIX and the data is EXTREMELY, HEAVILY skewed due to 2008’s rise from a 20 VIX in September to a 60+ VIX in October 2008.
Research Report Excerpts #3
More often than not and in an increasing manner, the media offers the most attention to the data which underwhelms and might prove discouraging to investors, pessimistic if you will. Now while I’ve offered such a characterization of the media in the past and many times before, we can now quantify the characterization with actual data.
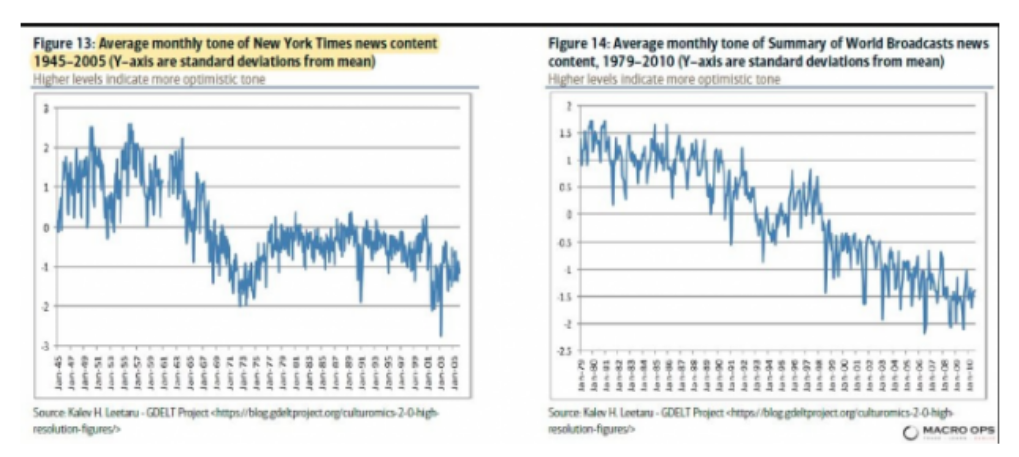
It turns out, the media has offered a more and more pessimistic message to viewers for many, many decades. Many investors fall prey to such traps. The media may focus on joblessness, high unemployment rate, economic uncertainties and the like while overlooking the trend of strengthening economic conditions and structural economic improvements for the sake of absolute levels of economic performance. The latest cover of Barron’s Magazine is a perfect example of the financial media fear-mongering artistry.

Research Report Excerpts #4
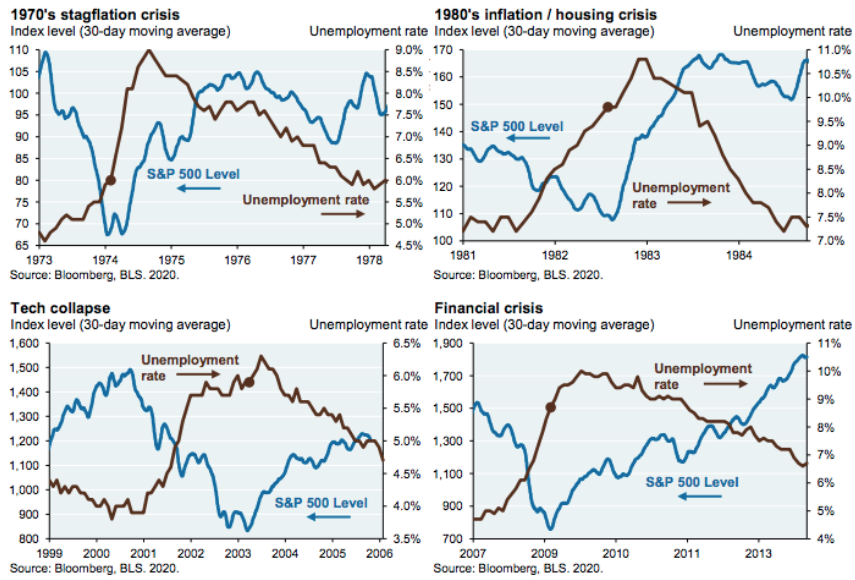
As it pertains to employment, much like a recession, the market tends to lead a recovery in the labor market. In every recession since the 1970s, markets hit bottom months or years before peak unemployment. (See past recessions below)

Research Report Excerpts #5
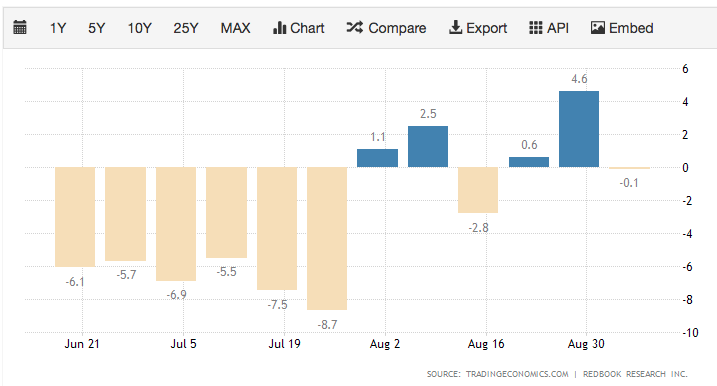
There is no data slated to be released on Monday, but Tuesday will follow with the release of the Empire State manufacturing index. This we be followed on Wednesday with the release of the monthly retail sales report from the Census Bureau and a highly anticipated Fed rate announcement and press conference. Our high frequency data on retail sales from Redbook has proven favorable during the month of August.
Thursday is jam-packed with jobless claims, Philly Fed manufacturing, Housing Starts and Building permits data. The weekly data releases concluded with the University of Michigan Consumer Sentiment reading.
Research Report Excerpts #6
Fast-forward to the present day and estimates continue to rise, supporting what the equity markets have been front-running for the last 5 months. The chart below is from Yardeni Research, outlining the current and updated consensus EPS forecasts, along with Dr. Ed Yardeni’s proprietary forecast for FY2020, FY2021 and FY2020 EPS.
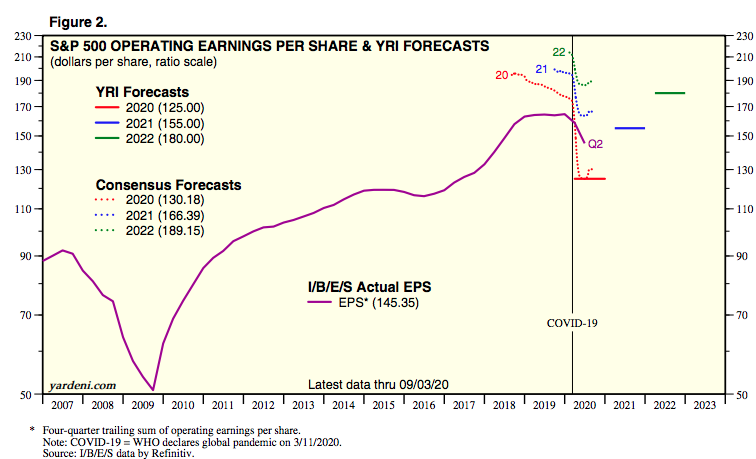
- The FY2020 EPS consensus estimate has improved from $129.88 in the previous weeks to $130.18 as of this past week. That is a rise of $.30 per share in Q3 EPS.
- What if Q3 EPS estimates prove too low, again?
- Will we see another $5 increase in the FY2020 EPS consensus estimates by the end of Q3’s reporting season as we saw by the end of the Q2 reporting season?
- The estimates for FY2021 continue to rise as well from $165.69 in the previous report to $166.39 in the most recent.
Research Report Excerpts #7
The immediate question that comes to mind is, “How will the Fed raise inflation?” After all, what good does it do to raise the target if you’ve been undershooting it for years? Core Personal Consumption Expenditures (PCE), which the Fed uses as its benchmark inflation measure, has spent most of the past 12 years below the 2% target.
Inflation has fallen short of 2% for most of the past decade

I believe the Fed will have a difficult time pushing up inflation, but inflation expectations are likely to continue to rise due to the change in the way the Fed will react to potential inflation. In fact, the Fed’s new stance is actually more focused on jobs than inflation. In his policy speech, Fed Chair Jerome Powell talked extensively about employment and the importance of the Fed doing all it can to support job growth. A part of the Fed’s review of its policy was a “listening tour” during which it engaged in discussions about the economy with communities across the country. The overwhelming message was that a strong labor market is important for improving the lives of individuals and the overall economy.
Research Report Excerpts #8
Below is a back-of-the-envelope attempt to quantify the effects of market timing. It is far from a perfect approach, but what you see here is a calculation of the 10-year profit and loss (P&L) of all monthly net flows into equity mutual funds and ETFs, and compared that to the 10-year P&L of a dollar cost averaging strategy. Both of these are then compared to the long-term compound annual growth rate (CAGR) for both the S&P 500 and cash.
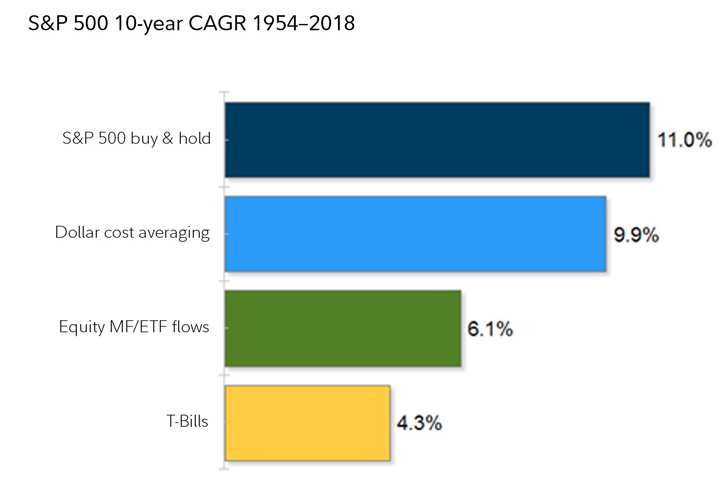
As you can see, while dollar cost averaging comes very close to replicating a buy and hold strategy (represented by the long-term CAGR of the S&P 500), fund flows (as a proxy for market timing) lag far behind and are pretty close to what you can earn by sitting in cash. Market timing, on aggregate, tends to detract from performance while increasing volatility. As Peter Lynch has famously said, “More money has been lost from anticipating corrections than from the corrections themselves.“ Stay the course folks; corrections happen all the time and generally don’t have to cost the individual investor anything but a little bit of time.
Thank you for joining us for another trading week and reviewing our weekly “Must Knows”! To receive and review our weekly, full-scale Research Report each Sunday and our State of the Markets weekly video analysis every Thursday, subscribe to our Contributor Membership level at just $7.99 monthly (Cancel any time)! With these two weekly deliveries, you’ll have all the unbiased and fact-driven market and economic data analysis at your fingertips. Don’t make capital allocation decisions based on headlines that brush the surface of what is and isn’t affecting markets. Let our deep-dive analytics supply you with bottom-up and top-down analytics. You won’t be disappointed. Upgrade today!!


