
The Hazmat Recovery. In response to the worst pandemic in 50 years and a country at war with itself over lockdowns, individual freedoms and election results, the Fed and Congress airdropped an unprecedented amount of stimulus with vaccine airdrops to follow. That should be enough for markets to rise again in 2021 as pent-up activity is unleashed, and since the bill for stimulus is shifted to future generations. Whether this solves any of the other issues is a different story. Our 2021 Outlook reviews these topics along with deep dives on China, Europe, Emerging Markets, tech antitrust issues, gold and the rapidly shrinking portfolio choices for yield-oriented investors.
2021 Outlook: The Hazmat Recovery
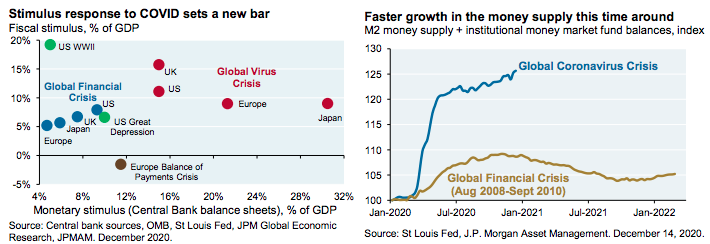
While 2020 is defined by some as the year of COVID and by others as the year of the most hotly disputed US election in decades, for investors it was the year of mega-stimulus. The developed world response to the coronavirus involves monetary and fiscal stimulus that dwarfs anything seen before it, that was delivered much faster, and which influences our investment outlook for 2021 and beyond.
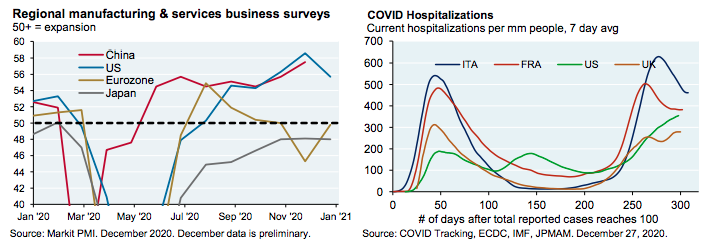
COVID has surged in the developed world, and vaccination of vulnerable populations may not permanently mitigate hospitalization and mortality until April or May1. The first chart on the next page shows the US spending stall that hit when the fall COVID wave began. Even so, by late summer of 2021 we expect the global economy to be close to pre-COVID levels of activity given vaccination timelines. China is already booming again, and signals from the copper market point to stronger global growth in 2021.
Vaccinations. The US Advisory Committee on Immunization Practices has prioritized healthcare/nursing home workers and long term care residents in Phase 1a. Given projected vaccine production schedules, most US healthcare workers could be immunized by the end of January.
Phase 1b targets essential workers (teachers, agriculture, police and fire) and people over age 75. Phase 1c targets those aged 65-74 and people with high risk medical conditions. Phases 1a-1c could be completed by June. More broadly, developed countries are projected to have vaccine capacity of 1.5x-2.0x their vulnerable populations (people > 60, medical workers and those with severe co-morbidities) by Q2 2021, and 0.5x to 0.7x their total populations by the same date. See Section 3 on our COVID web portal for more information.
Pandemic shocks are different from traditional recessions. Pandemics and natural disaster cycles are generally faster: see employment, production, consumer spending and capital spending examples below. As the global and US recoveries continue in 2021, we expect US unemployment to end 2021 at around 5%. The third chart highlights the very different impact of pandemic lockdowns on labor markets: while unemployed individuals surged in 2020, the number of job seekers per job opening did not (i.e., most expect to get their jobs back).
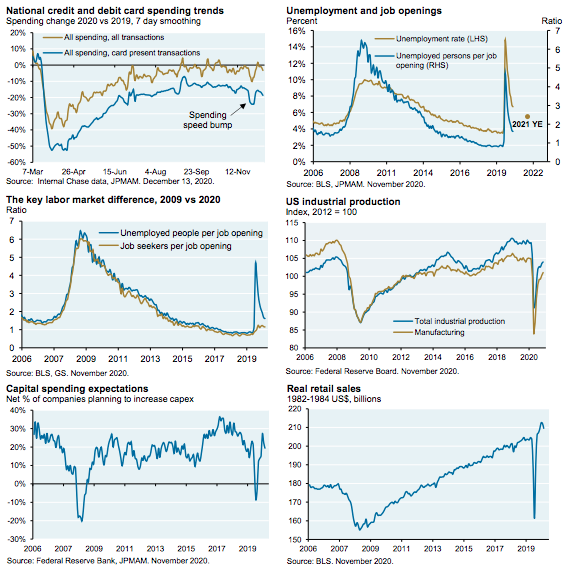
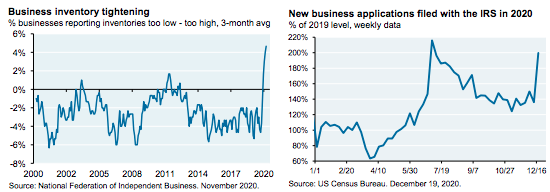
Tight inventory conditions should help growth by mid-year given the need for hiring and capital spending to meet demand; elevated supplier delivery delays also confirm this general trend. Note that despite business closures due to COVID, there was a spike in new business applications across a wide range of industries.
To be clear, there has been a catastrophic employment decline in COVID-affected sectors. To get a sense for how bad leisure & hospitality job losses are, consider this: the peak decline in employment in the last few recessions was 4%-6%; and that’s how much employment is still down in the better-positioned sectors of the US economy. So, the current 20% decline in leisure & hospitality employment is catastrophic.
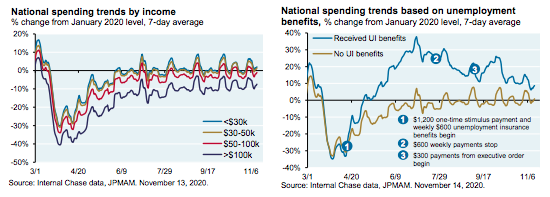
However, fiscal stimulus allowed spending for the lowest income cohorts to recover to pre-COVID levels by June of last year. See the first 2 charts on the next page; you can see the impact of stimulus bills on spending of unemployed families. How are households doing on mortgage payments? The truth lies in between the Fed delinquency measure (assumes that people on forbearance will be current when plans end) and the MBA measure (assumes that people on forbearance are in default). Since unpaid balances will be shifted to balloon payments at the end of the mortgage, I believe the “right” measure is closer to the lower Fed estimate.
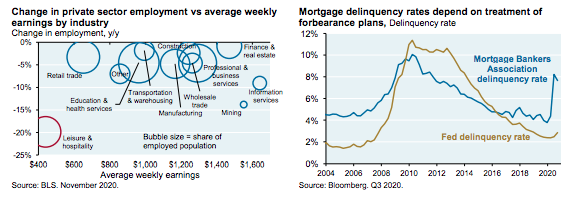
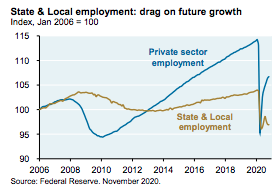
One last comment on employment: US state & local governments suffered large revenue shortfalls due to lockdowns. They are likely to be a drag on growth in the years ahead, as they were a decade ago after the Global Financial Crisis. The state/local fiscal gap (net of CARES Act funding) is ~$170 bn; smaller than the originally projected $250 bn gap, but still significant. Possible spending cuts: municipal employment levels (which are 10-12% of total US employment), and contributions to pension and retiree healthcare plans which are already underfunded. We will take a look on a state by state basis later in 2021.
The Federal Debt Explosion
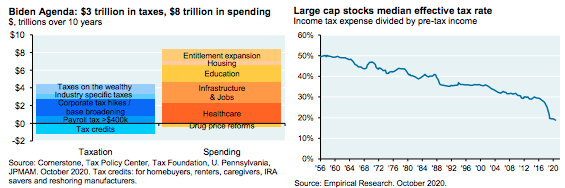
US debt levels are projected to hit WWII peaks by the end of 2021. The projected 2020 US fiscal deficit is 16% of GDP, the largest deficit since 1945. In July 2020, the CBO projected the 2021 deficit at 8.6% (between 1946 and 2019, the deficit was only larger twice). Updated deficit forecasts for 2021 require assumptions on growth, the latest stimulus bill and the interplay between the two; our sense is that the deficit will exceed 10% of GDP in 2021. On top of such deficits, Biden’s tax and spending proposals entail another $3 trillion in taxes and another $8 trillion in spending over the next decade, which would drive the US federal debt to even higher levels. See the second chart, and p.33 for more on what looks like a permanent increase in the US federal debt. These increases are of course contingent on political developments we discuss on the next page.
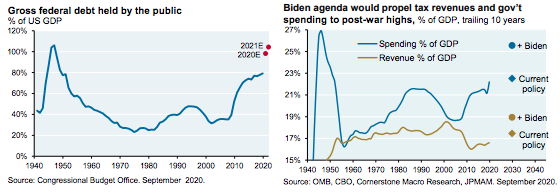
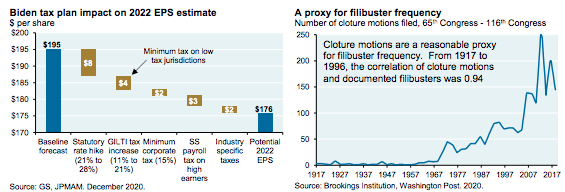
One of the most important components of Biden’s plans for investors: changes to corporate taxation. Investors pay close attention to corporate taxation; its decline since the 1980’s has been a key driver of expanding S&P 500 profit margins. Biden’s agenda doesn’t just increase corporate tax rates; the plan also includes base broadening and a wide range of industry-specific taxes. In aggregate, Biden’s corporate tax plans would raise $2.2 trillion compared to corporate tax cuts of $740 billion provided by Trump’s 2017 bill. In terms of its impact on profits, Biden’s plan could reduce S&P 500 EPS by ~10%, but that’s before incorporating any growth benefits from increased government spending (i.e., multiplier effects).
Biden’s agenda is dependent on the outcome of Georgia Senate runoff elections. If Democrats win both seats, they could enact tax/spending changes with a 51-50 Senate majority using budget reconciliation rules, and enact other major policy changes by jettisoning the Senate filibuster (which if retained, requires 60 votes in the Senate to pass most legislation). However, even if Democrats attain 50 seats in the Senate, they may find it difficult to (a) use budget reconciliation to pass Biden’s tax and spending proposals with very narrow Senate and House majorities, and to (b) jettison the Senate filibuster which has been used frequently in recent years by both parties to block legislation. Filibuster supporters reportedly include Joe Manchin (D WV), who is ideologically closer to moderate Republicans than he is to progressive Democrats.
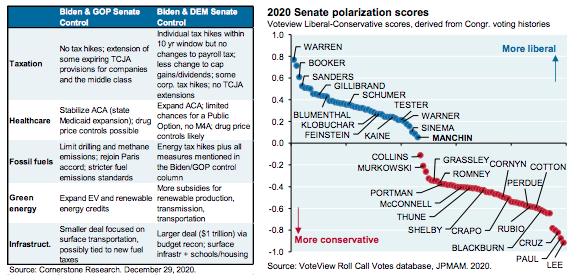
Cornerstone Research has laid out policy avenues for Biden with and without Senate control, some of which we illustrate below. In addition, we go into detail on antitrust later in the Executive Summary and on pages 25-28; we discuss tariff and trade policy on pages 15-17; we expect a rejuvenated Consumer Finance Protection Bureau once new leadership is confirmed; we expect Net Neutrality to be reinstated; and expect Biden to expand DACA, refocus ICE on violent offenders, increase immigration agency staffing and increase refugee limits.
Budget reconciliation allows tax and spending changes if there is no change to the deficit after a ten year time frame (this clause is why some Trump tax cut provisions sunset within 10 years). Also, no changes are allowed to payroll or social security taxes, which are a big component of the Biden plan ($870 bn out of $3 trillion in new taxes). Finally, tax and spending changes must be “incidental” to regulatory policy and not contingent on them.
Markets: earnings set to rebound, but a lot of good news is already priced in
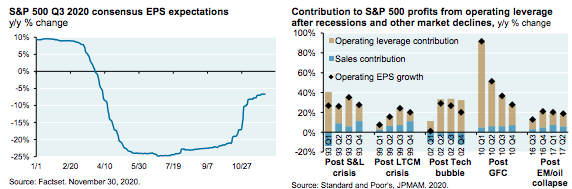
Earnings resilience. In Q3 2020, S&P 500 earnings handily beat expectations (-8% vs consensus -25%), and the details are important: airlines, other travel-related businesses and energy accounted for essentially the entire S&P 500 earnings contraction in the quarter. Free cash flow for the core of the equity market (excluding financials, REITs and energy) was actually up in Q1, Q2 and Q3 of 2020. At the current pace of improvement, S&P 500 EPS should exceed pre-pandemic levels by the end of 2021.
US companies often demonstrate “operating leverage” after recessions, which refers to EPS growth well in excess of low sales growth. This is shown in the second chart, and we expect the same to be true in 2021.
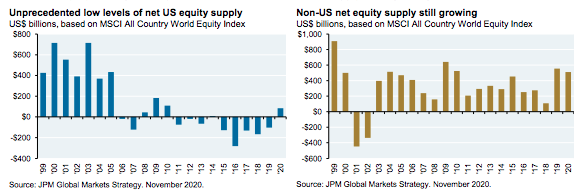
There are also technical factors at work that may explain why recent bear market recoveries have been so rapid. Since 2011, the pace of US buybacks and M&A have exceeded the pace of primary and secondary US equity issuance. As a result, the “stock” of investible public equity has not grown as it normally would, so when institutional investors rebalance, supply constraints accelerate the market’s rise. Note that while this is true in the US, an equity shortage is not present outside the US where net supply is still growing.
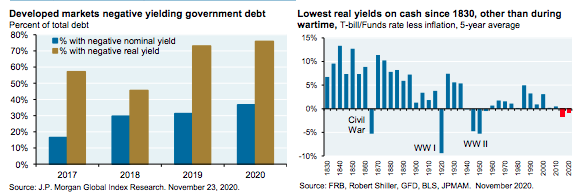
All that said, it’s hard to escape the pervasive impact of zero interest rates on the investment landscape. The next chart shows how a third of all developed markets sovereign debt has yields below zero in nominal terms, while 75% has negative real yields (i.e., rates below the rate of inflation). The second chart indicates just how anomalous this is: the last decade has seen the longest sustained period of negative real policy rates in recorded US history, other than during the Civil War, WWI and WWII.
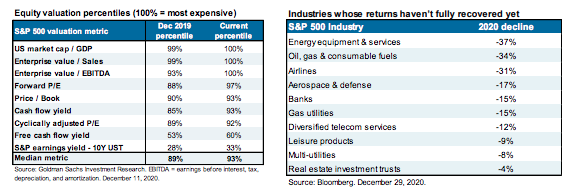
The result: high equity valuations. The first table shows valuations compared to their history with 100% indicating maximum expensiveness. Some valuations might look lower if earnings outperform expectations next year, but not by enough to make a large difference. Sentiment is elevated as well, with most readings in the 90th percentile of optimism or higher. If you’re looking for bargains, be prepared: as shown in the second table, they’re concentrated in energy, airlines, banks and sectors heavily affected by the pandemic.
It’s worth noting that 90% of S&P 500 market cap is now based on intangible assets (R&D, intellectual property, software, etc), complicating historical comparisons. P/E ratios of the asset-heavy US corporate sector of the 1960s-1980s might not be the best comparison for today’s asset-light, less capital-intensive S&P 500 universe. Intangible asset shares were 20% in 1975, 30% in 1985 and 80% by 2005. So, some upward drift in S&P 500 P/E ratios over time makes sense, in principle.
Even so, the equity melt-up which took place at the end of 2020 will probably limit market gains to ~10% in Consensus is bullish, which sets the stage for corrections and profit-taking from time to time.
Percentiles of investor optimism, measured since November 2016 (100 = most optimistic): American Association of Individual Investors (98); Investors Intelligence Advisory Sentiment (95); NAAIM Active Managers Sentiment (99); and a measure of cash holdings of the 20 largest US equity mutual funds (100).
Market concentration and antitrust risks
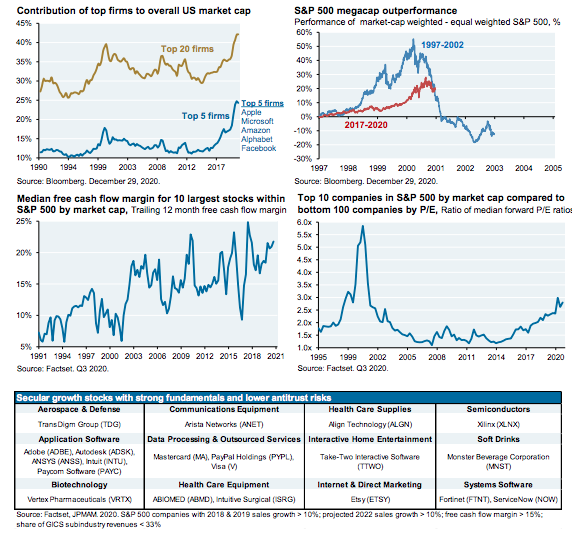
Since 2016, 5 megacap stocks (AAPL, AMZN, MSFT, GOOG and FB) have represented a disproportionate share of market cap and return contribution. They’re a lot more profitable than their late 1990s counterparts, and they’re not as expensive in relative terms. That said, I don’t think we should use 1999 as a benchmark to assess potential peak relative value; the demarcation line for market excess might be much lower than that. We’re neutral on these stocks heading into 2021 for reasons explained in the Special Topics section on page 25 which covers antitrust risks at home and digital service taxes abroad.
As an alternative to the big 5 megacap stocks, consider other secular high-growth stocks without antitrust baggage. The table shows stocks that have generated strong revenue growth and are expected to keep doing so; which do not spend enormous amounts acquiring customers or indirectly paying contract labor (i.e., positive free cash flow margin); and which fly well below the antitrust radar (low share of industry revenues).
High yield: another beneficiary of financial repression
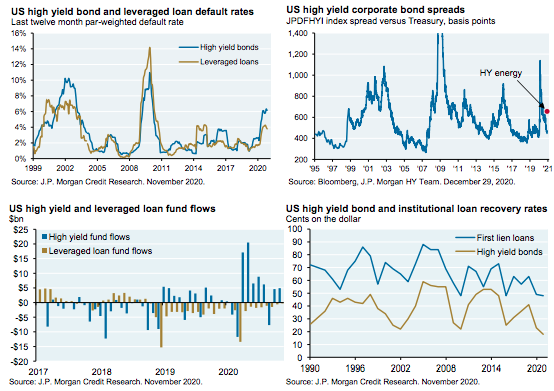
Monetary and fiscal stimulus provided impactful backstops for large and small companies. While the 2020 recession was twice as deep as in 2009, high yield and leverage loan default rates are showing signs of peaking at just half the 2009 level. The same is true for manufacturing and service sector bankruptcy filings, which have also already peaked at roughly half of 2009 levels.
The flood of liquidity prompted investors to pile into high yield bonds last year. Pay attention, however; underwriting standards and covenant protections have weakened sharply. In July 2019, we examined deteriorating underwriting standards in the loan market, and little has changed since then. While credit spreads have rallied, there are signs that investors have paid a price for overly aggressive underwriting: declining recovery rates on defaulted HY bonds/loans.
I don’t have much to say about investment grade corporate bonds. Net of inflation, the yield on the Barclays Investment Grade Corporate Bond Index is now slightly negative. Pass.
Wrapping up: our 2021 Outlook and Special Investment Topics
It could take 3-4 months for vaccinations to permanently shift developed world hospitalization and mortality curves down given logistics involved. Furthermore, the US is not only divided politically, but also medically: there’s a lot of vaccine resistance, with recent polls showing that 15%-30% of Americans don’t plan to get it (of countries surveyed, only the “French Resistance” is higher; see virus web portal Section 3).
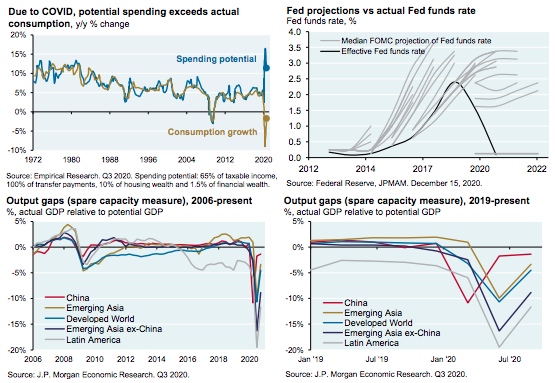
Even so, as vaccine rollouts eventually mitigate COVID risks, pent-up spending potential will be unleashed and we think the Fed will do little to constrain it. The first chart shows estimated spending potential compared to actual consumption; the gap is still large. While wage and salary growth has been weak compared to prior recessions, transfer payments have been much larger. On the Fed, the second chart is cruel but fair: for the better part of a decade, the Fed was wrong about where the economy was going as it consistently overestimated inflation risks, the strength of the recovery and the path of future policy rates. After a decade of forecasting futility, my sense is that the Fed will wait to see a four-alarm fire of inflation before raising rates. Other central banks will likely take the same approach; output gaps, which measure unused labor and industrial capacity, are large everywhere but China (see bottom 2 charts).
To conclude, we anticipate a year of ~10% US equity market gains in 2021 with bouts of profit-taking along the way, with the caveat that a lot rests on runoff election outcomes and filibuster decisions. We take a closer look at 10 Special Investment Topics starting on page 14, including deeper dives on China, Europe, Emerging Markets and tech antitrust issues. Here’s a quick summary of other market views for 2021:
- Continue to overweight US and Emerging Market equities vs underweights to Europe and Japan
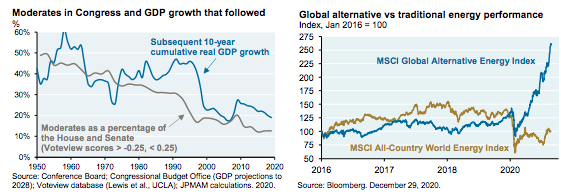
- Look for better entry levels on renewable energy. We don’t anticipate a Green New Deal, but Biden can still disallow LNG export permits, tighten fracking rules on public lands, increase climate risk disclosure and reinstate auto mileage standards. Biden can also try to boost penetration of grid renewables through subsidies and eminent domain decisions on HVDC transmission infrastructure for wind/solar. Remember, US states set their own renewable portfolio standards; they are not set at the national level. We like renewable energy as an investment, but after the recent spike it pays to wait for better entry levels
- For deeper value, own traditional energy for reasons outlined in our 2020 Energy paper. Even after a 30% rally in November 2020, the S&P 500 oil & gas sector still trades at half the book value of the market, its lowest level since 1928. We see the loss of capital discipline rather than stranded asset risks as the primary driver of poor energy sector performance. In addition, we consider it unlikely that Biden will resuscitate an Iran deal that could release another 1mm bpd onto the global oil market
- Infrastructure stocks may benefit from a bill given bipartisan support (infrastructure ETFs and open-ended commingled vehicles investing in private infrastructure are two ways to express this view)
- Cautious on large cap pharma: a bipartisan prescription drug bill is possible, and the Executive Branch can also implement demonstration projects that bring Medicare Part D drug prices down to international levels
One last thing. Conventional wisdom is that Congressional gridlock is good for equity markets. This has been the pattern, and I suspect it will be true in 2021 as well. But there’s a difference between simple gridlock and what we have now: as shown on the next page, the US is more intensely partisan than at any time in the last 100 years, and it’s armed to the teeth by citizens who increasingly view the other side as immoral individuals with no integrity on politics and elections. Unfortunately, the collapse of Congressional moderates has coincided with a decline in US GDP growth, and that’s not a good sign in the long run.
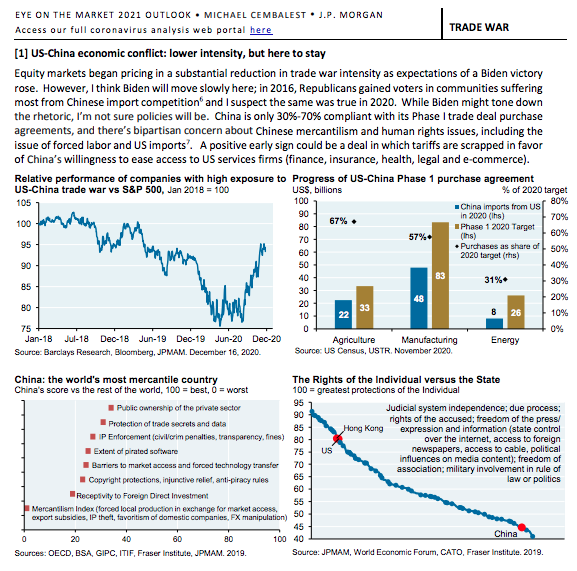
In November 2020, the Trump administration barred US investment in 35 Chinese firms due to their ties to the Chinese military as part of the International Emergency Economic Powers Act. Most were not publicly traded, so this would impact at most 2% of the MSCI China index by market cap. This order is not scheduled to come into effect until mid-January, and might be reversed or softened by Biden or by the courts.
Another part of the divorce agreement: China has written into law that its companies cannot share financials with US regulators without permission from the Chinese gov’t. In response, the US Public Company Accounting Oversight Board now considers its access to Chinese firms listed in the US to be blocked. Congress has passed the “Holding Foreign Companies Accountable Act” which will effectively halt all new Chinese IPOs in the US and put Chinese companies currently listed on a 3-year countdown to delisting. Currently, there are 365 Chinese companies listed in the US, but when measured by market cap, Alibaba represents 39% of that universe.
I do not believe Biden will spend scarce political capital going to bat for China this year, except in narrow circumstances with clear benefits for US workers. So, while we are optimistic on a global recovery next year, the China trade war stocks which have been rallying may run into headwinds. Furthermore, US companies selling to China may eventually suffer from reduced Chinese demand as China restructures its supply chain dependence on the US; i.e., no one wants to be the next Huawei.
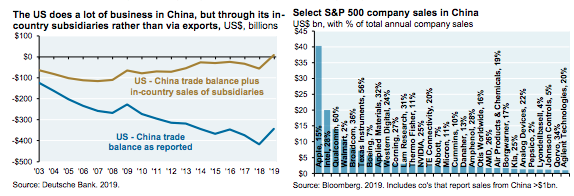
So far, Chinese responses to US sanctions and restrictions have been modest; perhaps China expects to negotiate different outcomes with a Biden administration. To be clear, China has leverage of its own. Over the last decade, US companies made large investments in Chinese subsidiaries. As shown below, the US trade deficit with China disappears once sales of in-country subsidiaries are included. In other words, US companies are doing almost the same amount of business in China as Chinese companies are doing in the US, but through local subsidiary sales rather than through exports. That’s where China has leverage: the ability to make life more difficult for US firms operating in China (i.e., for the companies in the last chart).
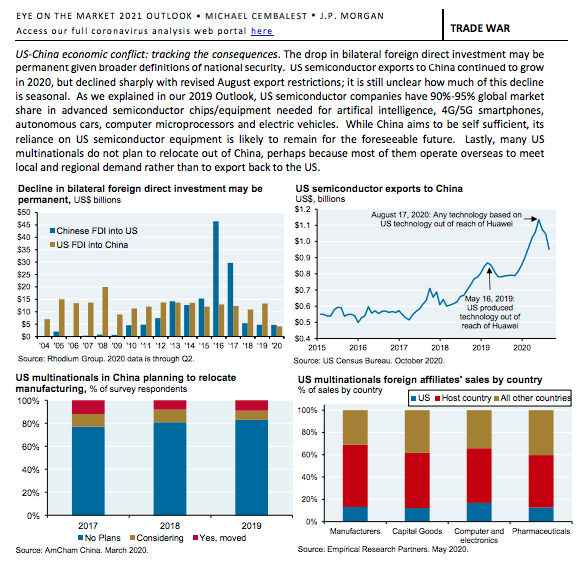
Bottom line: in the absence of a reopening of trade talks, gradual bilateral disengagement is picking up steam and will impact US company earnings in small but measureable ways in the years ahead. US companies with replaceable supply chains and US broker-dealers profiting from Chinese capital raising may be first to feel it; and semiconductor companies may only have a few more uninterrupted years of demand before they’re next.
US-China military conflict: the balance of power has changed
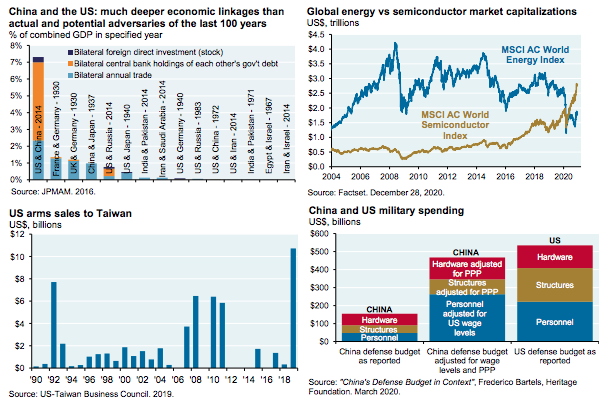
Economic linkages between the US & China are much larger than linkages between other adversaries of the 20th century. The first chart shows the details, and is based on an analysis we pulled together in 2018. The US/China bilateral trade and FDI numbers have fallen since then, but are still material; and this chart also does not measure bilateral sales of corporate subsidiaries discussed earlier. As a result, I’m not convinced by “Thucydides Trap” arguments on the inevitability of US-Chinese military conflict.
Is Taiwan a geopolitical flashpoint that investors should worry about? Some believe the answer is yes. Global markets are now more reliant on semiconductors than on oil/gas, and the Taiwan Semiconductor Manufacturing Company has overtaken Intel’s market cap. As a result, Taiwan’s strategic importance to global supply chains is growing, US-China rhetoric has been deteriorating and in 2019, US arms sales to Taiwan reached their highest dollar figure on record.
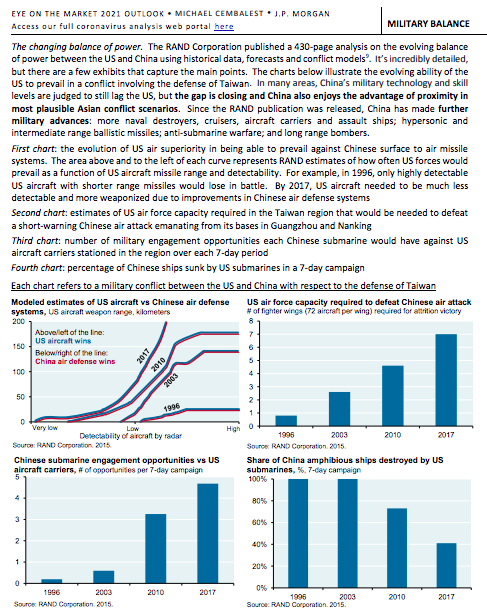
But something else has changed too: the ability of the US to impose its will militarily in the China region. Chinese military spending data is opaque; after normalizing for wage differences and purchasing power, a Heritage Foundation report estimated that China’s military spending is ~90% of US levels. As illustrated on the next page using data from the RAND Corporation, Chinese military spending has changed the balance of power in the region, eroding the ability of the US military to enforce its protective umbrella arrangement with Taiwan. Should China ever challenge Taiwan’s independent status, recent changes in relative power arguably reduce the likelihood of the US being drawn into a conflict it can no longer reliably win.
The global investor underweight to China
At the same time that US-China trade and military risks are at their highest level in years, China’s economy is booming again and its financial opening is leading to continued increases in China’s weight in diversified global index products. We start with equities and then discuss fixed income.
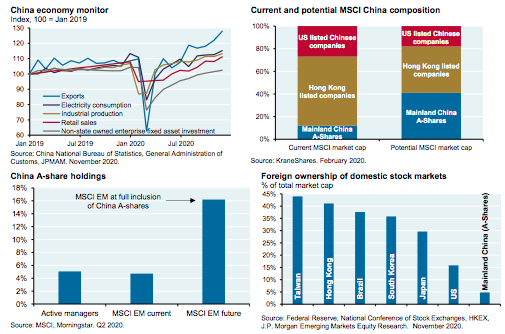
Equities. China is already 40% of the MSCI EM Equity Index, and that’s before further inclusion of A-shares. If A-shares were fully included at their current market cap, China’s weight in the MSCI EM index could rise by 10% or more; the weight of A-shares in the MSCI China Index could grow from 11% to 40%; and A-shares alone could increase from 4% to 16% of the MSCI EM Equity Index. As shown in the third chart, while active managers are roughly market-weight now, this would change as MSCI inclusion rules evolve. The last chart shows how mainland China A-shares have among the lowest foreign ownership rates of major world equity markets.
Recent events: Ant Financial IPO, antitrust and a state owned enterprise default. Gavekal Research (HK) believes that the Ant Financial IPO termination, Chinese antitrust measures announced against Chinese tech firms and an SOE default in the coal sector are actually positive signs of pro-active risk management by Chinese regulators seeking to prevent bubbles and a market collapse. I agree with them, particularly when thinking about US regulatory lapses and their market consequences over the last 20 years.
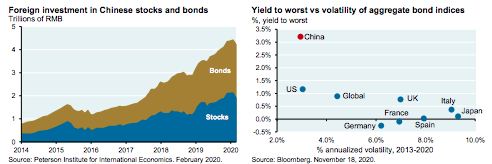
Fixed income. While foreign investors have been buying Chinese government bonds, the 2 trillion RMB added since 2014 only amounts to 2% of China’s total domestic fixed income market (3% if we only include sovereign and financial sector issuers). China’s current weight in the Barclays Global Aggregate is 3% and will rise to 6% upon full inclusion. Compared to other liquid global bond markets, China compares favorably with respect to current yield and volatility, and also has a lower duration.
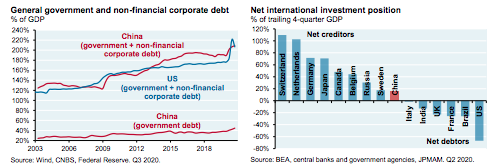
China credit risk. We typically look at gov’t plus corporate debt in China since the division between Chinese public and private debt is blurred (debt of state owned enterprises can be considered corporate debt and/or a liability of the gov’t). However, even though China’s overall debt levels are just as high as the US, Chinese debt is owed mostly internally rather than externally. The last chart shows Net International Investment Positions, which measure each country’s stock of foreign assets less foreign claims on that country’s assets. China is still a net creditor nation, in contrast to the US. Another way to illustrate the same concept: net external debt to GDP is 95% in the US and just 15% in China. In other words, while China is an emerging market for equity investors, it is usually considered a developed market for fixed income investors.
Why does the US equity market keep outperforming Europe and Japan?
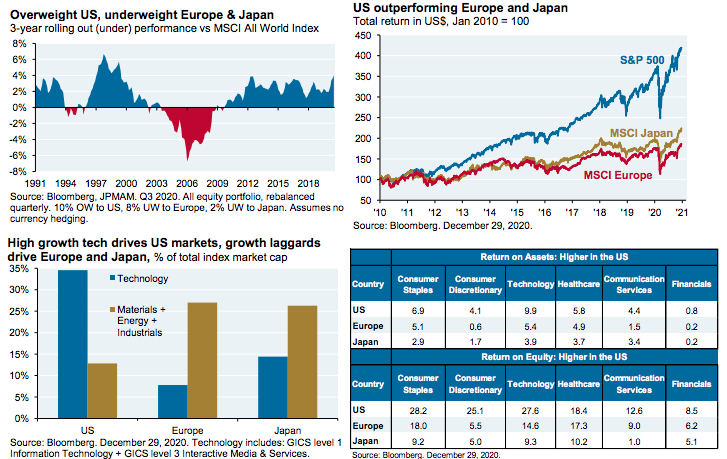
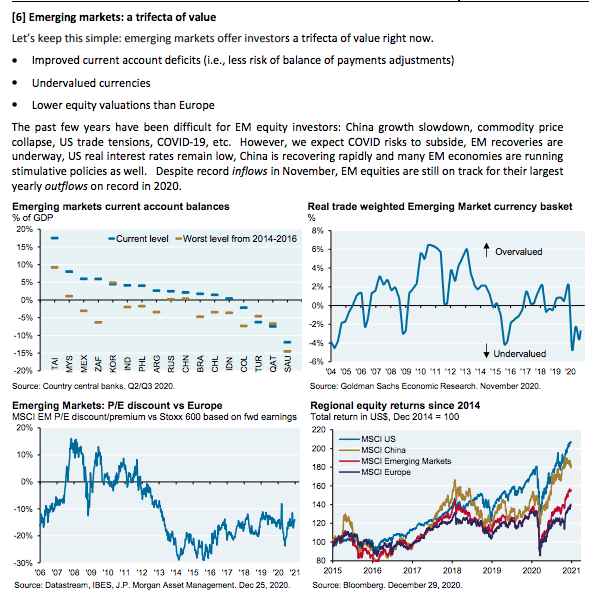
When someone tells you they’re making a contrarian recommendation to overweight Europe or Japan vs the US, be sure and ask them how many times they made the same recommendation before. Why? Because they were probably wrong when they did. As we have illustrated multiple times, a strategy to overweight the US and Emerging Markets vs Europe and Japan has been one of the most consistently successful asset allocation approaches I have ever seen, and it worked again in 2020. Since January 2010, US equities generated total returns of 319% vs 124% for Japan, 87% for Europe and 73% for Emerging Markets.
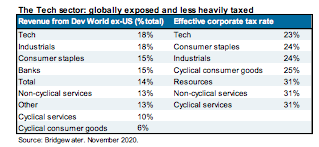
Why has the US consistently outperformed Europe and Japan? The most plausible reasons have more to do with micro than macro11. Think about where the largest equity market gains often come from in a low-growth world: the Tech sector, rather than sectors with lower and more volatile earnings growth (Basic Materials, Energy, Industrials). In the US, the Tech sector’s weight is higher than the other three, while the reverse is true in Europe and Japan (3rd chart). And when we look within sectors, US companies generally have higher profitability than their European and Japanese counterparts (table); this is a very telling and important comparison, and might be the best explanation of all.
What are negative policy rates doing for European banks? Nothing good
European bank equity returns and valuations have trailed the US since negative policy rates began in 2014. We don’t know the counterfactual, and perhaps the ECB would argue that without negative rates, the region would be in even worse shape with rising corporate defaults making life even worse for banks. Whatever the case, negative rates have been a headache for bank investors in Europe, and it doesn’t look like they’re going away.
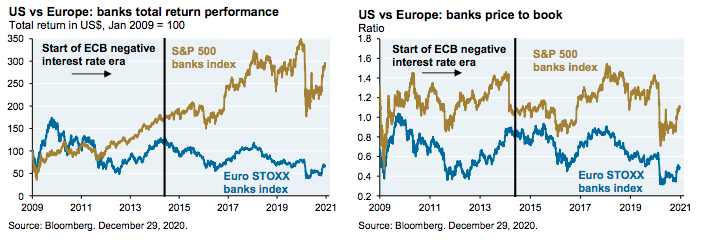
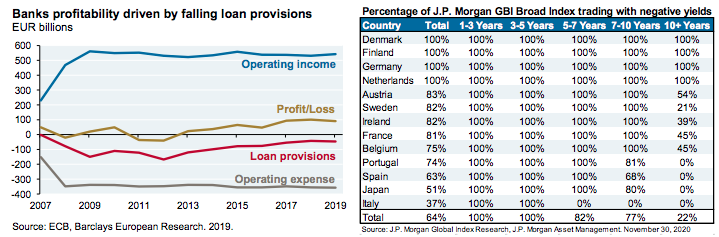
The rise in European bank profits in the last couple of years is almost entirely due to reduced loan loss provisions, rather than resulting from rising operating income or falling operating expenses. In other words, this is not an organic increase in bank profits. As long as substantial parts of the European yield curve are negative (see table), I don’t really see how this will change much.
Whether negative rates are a symptom, a disease or a cure, I hope they never emigrate from Europe to the US. Princeton economist Markus Brunnermeier believes in a “reversal rate”: a tipping point beyond which damage to banks from further rate reductions outweigh benefits to the economy, in which case more easing becomes contractionary rather than stimulative. In other words, as bank profitability falls, their ability to generate new capital deteriorates, which undermines their ability to make new loans.
Antitrust enforcement: coming to a tech company near you
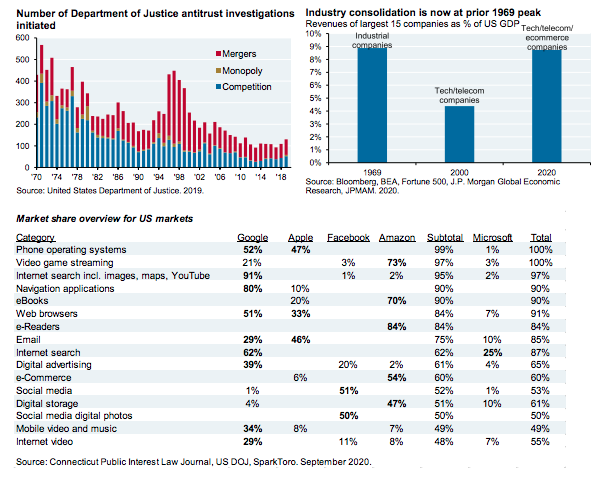
On page 9, we illustrate how critical the Big 5 stocks are with respect to overall US market capitalization and returns. That’s why we’re paying so much attention to signs of a rebirth in antitrust enforcement, which had fallen to a postwar low by the end of 2017. In addition to the DoJ Google lawsuit, we are also following: State Attorney General filings against Google for reasons that differ from the DoJ case; consumer rights advocate class action lawsuits for data privacy reasons; risks that Section 230 is revoked or amended (Section 230 provides indemnity against comments posted or censored); and the Facebook antitrust lawsuit filed by the FTC which seeks to force FB to unwind its acquisitions of WhatsApp and Instagram.
Since US Senate control is still unclear, it’s premature to judge whether the October 2020 House Judiciary Report on antitrust (which reflected the majority Democratic view on the committee) will gain traction in Congress. Republicans disagree with many of its conclusions and remedies, and if the GOP controls the Senate this report will be nothing but a wish list. Even so, it provides a window into how the antitrust debate has been shifting and what long-term risks are for antitrust targets. We dig into the details of this report on the next page, and into the details of the DOJ Google lawsuit on the page after that. We conclude with a discussion of digital service taxes applied by other countries to US tech firms.
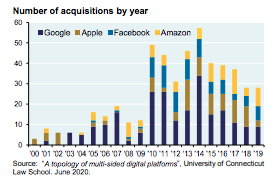
October 2020 House Judiciary Report on anti-competitive tech behavior
Facebook, Google, Amazon and Apple were cited in a House Judiciary Report released on October 6th for making acquisitions that stifle competition (“killer acquisitions”12), using market power to raise prices, misappropriating third-party data, stealing intellectual property and acting as market gatekeepers (i.e., controlling and serving a marketplace at the same time). The report’s conclusions discard the “consumer welfare” standard that has guided antitrust enforcement over the past 40 years. Some firm-specific conclusions in the report:
- Facebook: social networking monopoly power that results from Facebook using superior market intelligence to identify nascent competitive threats and then acquire, copy, or kill them
- Google: online search and search advertising monopoly that is the product of anticompetitive behavior which includes undermining competition, misappropriating third-party data, and establishing their software as the default on most of the world’s devices and browsers
- Amazon: durable market power in US online retail which results from acquiring competitors and abusing relationships with third party sellers beholden to Amazon, and from using control over the marketplace to
- find where its third party partners are doing well and copying their products to drive them out of business
- Apple: significant and durable market power in mobile operating system market resulting from its control of all software distribution to iOS devices
House Democrats favor a wide range of policies to combat these practices, listed below. The GOP does not agree and only favors a small number of them (highlighted in red). If Democrats win both GA Senate seats and jettison the filibuster these proposals would face a lower 51-seat Senate hurdle to pass, but it is not clear that there’s unilateral support among Democrats for these policies. In any case, antitrust heat on tech may increase given greater Congressional scrutiny and a rejuvenated Department of Justice.
- Restoring competition: Glass-Steagall legislation for the tech sector (break up lines of business), rules to prevent discrimination and self-preferencing, merger prohibition, safe harbor for new publishers, prohibition on abuse of bargaining power and rules on data portability/interoperability
- Strengthening antitrust law: Reassert anti-monopoly goals of antitrust law, strengthen Section 2 of the Clayton Act (price discrimination), strengthen Section 7 of the Clayton Act (acquisitions that foster monopolies), restore enforcement Agencies to full strength, increase private enforcement
United States vs Google key issues
- The Justice Department case is not focused on Google’s search engine or advertising revenue dominance, in contrast to the centrality of such issues in European antitrust investigations. Instead, the DoJ case focuses on Google’s exclusivity arrangements with its distributors. Google pays billions of dollars each year to device manufacturers (Apple, Motorola, LG, Samsung), wireless carriers (AT&T, T-Mobile, Verizon) and browser developers (Mozilla, Opera, UC Web) to secure default status for its search engine. In the case of Apple, the DoJ claims that 15%-20% of Apple’s worldwide annual income is derived from Google payments for search engine default status. In some cases, Google prohibits counterparties from dealing with its competitors, and requires placement of Google Apps in prime positions on devices
- A key concept from a speech by Assistant Attorney General Delrahim in 2019: “even if a company achieves monopoly position through legitimate means, it cannot take actions that do not advance plausible business goals but rather are designed to make it harder for competitors to catch up
- Google has responded to such arguments by comparing its payments to distributors to cereal companies paying supermarkets to stock its goods on the best eye-level shelving. However, cereal consumption does not result in self-reinforcing market dominance. Google employs complex algorithms that learn which results and ads best correspond to user searches, and the more they do this, the better they get at it
- Some DoJ allegations about Google rhyme with antitrust arguments levied against Microsoft 20 years ago, such as restrictions Microsoft placed on equipment manufacturers to ensure installation of Internet Explorer and to suppress alternative operating systems. Currently, some antitrust analysts believe that Google and Apple impose restrictions on device manufacturers and App developers that have nothing to do with
- technical limitations or consumer security, and are instead designed to preserve market dominance
- There’s a complicating factor: the online world involves duopolies instead of conventional monopolies. For example, Google/Facebook dominate digital advertising, Microsoft/Amazon dominate the cloud, Amazon/Google dominate shopping searches, and Microsoft/Google dominate productivity applications. As a result, the companies involved can mount vigorous defenses against monopolistic practice charges. Many of these duopolies can be seen in the table on the bottom of page 25
- How any given judge will rule on the case is unknown, but the DoJ case increases the risks for the big 4 tech and social media stocks that account for a growing share of market returns
Additional risks: Digital Service Taxes targeting US tech giants gaining momentum
The US tech sector is facing digital service taxes (DST) on revenues paid to them by European advertisers. Tired of waiting for the OECD’s “Pillar I” tax proposals to be sorted out, the UK, France, Spain, Italy and Austria have enacted DSTs of their own. The logic is based on a concept called “user-created value”: since users of services like Facebook contribute to brand value by providing information to the company which enables it to earn ad revenues, users are undertaking so-called “supply-side functions” that would normally be undertaken by the business itself. Ergo, the jurisdiction in which users reside may tax this value as it is created, using locally generated ad revenues as a proxy. What concerns the EU: Facebook’s tax bill for 2017 in France was less than 2% of that charged by low-tax Ireland (FB’s European HQ), despite FB having 10 times more French users than Irish ones. DSTs would be paid by a company in addition to whatever income or consumption taxes the company is already paying in Europe.
A 2019 IMF paper described the theoretical underpinning of DSTs as problematic, and the Petersen Institute described DSTs as de facto tariffs discriminating against US firms. European governments have drafted language that avoids conceding that they are taxing consumption of US services exports, which are de facto tariffs that may violate existing bilateral tax treaties. The French Finance Minister said that its DST does not “single out US companies”, but…
- Given high worldwide revenue thresholds France uses in applying digital advertising taxes and revenues that they apply to, US tech giants (GOOGL, FB, AMZN, EBAY, UBER, ABNB) are practically the only entities subject to them. Subscription fees and in-app purchases are excluded by France, which could have affected European firms. French officials stated that the DST was explicitly designed so as to avoid slowing down e-commerce innovation and the digitization of France’s own businesses
- The French DST is applied to gross revenues rather than net income, resulting in double (or triple) taxation which contravenes the architecture of the international tax system in the developed world. Some DST proposals allow for VAT taxes to be deducted, another swipe at US firms that are not subject to them in their own jurisdiction
In 2019, the US countered with a proposal to tax marketing of intangibles (one that would also tax EU firms). The OECD tried to merge US and EU proposals, and then negotiations fell apart with COVID. In early 2020, the Trump administration threatened tariffs on French luxury goods if DSTs were not withdrawn; eventually Trump and Macron agreed to a truce and postponed tariffs and DST collections to the end of 2020 to allow more time for multilateral talks, though with the OECD talks currently stalled France recently demanded payment of 2020 taxes from US digital firms. Other European countries including Belgium, the Czech Republic and Hungary announced plans to impose digital taxes, and a high-level summit on an EU-wide digital tax is currently scheduled for March 2021. The US is expected to retaliate against French digital taxes by imposing tariffs on French goods; how the US, the EU, the OECD and the WTO will resolve this is unclear.
The US faces pressure to back down and agree to digital taxation given EU momentum and digital taxes adopted unilaterally by non-European countries including India, Indonesia, Mexico, Turkey, and Pakistan, and the recent announcement that Canada will impose a digital tax starting in 2022. As countries adopt their own DSTs, the outcomes are important given the low effective tax rate of the US tech sector, its high degree of foreign-sourced revenue, and the potential for greater disruption from trade wars if and when the US retaliates with tariffs.
For the complete report, please click the following link!


