

Research Report Excerpt #1
Remember, the Nasdaq is mainly a growth index, holding no banks or financial sector stocks to-date.
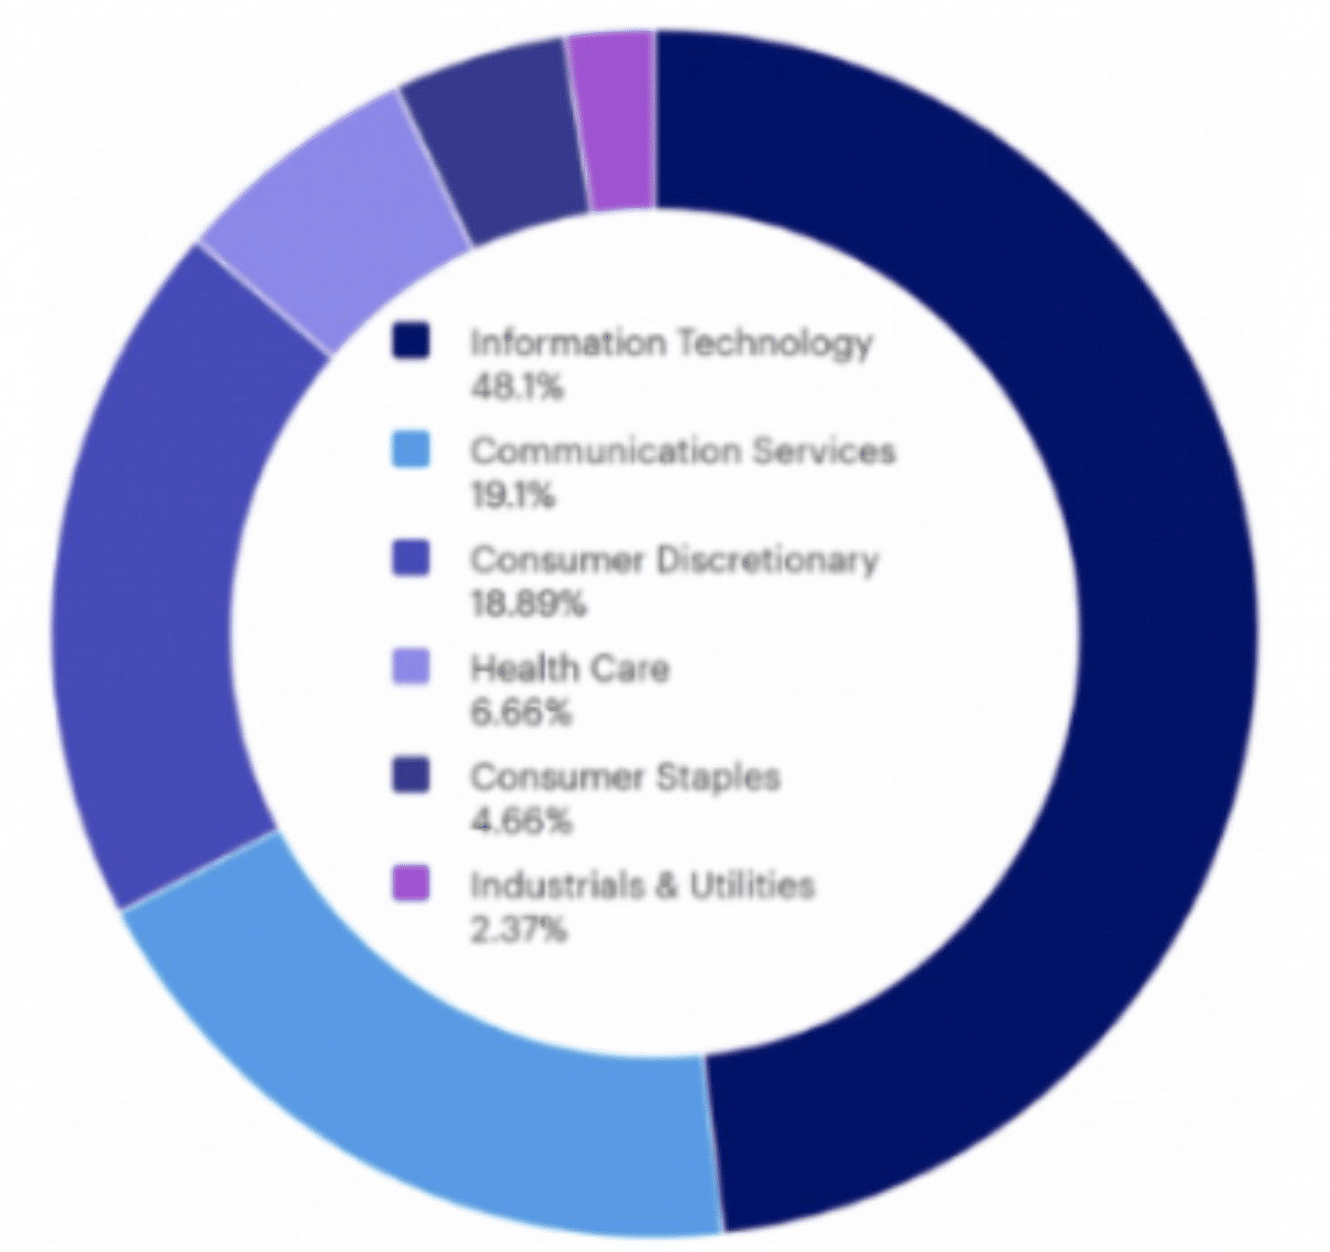
The Nasdaq is also very top-heavy; 48% of the index maintains Information Technology stocks. For comparison, Information Technology (XLK) is 27% of the S&P 500’s composition. In 2022, investors flocked to “Value” stocks and out of Nasdaq/Growth/Technology stocks, which has been turned on its head in 2023.
Research Report Excerpt #2
Most stocks have been trending lower while the indices have at least stabilized with gains this past week, but for how long?
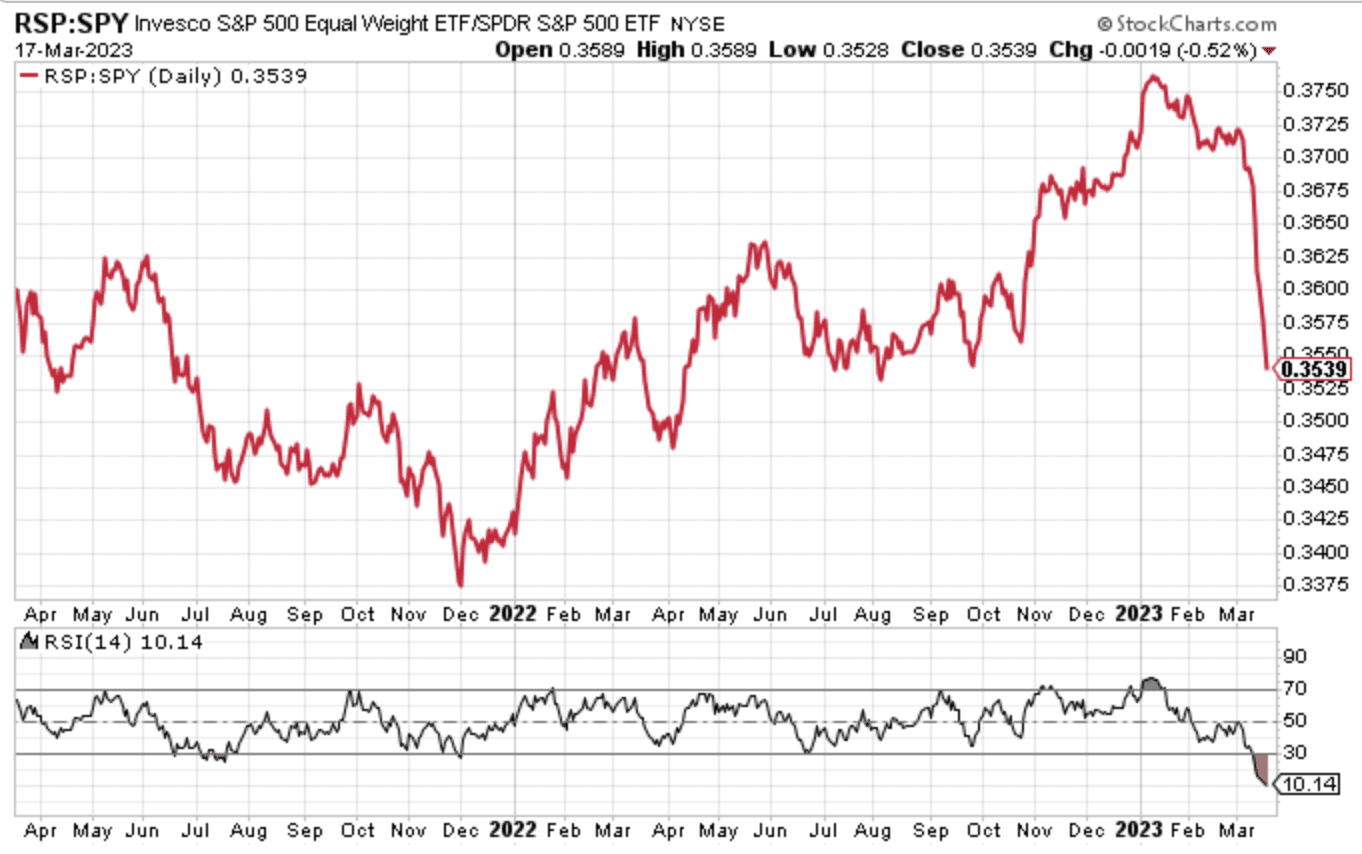
To better decipher that just a couple of handfuls of large-cap Growth/Tech stocks have been holding the markets up, we can take the cap-weighted index ETF (SPY) and compare it to the equal-weighted index ETF (RSP), as shown in the above chart. For dramatic effect, we flipped the ratio to show just how poorly the equal-weighted stock ETF has performed relative to the cap-weighted ETF. In the same manner we understand nothing goes up in a straight line, we should also recognize that nothing tends to go down in a straight line… but it certainly looks that way. And in the same manner, once again, the 14-Day RSI of 10 is screaming that the performance ratio is ice-cold and oversold.
Research Report Excerpt #3
If there is one thing we know, it is that if the market is going to make higher highs and all-time highs, stocks have to stop making new lows, and too many stocks have been doing so here in March.
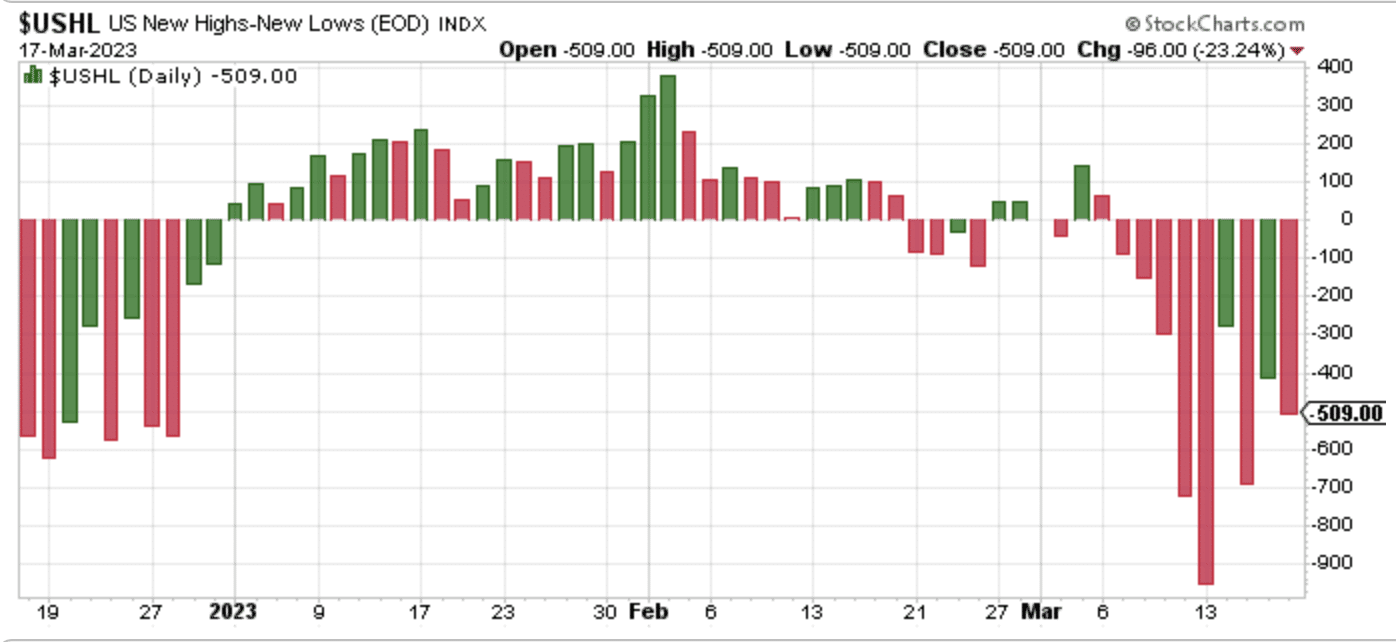
U.S. Total Stock New Highs minus New Lows has been producing Net New Lows (more new lows than new highs on the day) through most of March (right side). While it might look like the number of Net New Lows trough on March 13, 2023, we would like to see a follow through week with even fewer Net New Lows THIS COMING WEEK!
Research Report Excerpt #4
The bearish and bullish divergences from the SMFI charts above offer a great visual aid in how to spot divergences in the future. So the question on your mind right now, as I’ve already articulated a belief that the smart money isn’t hedging to the degree that VVIX and SKEW Index might presume, is what does the SMFI identifies today?
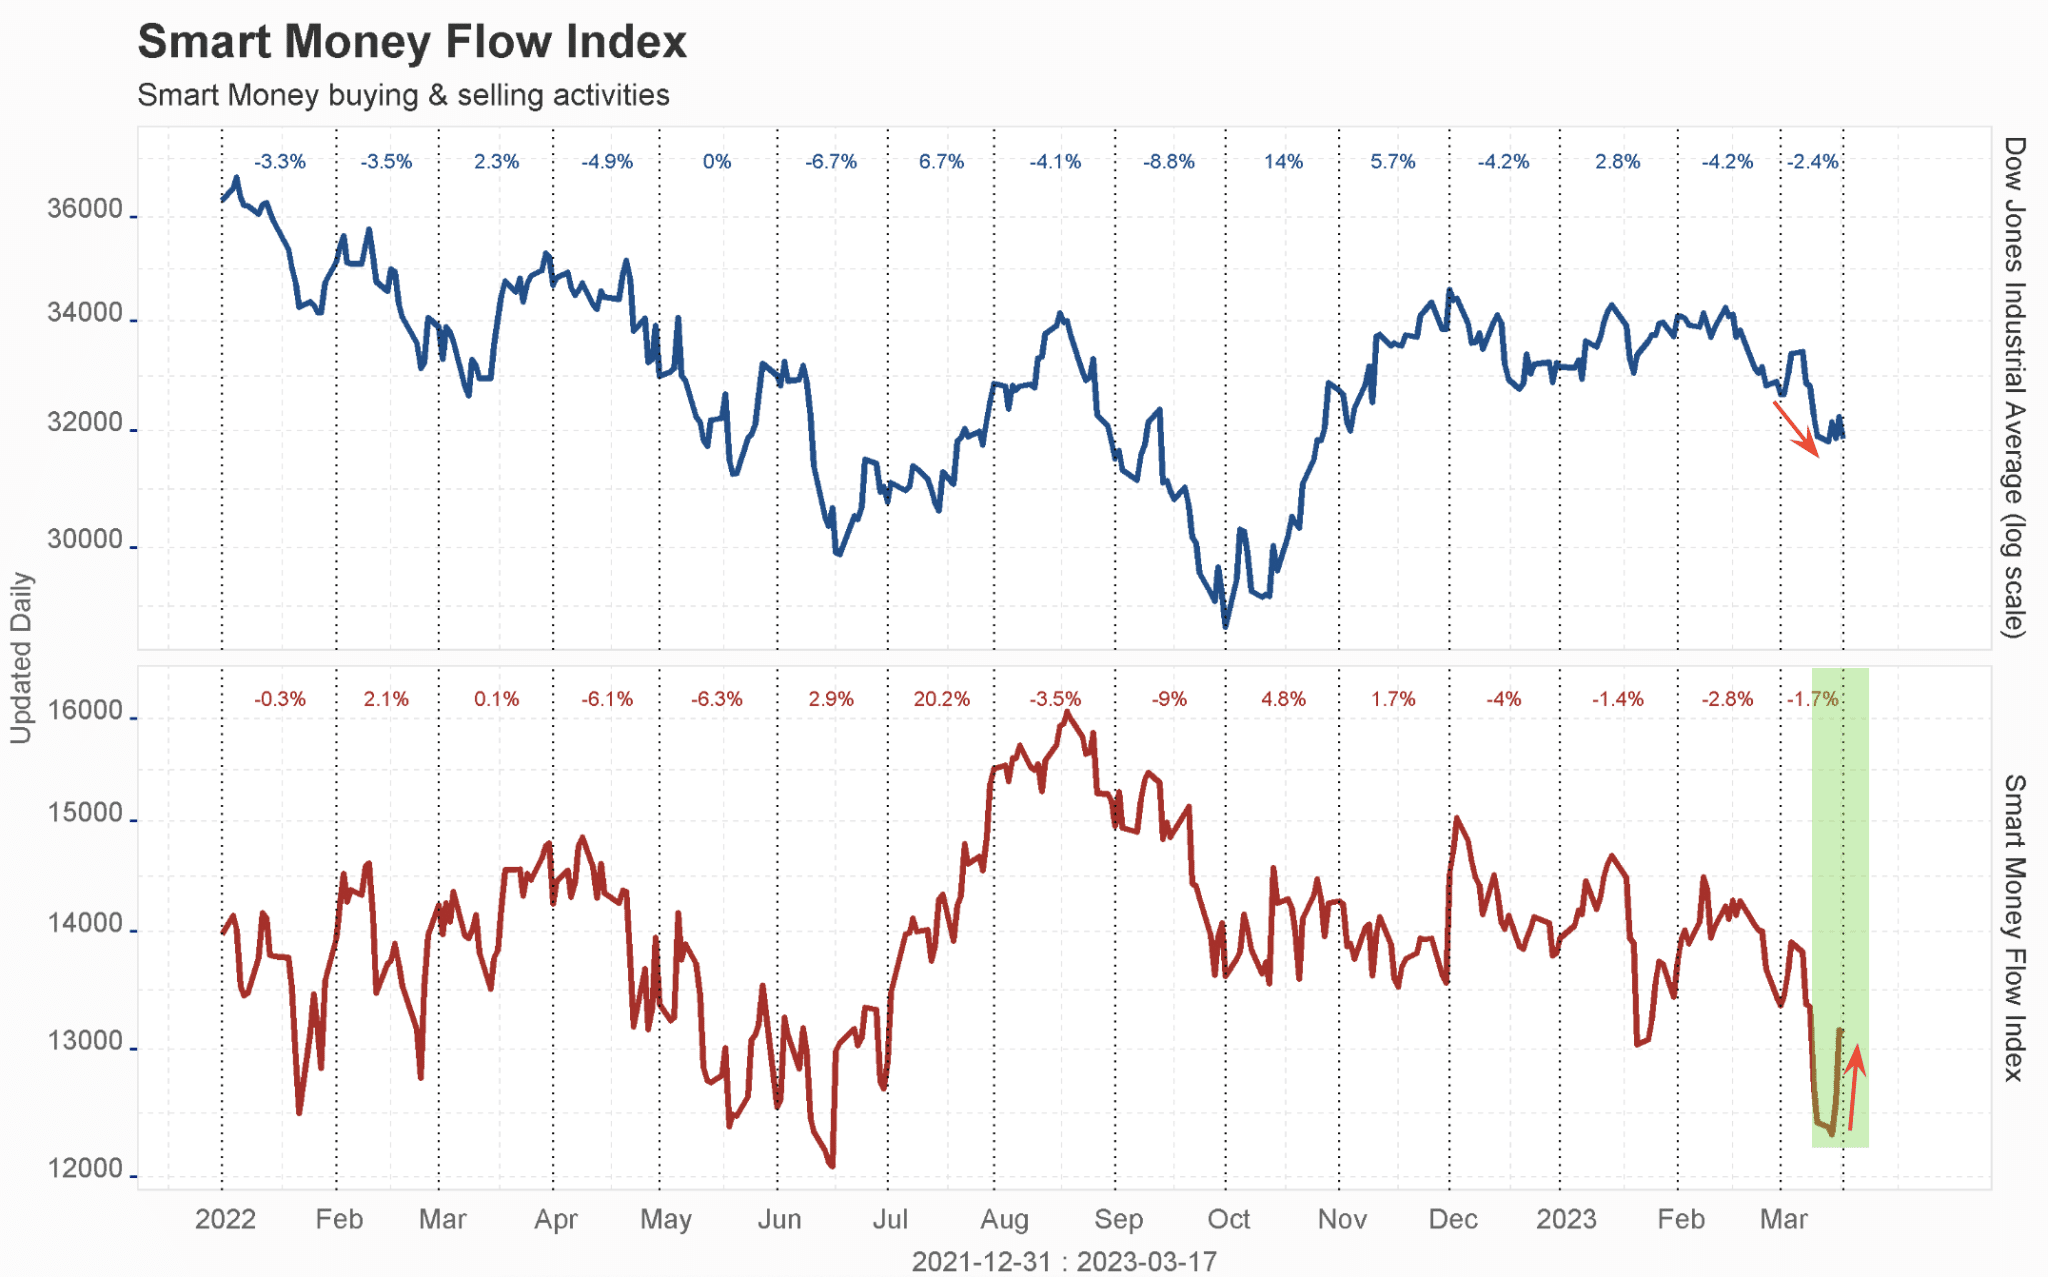
It is extremely, highlight-edly clear, that there is a bullish divergence that has formed within the SMFI this past week.
Research Report Excerpt #5
The ramifications of further rate hikes are apparent, given recent bank failures, and I would think the FOMC has fielded this message loud and clear, based on their recent actions aimed at stemming the tide of bank runs and making whole depositors at the banks which failed.
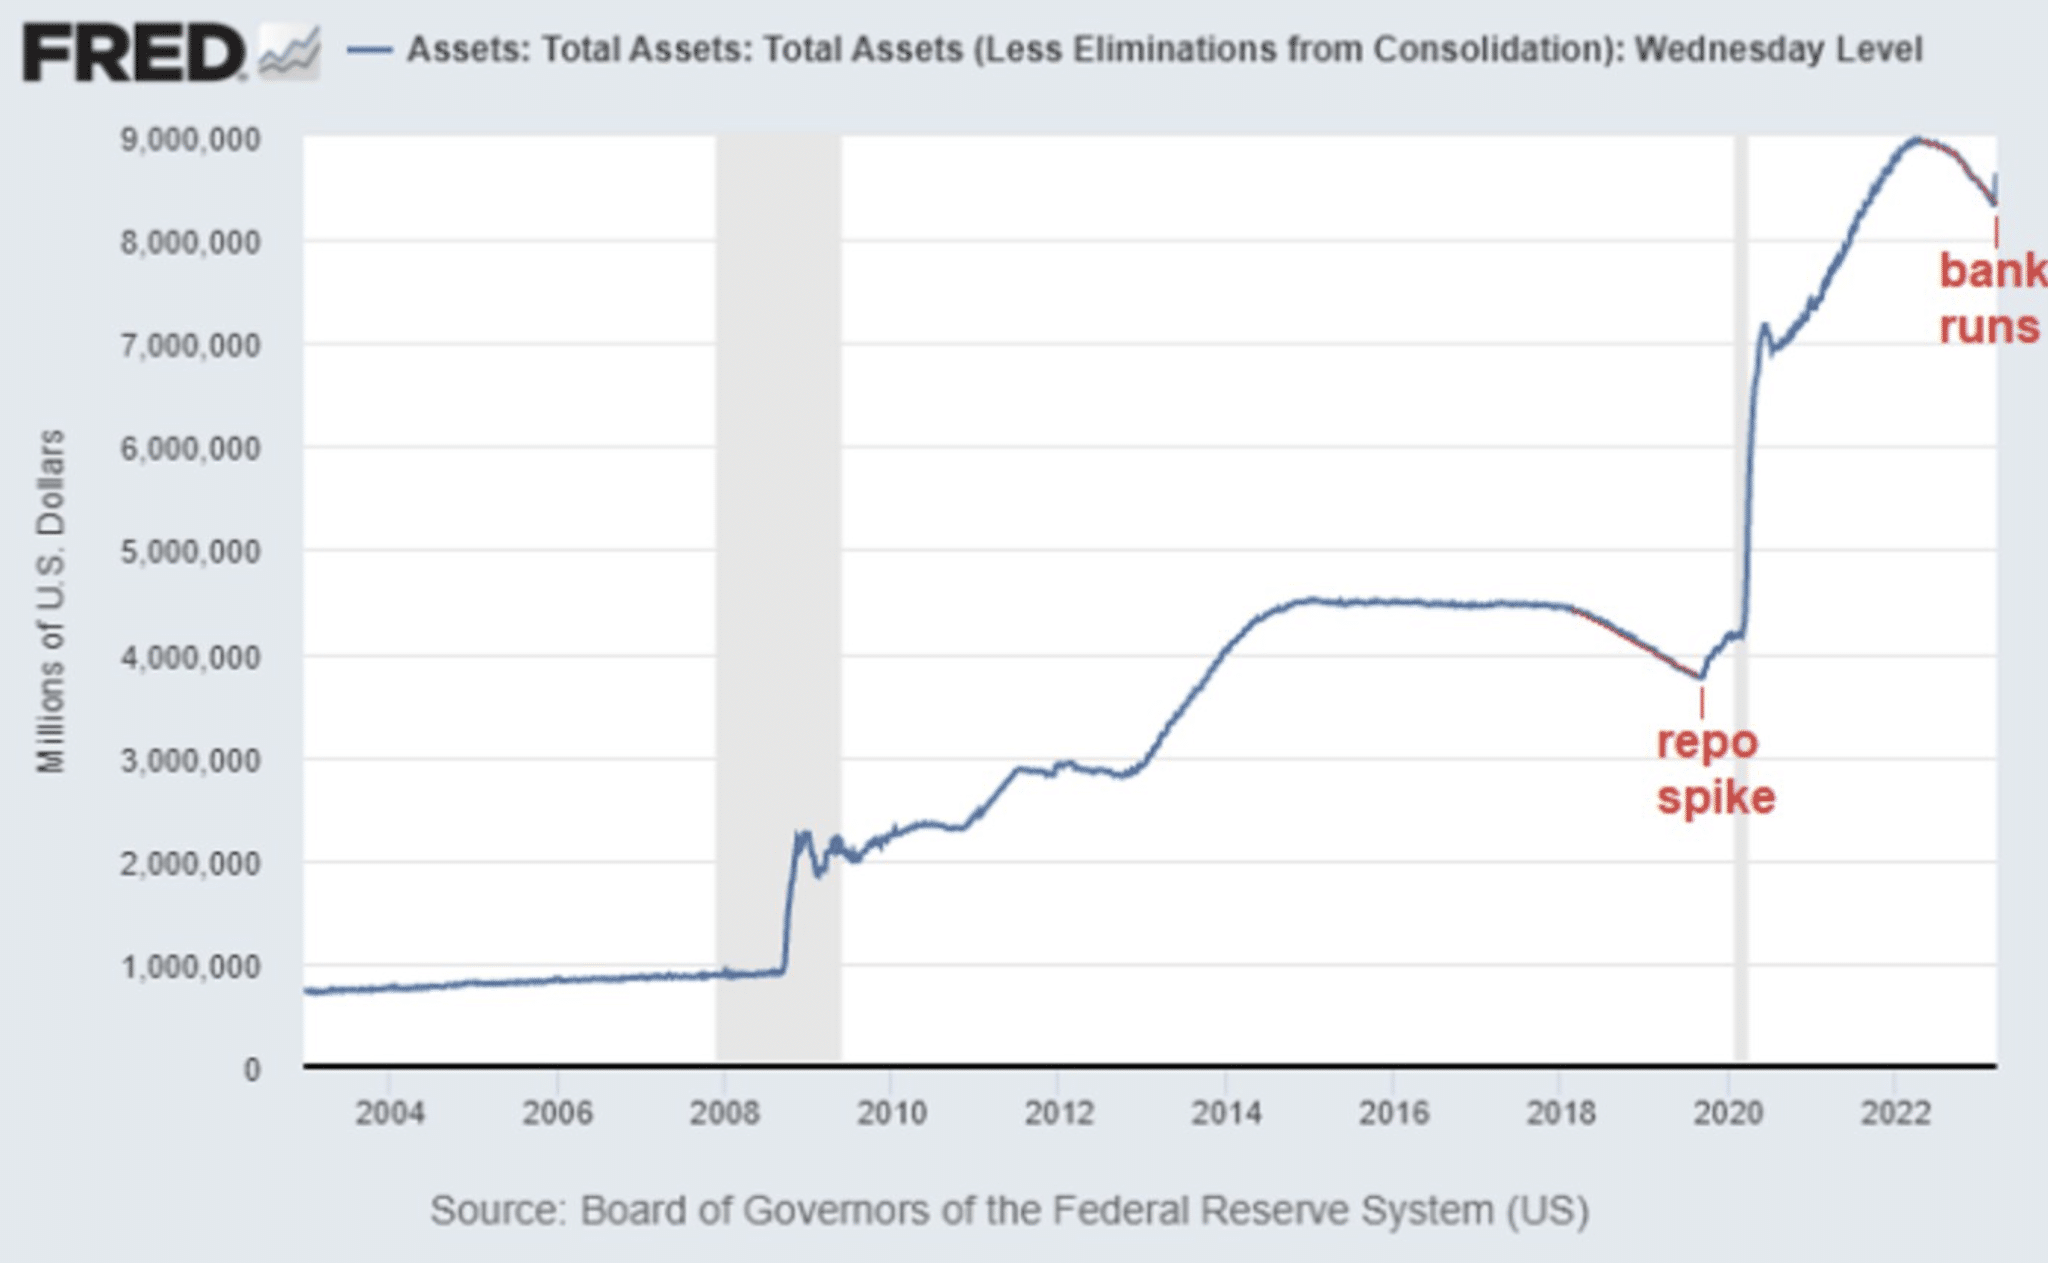
Based on the Fed’s recent actions, this proved the first weekly increase in the Fed’s balance sheet since Quantitative Tightening began in June of 2022.
Research Report Excerpt #6
Please see the notes below from Bank of America’s Michael Hartnett, who remains of the opinion that investors should sell the last rate hike event, as new lows will be achieved for the S&P 500, at least.
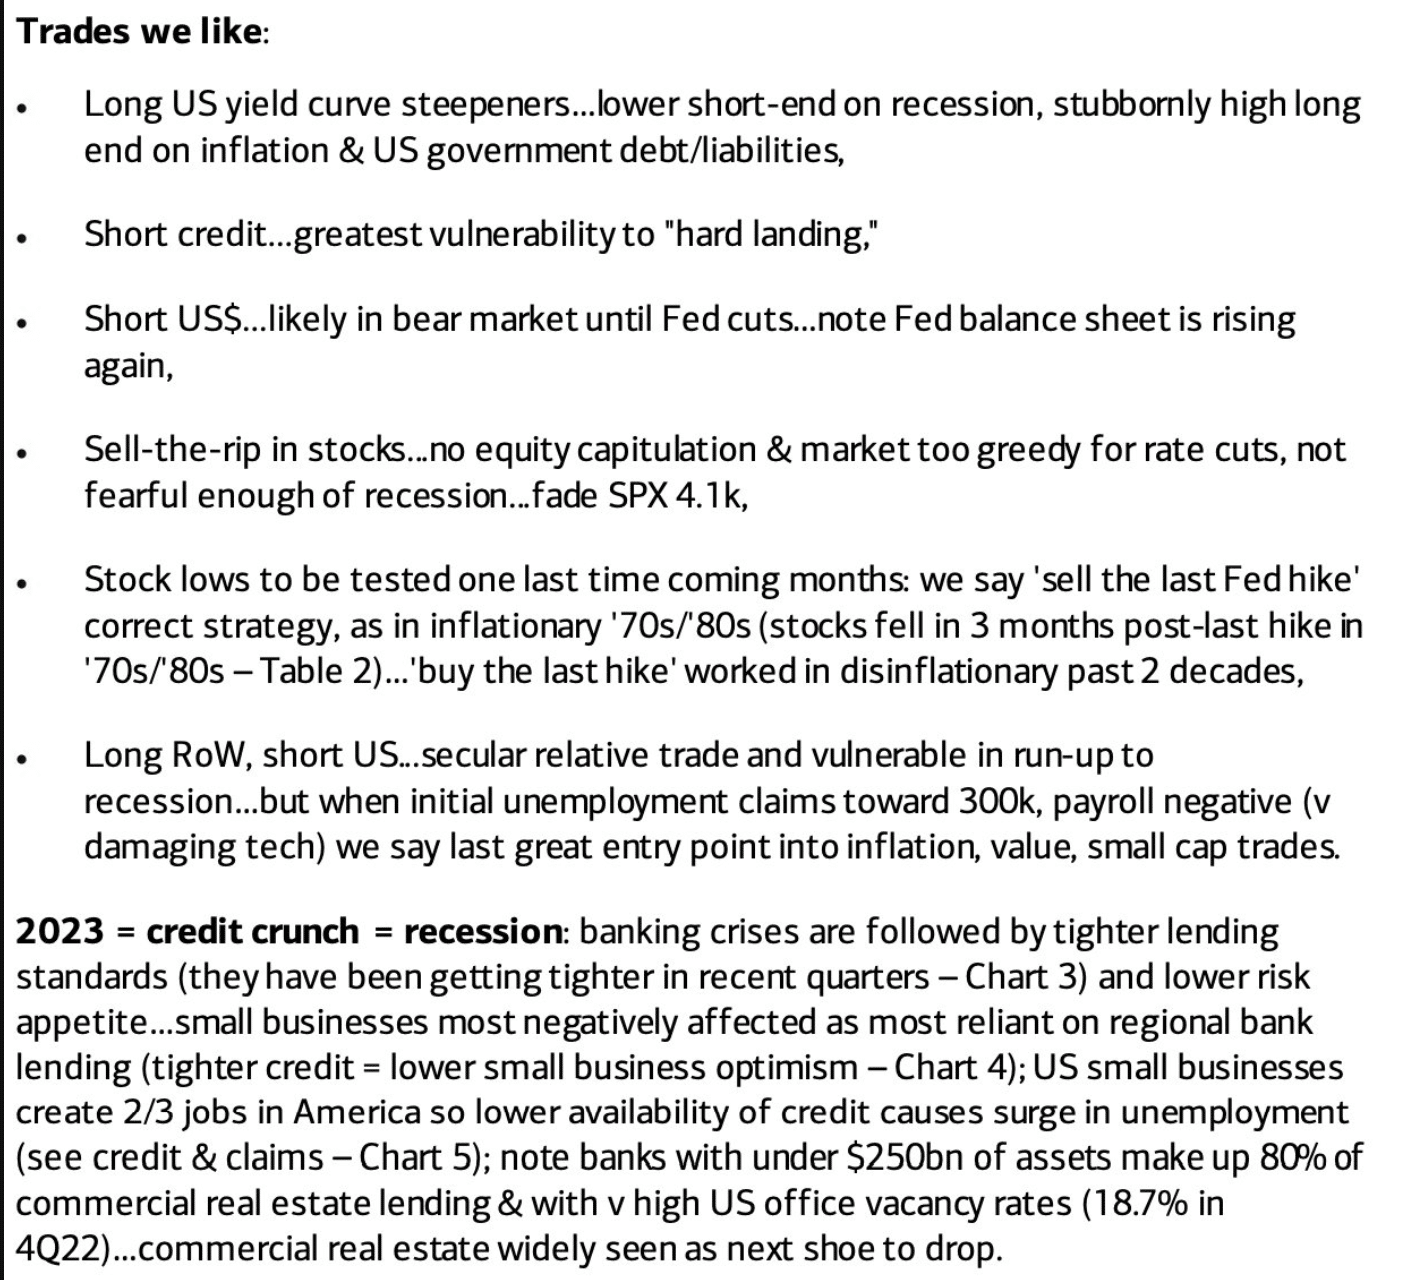
Houston, we have a problem with these notes and the supporting Table 2!  The supposed Date of the Last Fed Hike column is incorrect in all but one inflationary period, 1984. All of the others are incorrect.
Research Report Excerpt #7
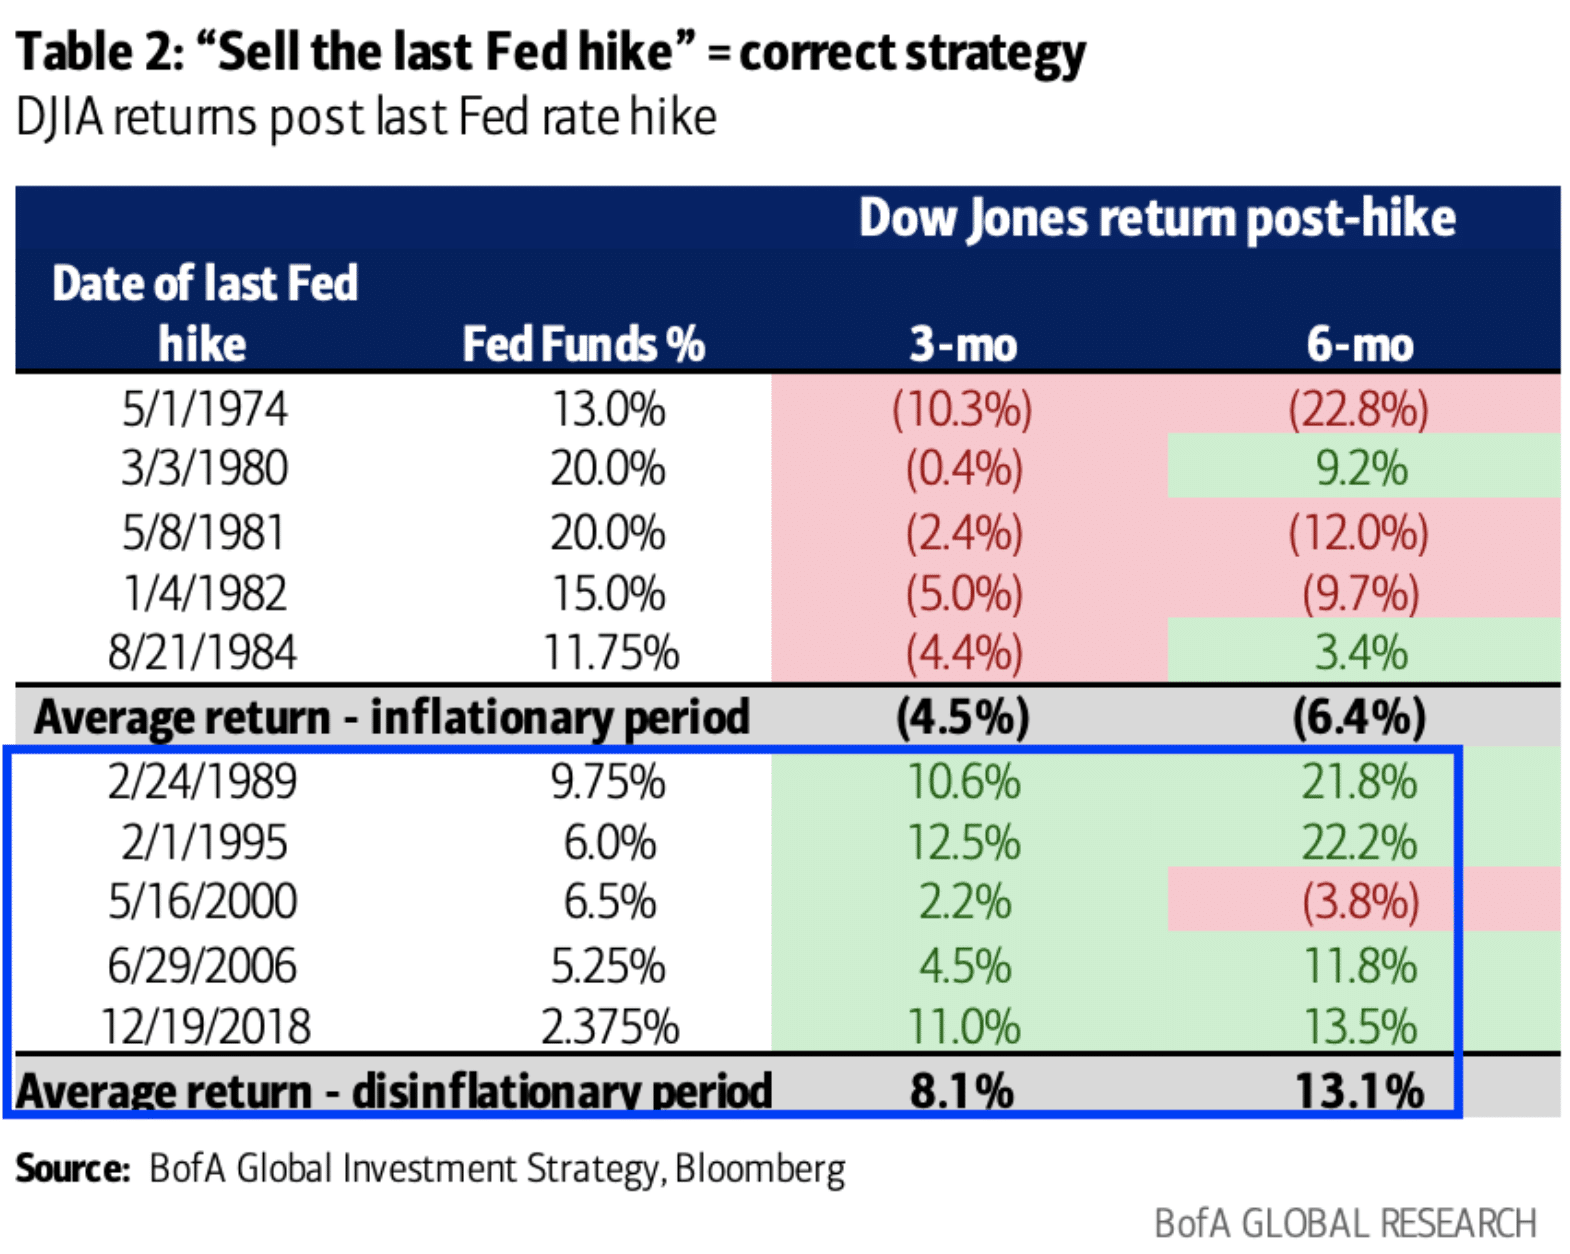
The following chart looks scary when it comes to credit standards tightening, and what mostly populates social media, why so many are in fear today over the subject matter of credit standards tightening:
This is the total Net Percent of Domestic Banks Tightening Standards. What it doesn’t tell us is whether or not it is rising, flat, or falling. At face value it obviously appears to be rising, but how rapidly? The only way we can really tell is by changing the specifications of the study to represent a Year-Over-Year Percent change.
I slimmed down the time frame to represent 1 calendar year, ending February 6, 2023 when the data was last updated by the Federal Reserve Bank of St. Louis. The chart shows the percent change Year-Over-Year now:
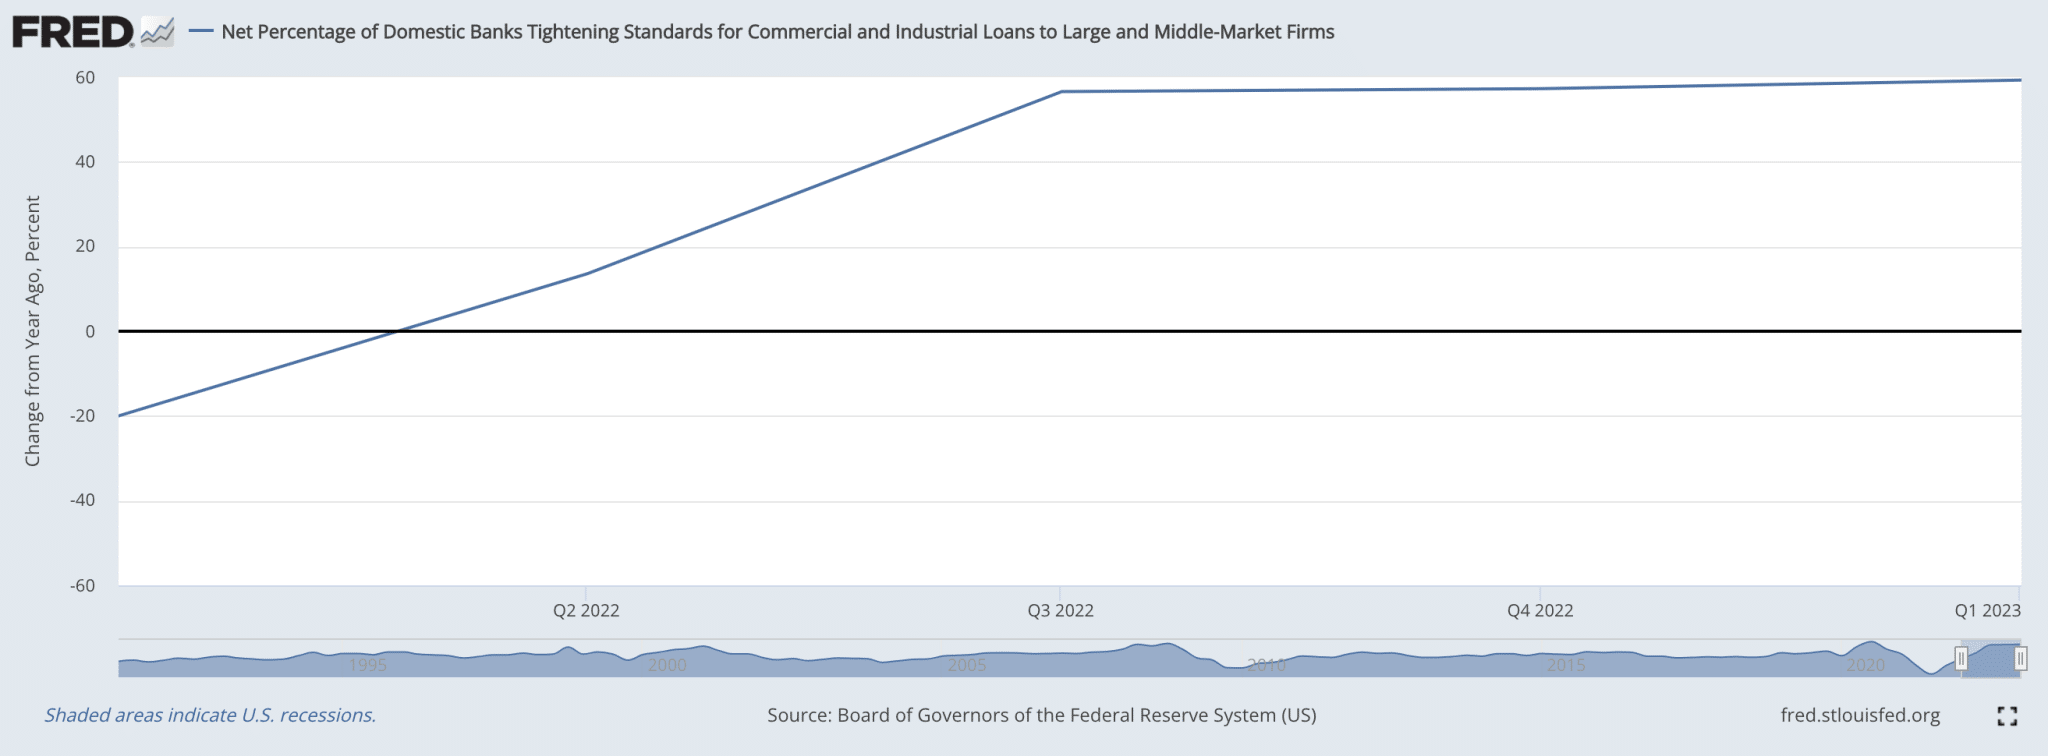
It would appear as though there had been a rapid tightening of credit standards since 2021, which may have reached peak acceleration in Q3 2022, and has since leveled off into Q1 2023.
Research Report Excerpt #8
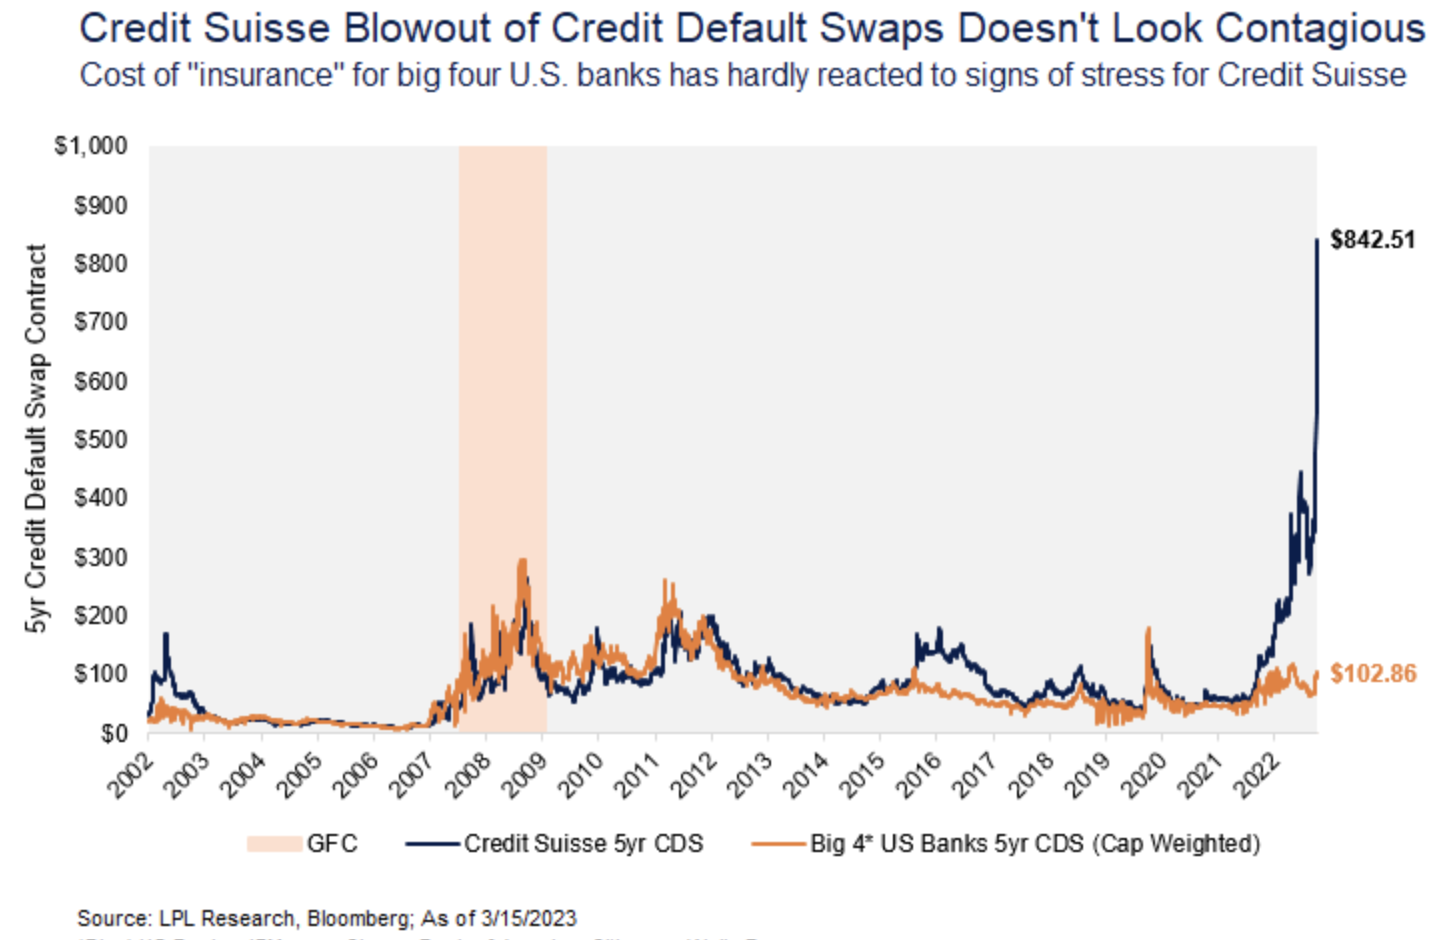
Here is the good news. While Credit Suisse CDS were blowing out, the cost of this insurance for the 4 biggest U.S. banks (by deposit base) has remained relatively calm, matching levels seen in moments of market stress last year, but nowhere near what would be considered crisis levels.
Research Report Excerpt#9
Should they signal a pause in any manner, since the 1980s, here is how the S&P 500 has responded to a pause in rates:
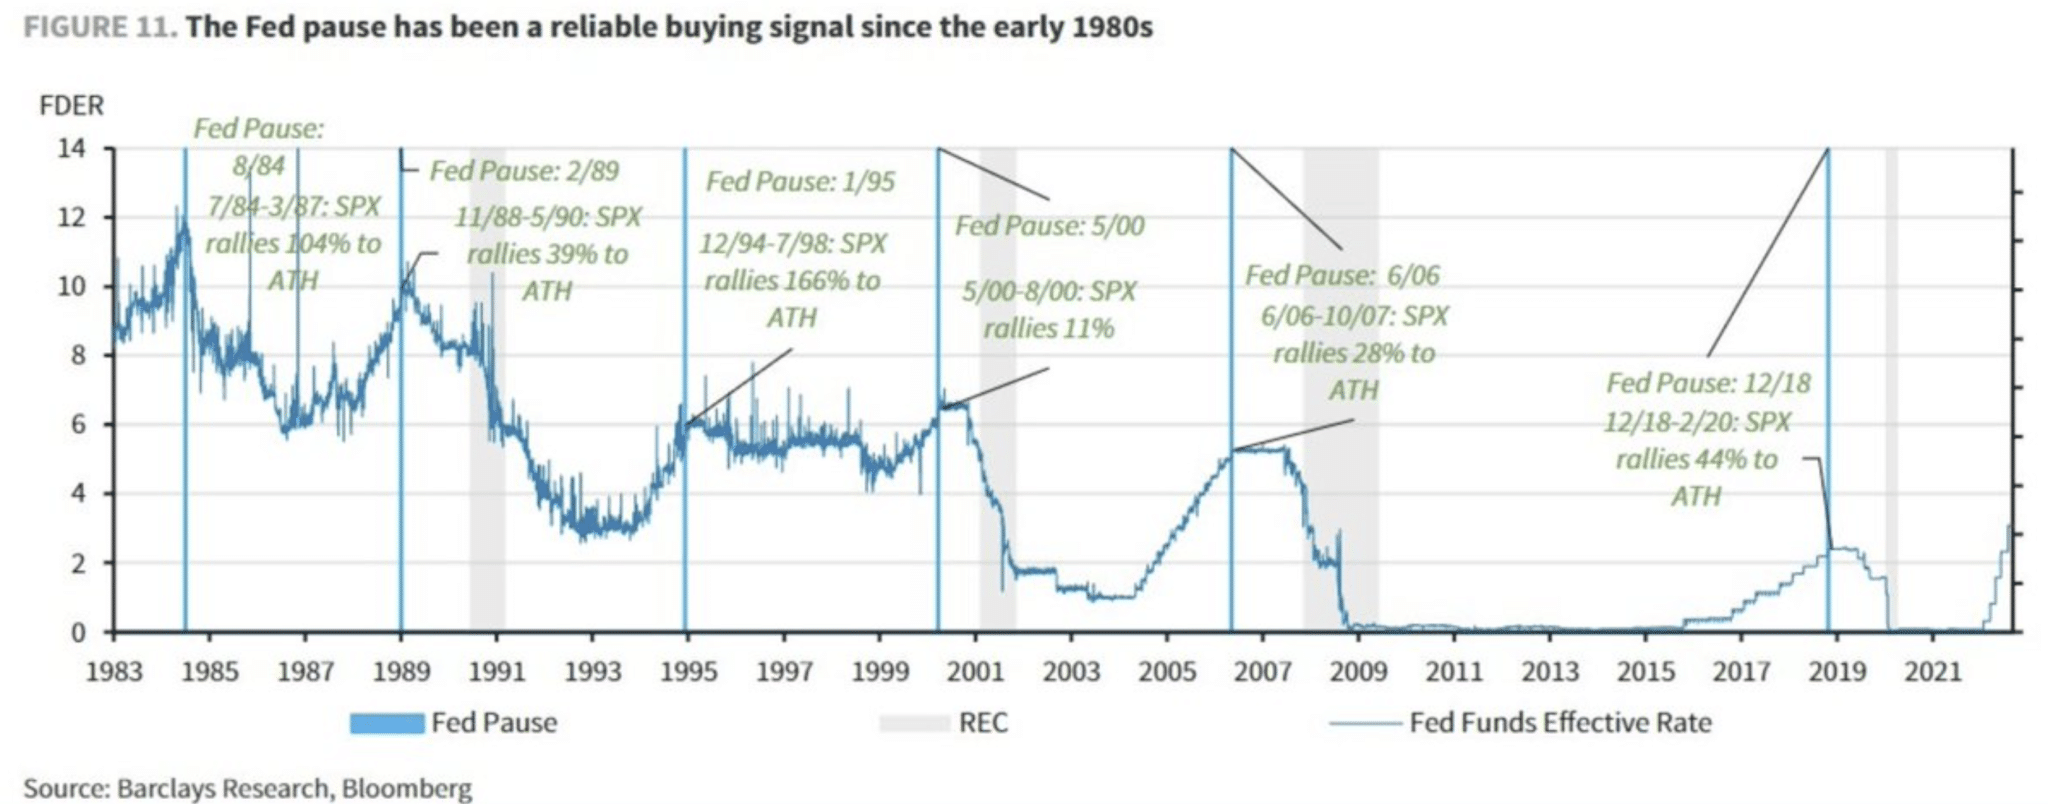
- 7/84 – 3/87 = 104%
- 11/88 – 5/90 = 39%
- 12/94 – 7/98 = 166%
- 5/00 – 8/00 = 11%
- 6/06 – 10/07 = 28%
- 12/18 – 2/20 = 44%
- Since 1954 avg. 12-month return = 14%
- n = 13


