
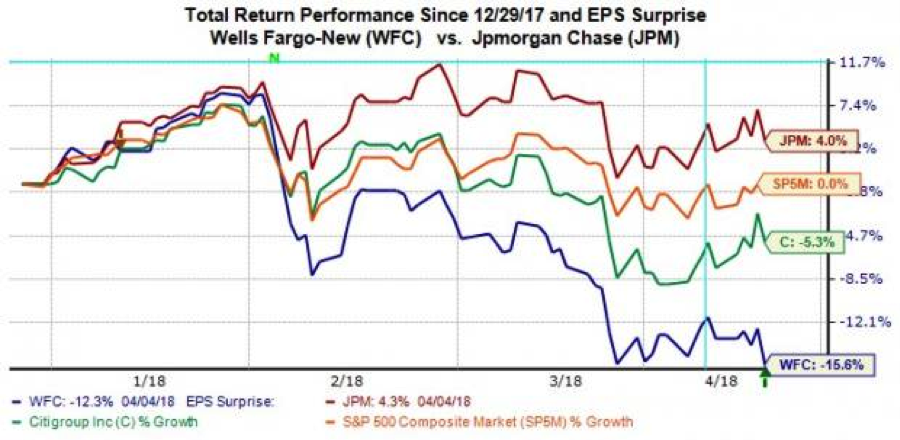
Closing out the 1st week of earnings season found the major averages higher last week. In the wake of earnings results from Citigroup, Wells Fargo, Blackrock and JP Morgan Chase, however, investors found the earnings reports to be a sell the news type of event. While we’re not going to get into the individual reports from each bank, on Friday, JP Morgan Chase said its quarterly profit jumped by more than one-third to an all-time high, helped along by hundreds of billions in tax savings. The banks and financial institutions managed to beat results handily, but found their share prices under pressure shortly thereafter.
So why did the likes of Citigroup, Wells Fargo and JP Morgan Chase sell-off after the release of their respective Q1 2018 results? One basic and understandable reason could be the simplicity of a “sell the news” event. There is also likely a comparability ground for the market’s lack of appreciation for the results as well. Two new accounting rules took effect this quarter, one dealing with revenue recognition on the asset management side and the other dealing with the valuation of ‘hard-to-price’ securities on the balance sheets. This week we’ll have a great more data and earnings reports from the financial sector
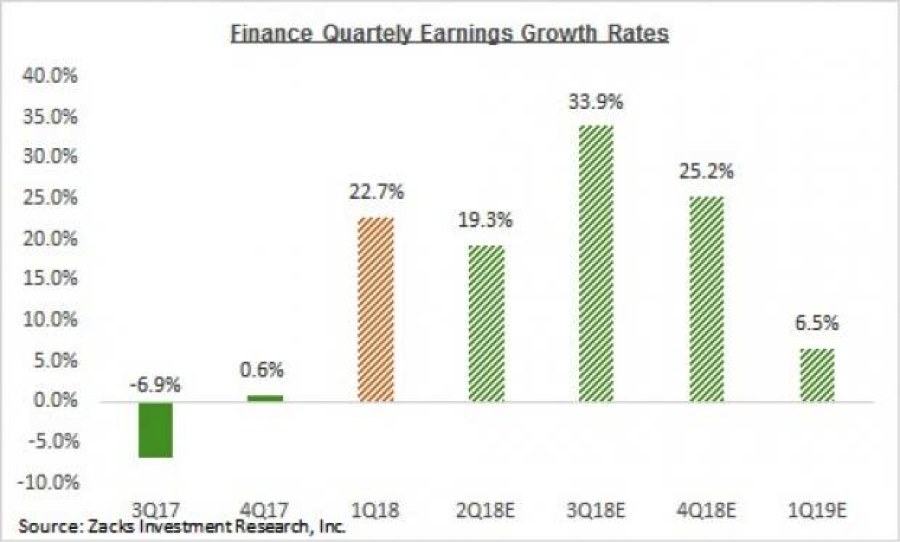
In total, 5 of the 98 financial sector companies have reported Q1 results. Total earnings for these 5 Finance companies are up +20.4% from the same period last year on +6.9% higher revenue growth, with 100% beating EPS estimates and 60% beating revenue estimates. For the quarter as a whole, total Finance sector earnings are expected to be up +22.7% from the same period last year on +4.7% higher revenues. This forecast is a marked improvement from previous quarters and years.
Credit spreads continue to weigh on investor sentiment as a whole for the financial sector, although that factor is greatly improved when compared to early February as spreads hit their highs. The 10-year/2-year U.S. Treasury spread has been narrowing since the market sell-off in equities at the beginning of February. The spread hit a year-to-date high of 78 basis points on Feb. 9 but has since narrowed to 48 basis points.
With the financial sector in focus this week, we now take a look at the market as a whole under the context of valuation. According to data from FTSE Russell and Thomson Reuters, the U.S. stock market was recently trading at its most expensive levels since the dot-com era. This is not an “ah ha” moment as most investors understand the market’s historic valuation and readily justify it based on corporate earnings growth expectations for 2018.
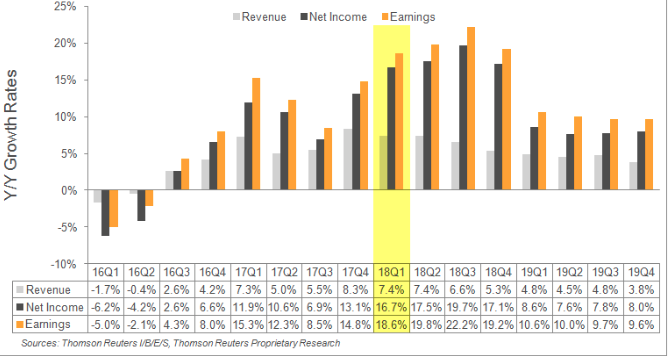
The historic median S&P 500 PE ratio is about 15. The present PE ratio on the S&P 500 stands around 17 presently. Again, while valuation seems stretched and at levels not seen since the dot.com era some 20 years ago, it comes due in part to strong corporate earnings growth expectations. When we take into account that earnings are expected to grow between 16.5% and 18% for 2018, depending on the data tracking firm, one might draw the conclusion that the S&P 500 is somewhat undervalued. If we look at valuations using PEG ratio, based on this metric, stocks have a PEG of 1.2.
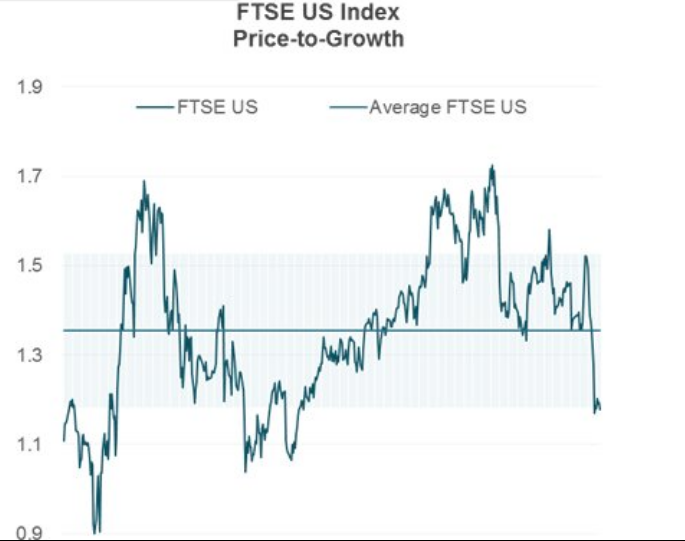
What this means is that the S&P 500 is not only trading one standard deviation below its long-term average of a little more than 1.3, but also at its cheapest level since 2012. That’s a very different consideration than the simplistic historic PE ratio noted above.
The increased levels of market volatility in 2018 have born out the 1st S&P 500 correction in roughly 2 years and an increased bearish equity sentiment among the investor classes. Institutional investors have indicated their views on the market by putting to work their hedging strategies that generally serve to elevate the VIX and with .SPX options.
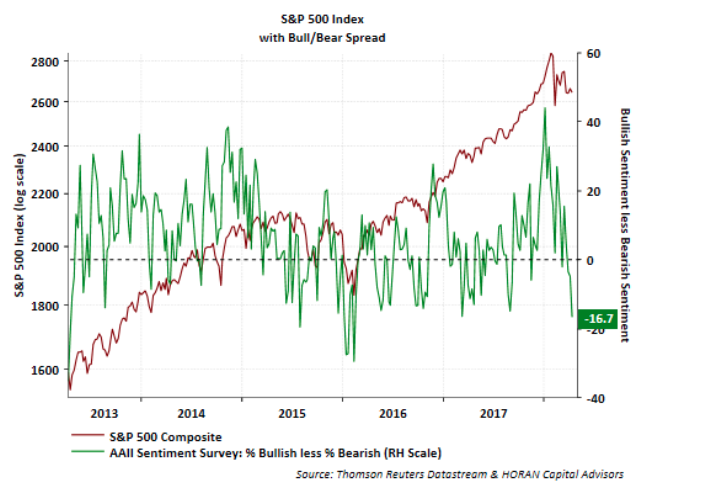
David Templeton, portfolio manager and principal at Horan Capital Advisors recently noted the bearish equity sentiment in his blog post. Templeton used the latest figures concerning investor sentiment from the American Association of Individual Investors to surmise a contrarian view on equities near term.
“Bearish sentiment jumped 6.1 percentage points to 42.8%, resulting in the bull/bear spread being reported at a negative 16.7 percentage points, the widest negative spread in more than a year,” he noted.
The AAII survey is often used as a contrarian indicator, meaning traders turn upbeat when its readings get gloomier. The chart below from AAII suggests a turning point for equities may be coming soon enough.
The weekend that was has given way to this trading week and continued earnings releases and as such we will briefly discuss the missile strikes on Syria from the coalition of nation states that included France, United Kingdom and lead by the United States. The strikes that occurred on the evening of Friday the 13th (EST) were declared successful by the coalition and evidenced as such in the media. The strikes and mission were designed to curtail or stop Syria’s government from using chemical weapons going forward.
The consternation about the missile attacks comes via Russia’s involvement in the Syrian war against the rebel forces in the region. Russia has enhanced the Syrian government’s capability and stands in alliance with the government of the war torn nation. This brings Russia squarely into conflict with the United Nations and more obviously, the United States. With that being said, for all the bluster and conflict aimed at the U.S. and the UN over the years by Russia, it hasn’t amounted to more than that, bluster and threats.
So what do the coalition strikes mean for equity markets and volatility in the coming week? Finom Group believes that most investors understood the missile strikes were an inevitability as President Trump had previously tweeted, “They’re coming”. As such, we see little equity market reaction to the strikes forthcoming. This belief or forecast can be juxtaposed with the more recent missile attack from the United States that occurred on April 6, 2017.
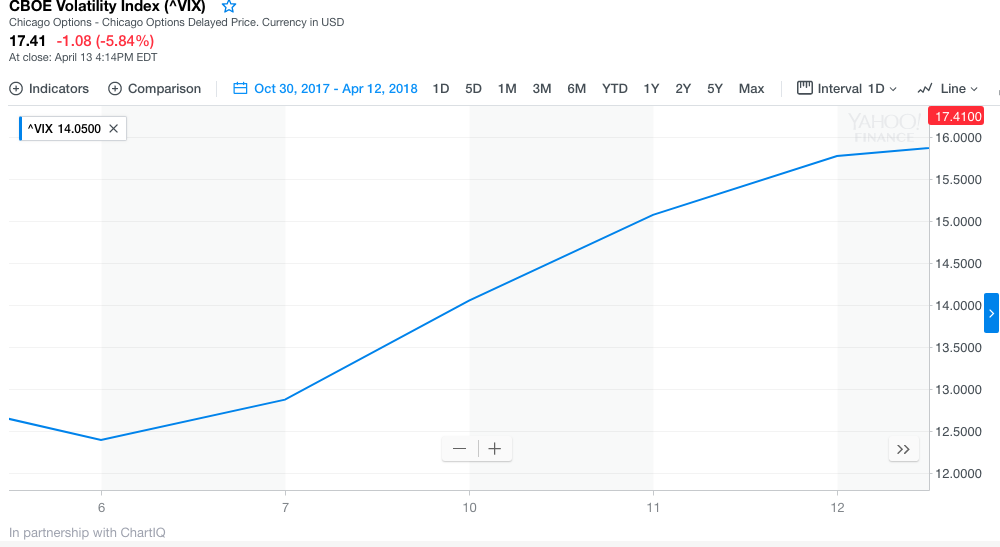 As depicted in the chart above, provided by Chart IQ, the April 2017 missile attack did result in an increase in market volatility, with a roughly 1% negative move for the S&P 500 that began in the following trading week. The actual response to the April 2017 missile attack was, on the subsequent trading day, mostly void and with the S&P 500 virtually flat on the April 7, 2017 trading day.
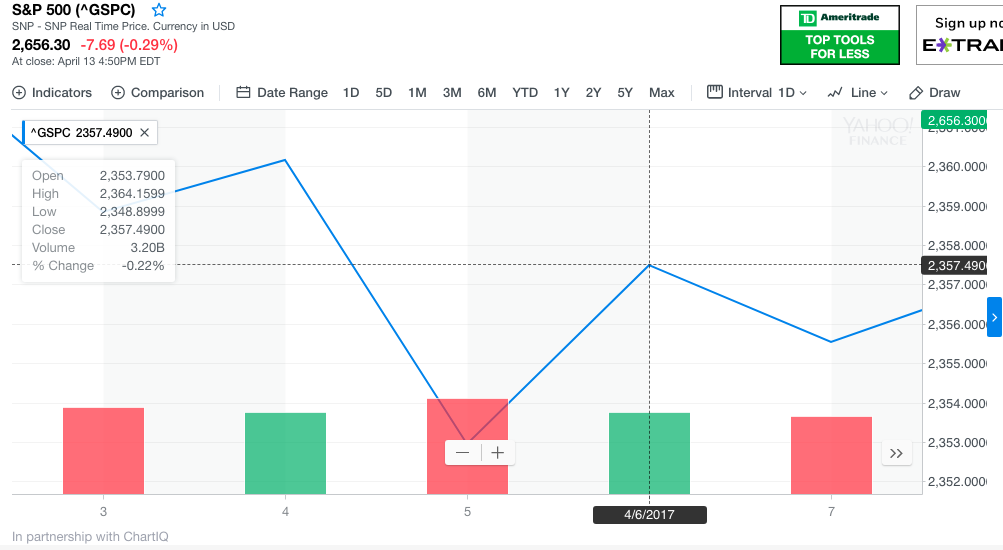
On April 6, 2017 the S&P 500 closed at 2,357 and on April 7, 2017 the index closed at 2,355. To reiterate, however, the VIX was sharply higher post the missile strikes in 2017, up some 27 percent. It remains to be seen if volatility will spike again in response to this particular geopolitical issue, especially as volatility tends to become desensitized to like stimuli, which this would be categorized.
Geopolitical concerns will seemingly continue to weigh on investors for months to come and there is no shortage of geopolitical issues to consider. They confront investors from all sides and regions of the world presently. Some of the concerns surround trade with China and NAFTA terms. While the China-U.S. trade and tariff dispute remain at heightened levels, a deal on NAFTA may prove promising for investors in the not too distant future, as suggested in a recent statement from U.S. Vice President Mike Pence. Pence told reporters it was possible that a deal would be reached in the next several weeks.
As we trend deeper into earnings season, we have to recognize the latest uptick in the forecast for Q1 2018 S&P 500 earnings. Last week, according to Thomson Reuters, Q1 2018 earnings were expected to grow 18.4% when compared to the same period a year ago. This was articulated in Finom Group’s latest research reported titled Geopolitical Concerns Weigh Heavily Against Earnings Season. But after the most recent outperformances from bank earnings, Thomson Reuters has revised its Q1 2018 earnings forecast higher.
Aggregate Estimates and Revisions
The focus on earnings season should increase in the coming weeks, although investors will keep an eye out for geopolitical and Fed-related news via the Beige Book on Wednesday. Monday will likely prove to deliver the most impactful economic data of the week via monthly retail sales. The last few reporting cycles have shown MoM declines although YOY retail sales have been relatively strong, growing above 3.5 percent. The report will give clues on not just the state of retail in the United States, but also consumer spending trends. BofAML recently suggested an uptick in retail sales during the month of March as discovered through their credit card receipt tracking.


