

Research Report Excerpt #1
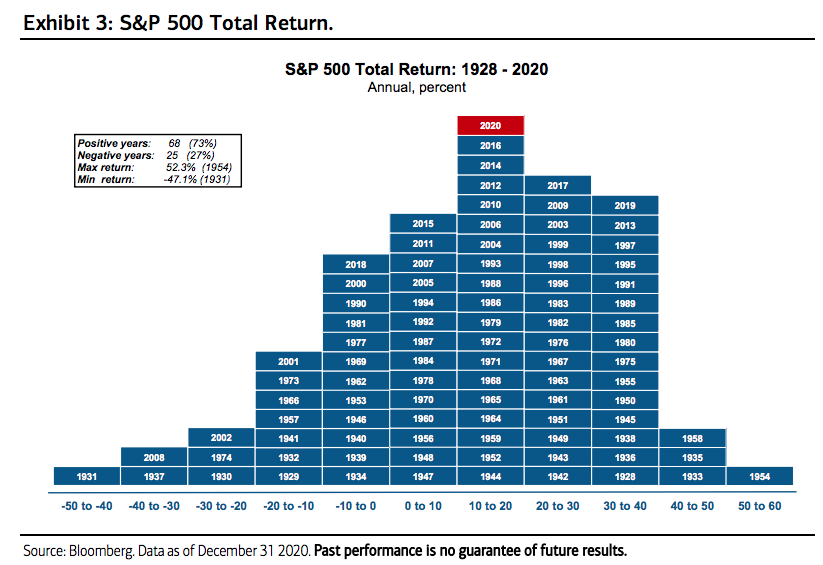
Since 1928, a great many things have changed in our lives, in the economy, and around the world. There have been many economic shocks, World Wars, epidemics, advances in technology, and the list goes on and on. The point here is: No matter what you may think can or will trip up the market, that should actually be the least of your consideration, even if a natural contemplation. The market has been up 73% of all years since 1928, not including the present calendar year. When it has been down on a given calendar year, more often than not it has been down less than 10 percent (graph above).
Research Report Excerpt #2
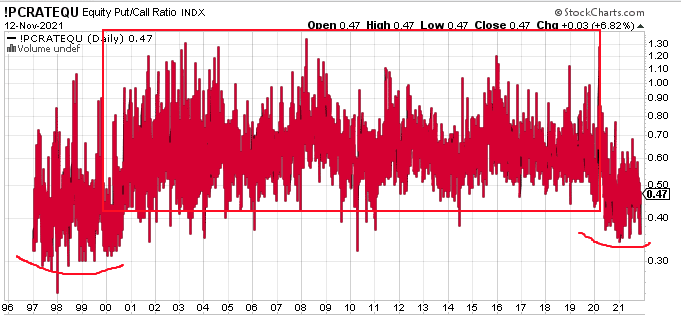
So I’ll ask the question: Does the Equity P/C Ratio look more like what we saw in 1995-1999 or 2012-2014? I think the rendering is clear, and investors would prove wise to respect the regime. And recall that the regime from the 1990s was not without meaningful corrective waves, but they all found higher-highs.
Research Report Excerpt #3
In Q4 of 2020, the NYSI broke back above the trend line, as shown in the chart above. But look where it was in mid-November 2020 compared to mid-November 2021, today:
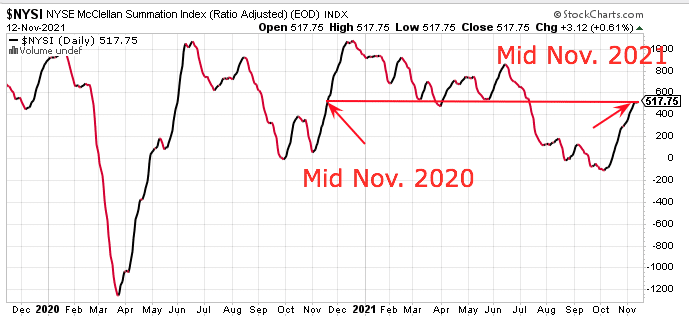
Oh sure, I’d love to offer a guarantee and suggest that the NYSI will break out and above this resistance/support level the same way it did November of last year, given that it is at the exact same place today, but that would prove a bias. All I can say is that human behavior is rather consistent, and you make of that what you will.
Research Report Excerpt #4
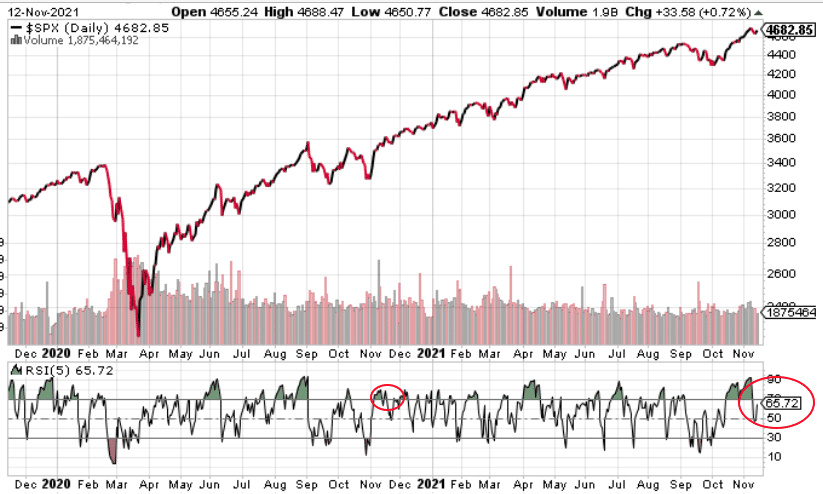
Prior to Wednesday’s .82% decline, the 5-day RSI had extended to a reading of 95. The 5-day RSI is now at 65+ and the 14-day RSI finished the week at 67+. Both are hot readings, but they are not overheated with readings of 70 or better. The market could just as easily experience more chop in the upcoming trading week as it could find new all-time highs. Historically, the market doesn’t do a whole lot of anything during the 3rd trading week of November.
Research Report Excerpt #5

Interim market breadth is super strong right now, with the most favorable reading all year and over the last 52-week period. This is not a market to “fade”, but rather a market environment that urges investors to re-leverage when momentary weakness arrives. That is simply what the market internals inform, and history validates. Pay attention to those stocks/ETFs on your shopping list along with paying attention to your end-of-year game plan!
Research Report Excerpt #6
Echoes from company earnings reports tell us about the strength and resilience of the consumer through Q3 of this year. Simply put, U.S. household balance sheets are in the best financial shape they’ve been in years, supported, in part, by an above-average savings rate of 7.5%, which equates to some $1.3 trillion in future consumer purchasing power (Exhibit 1). Speaking of the latter, and underlying the confidence of U.S. households, consumers spent a record $10 billion just on Halloween this year, up 14% from the pre-pandemic levels of 2019, according to the National Retail Federation.
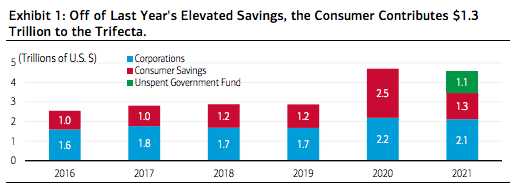
Confidence begets spending. And to this point, consumer confidence as measured by the Conference Board’s Consumer Confidence Index ticked up in October, following three months of declines, and is corroborated by the latest retail sales figure (0.7% MoM growth), which surprised to the upside last reading. And still, record U.S. household net worth increased by $24.3 trillion in the 12 months ending Q2 2021, bringing wealth in America to a total of $142 trillion. Against this backdrop, it’s little wonder that many U.S. firms have been successful in passing through higher input costs to consumers, boosting profit margins and contributing to better-than-expected Q3 earnings.
Research Report Excerpt #7
So what does this mean for investors? We’ve looked at a _ _ _ _ load of data over the last 18 months when it comes to the impact on earnings and the market during bouts of high inflation. Most of them don’t produce negative returns, shy of the 1970s period, which had a couple of years of negative returns, but for the decade the returns were still positive.
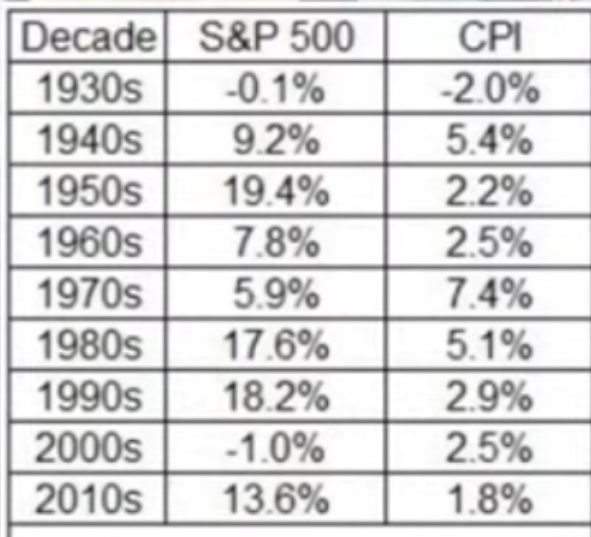
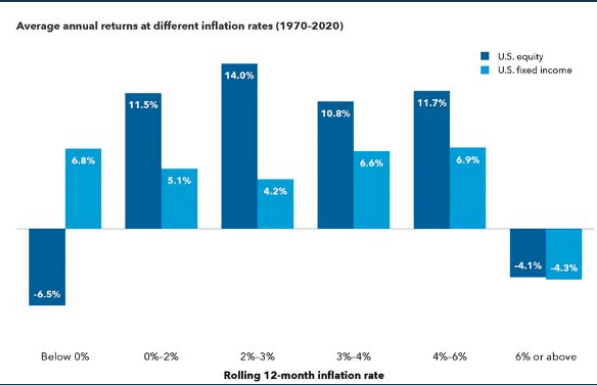
Something tells me that high CPI readings are not the cause of negative returns. Usually there is no single variable that provides enough stimuli to cause a market or economic outcome. CPI does not qualify as an exogenous event, that would be Covid, or a 9-11 attack. Additionally, we know that if CPI continues to rise and in accordance with Bank of America’s forecast achieves that 5.6% YoY rate, it would historically prove double-digit returns for investors, given the chart/data below:
Research Report Excerpt #8
What is the best performing sector ETF over the same time period for the month of December, going back to 2002?”
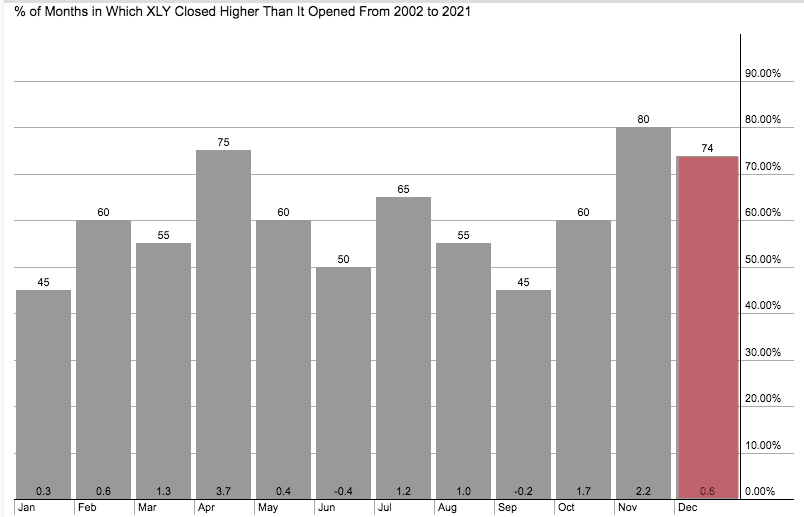
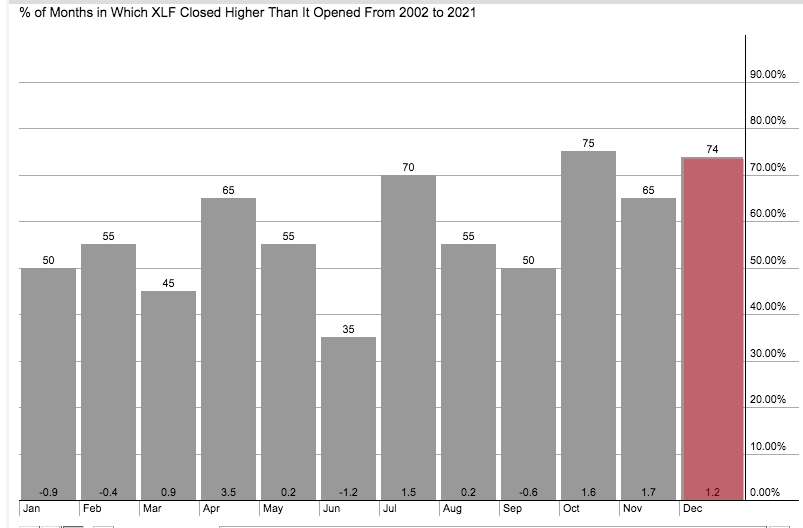
It turns out that I was right and wrong, go figure. Indeed, the Consumer Discretionary ETF (XLY) has been higher for the month of December 74% of the time dating back to 2002, but so has the Financial sector ETF (XLF). So which one does an investor/trader choose? While both have the same positivity rate, the XLF has doubled the average return of the XLY in December since 2002. You decide, and recognizing that there is still a 26% chance of a negative return for the month with each of these sector ETFs.
Research Report Excerpt #9
Business spending and CapEx intentions in the U.S. have risen to elevated levels across a number of measures. For instance, according to the BEA, the technology-led CapEx cycle alone jumped 11% on a year-over-year basis during Q3 of 2021 to another record high. It accounted for a record 52% of total CapEx as companies and the economy increasingly digitalize. Secular investments in semiconductors and automation, as well as more cyclical infrastructure investments, will likely boost CapEx growth over the medium term.
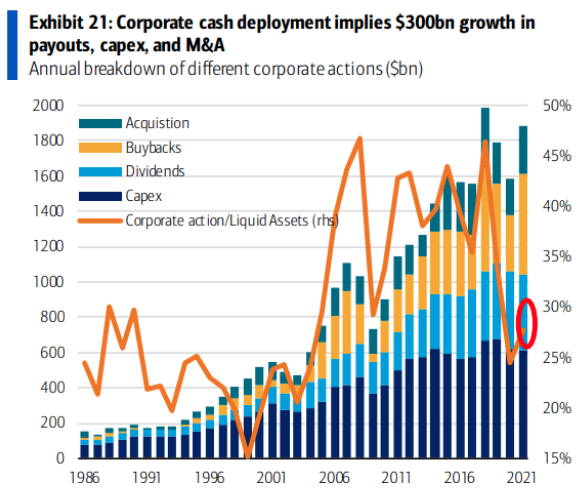
According to S&P Global, total shareholder return of buybacks and dividends in Q2 2021 stood at $322 billion. Share buybacks in Q2 totaled $199 billion, up 11.6% from Q1 and 124% from the pandemic-depressed levels of Q2 2020 (low of $89 billion). A more stable and consistent story for dividend growth has unfolded for S&P 500 dividends, totaling $123 billion in Q2, up 4% on Q2 2020.


