
Welcome to another trading week!! In appreciation of all of our Basic Membership level participants and daily readers of finomgroup.com content, we offer the following excerpts from our Weekly Research Report. Our weekly Report is extremely detailed and has proven to help guide investors and traders during all types of market conditions with thoughtful insights and analysis, graphs, studies, and historical data/analogues. We encourage our readers to upgrade to our Contributor Membership level ($7.99 monthly, cancel any time) to receive our Weekly Research Report and State of the Market Videos and take advantage of this ongoing promotional event today! Have a great trading week, be in touch, and take a look at some of the materials in this weekend’s published Research Report!
Research Report Excerpts #1
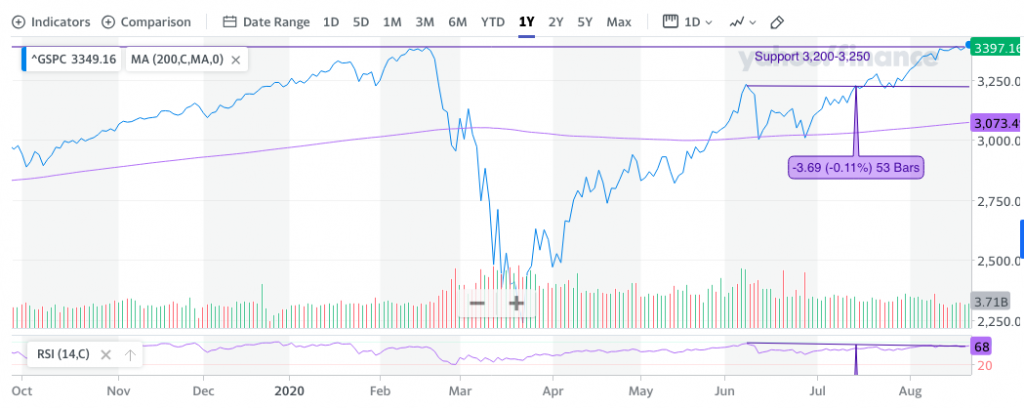
“Price consolidation has been hard to come by during this market uptrend, but price consolidation is inevitable in my opinion and the opinion of Finom Group’s Vice President and chief technician Edward Cordoba. Simply put, price cannot simply grow to the sky, forever. Once price starts to pull back, you’d want to see the price fail to hold a key support level before becoming a seller. For the S&P 500, I’m looking at 3200-3250, which lines up with the June high as well as the July swing low. The chart above identifies that prior resistance in June, which became relative support in July. A breakdown of this key level would establish a lower low and lead me to consider further downside potential. One might consider these articulations as part of their game planning and weight of the evidence approach now and before the potential of downside arrives. Always a good idea to think ahead and maintain a modicum of forward-looking game planning exercises on a regular basis.”
Research Report Excerpts #2
Moreover, in recognizing how bad this past week may have felt for traders, it is important to remember that the new bull market was up 60% in less than 6 months and up 5 months in a row. The two previous best starts to a bull market ever (1982 and 2009) weren’t even this strong. As I’m always dedicated to studying market history and analogous market patterns, check out how all 3 mentioned time periods had a hiccup around this very point in time. History doesn’t repeat, but indeed it often rhymes!
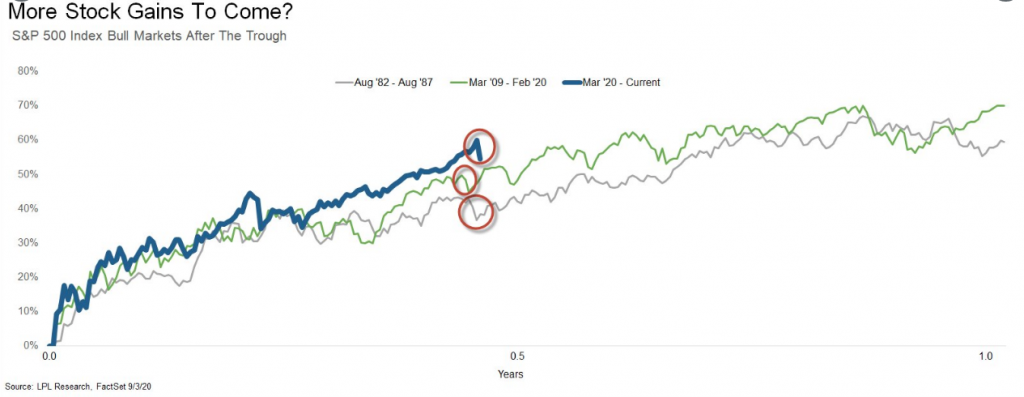
It serves to figure that after such a robust market rally, at this point in time the market would have moved from a more technically driven rally to one that finds exhaustion.
Research Report Excerpts #3
Now let’s dig into the 5-month win streak a little deeper, specifically looking at the exact same 5-month period. It is quite rare for stocks to gain from April through August, as the summer months tend to be somewhat tricky. LPL Financial found there were 6 other years that saw these 5 months all close higher and the rest of the year was higher five times, with some solid returns. In fact, the only year that was lower the rest of the year was 2018, mainly due to the Fed policy mistake in December 2018.

Gains beget more gains. Pullbacks are normal, to be expected and to be used for opportunistic buyers of dips who aligns with the historic data outcomes. And as yet another reminder from past Research Reports:
“The stock market was on sale back in March. Human behavior can be funny sometimes. Think about this way: Macy’s has a 50% storewide sale! Now ask yourself if this would be something you’d fear or relish for opportunity to grab household items and apparel at discount prices. Clearly, we’d probably head to our local Macy’s store and buy those goods. How come it doesn’t often work the same way in the stock market? Aside from a few short stents of pension fund rebalancing at the end of Q1 and even briefer stents of net inflows to the market, much of the rally has been a short-covering rally peppered with low participation and mixed sentiment. People seem to always run, screaming from a market downturn rather than buying at discount rates.”
Research Report Excerpts #4
Bank of America unveiled that it was hiking its year-end price target from 2950 to 3250 (even though it admitted it had absolutely no visibility and in fact forecast a range of 2200 to 4000). This occurred just days after BofA analysts raised their price targets on both AAPL and TSLA. With an election just a couple of months in front of us and a recent S&P 500 interim top of 3,588, BofA’s Chief Investment Strategist Michael Hartnett offers an interesting forecast for the market near-term.
“…historic policy shift underway at Fed, willing to let financial assets overshoot to a. stoke employment & wages, b. finance fiscal excess (via YCC & MMT).” He then adds that the “market knows Fed will “intervene” to prevent <1% GT10 which has allowed SPX multiple to break 20x; policy has become more explicit in recent weeks” and while the recent change in Fed policy “is not factor behind sell-off, it will be factor causing dip in SPX to 3300.”
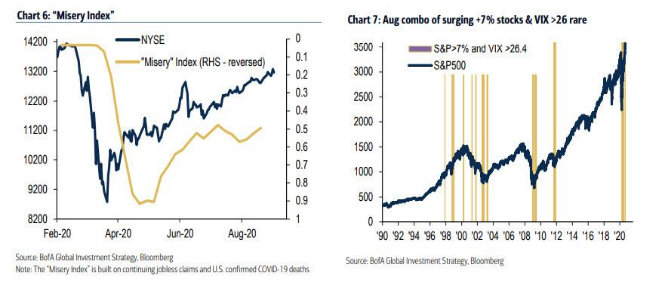
“The “recovery = weaker Wall St: Sept’20 volatility and reversal in summer outperformance cyclicals/defensives (see TRAN/UTIL) reflects impatience with delayed U.S. phase IV stimulus at a time of “peak” V-recovery (see off the-chart global orders/inventories – Chart 5); weak Aug payroll required to settle market nerves; Covid-19 “misery index” is improving (Chart 6) and global consensus forecasts for 2021 are GDP 5.1%, EPS 29.0%; note rare combo of surging stocks & higher VIX in Aug, happens only 1.5% of the time since 1990 – more typical after big market events e.g. LTCM, WorldCom, GFC, Covid-19 (Chart 7) than before.”
Hartnett sees the S&P 500 at “3630 pre-election; but choppy, long vol, short $; inequality real estate and stocks”, or summarizing the rest of 2020 “don’t fight the Fed” while in 2021 it becomes “don’t fight inflation”.
Research Report Excerpts #5
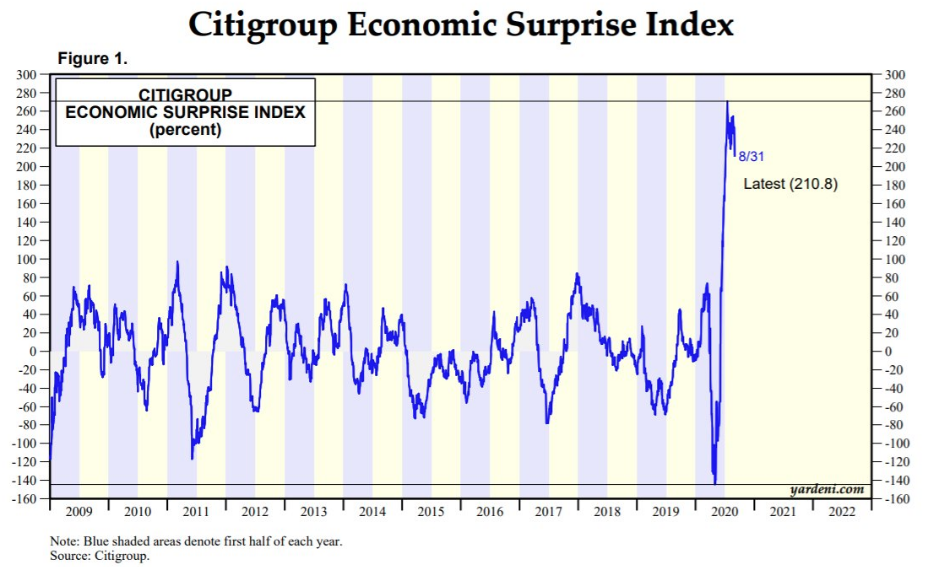
Citi‘s economic surpriseindex is still highly elevated, but it looks to be starting to work its way down. Positive economic surprises have driven this new bull market. It serves to figure that as CESI has stalled and edged off of record levels, the S&P 500 has finally cooled-off as well.
The market and the economy are not necessarily correlated in real time, but over time they do tend to converge to express the tale of economic and earnings growth. In reviewing the economic data from this past week, it largely remained within the characteristics that define an economic recovery, however less strong some might desire. We will all continue to hear about the “slow” economic recovery that is expected by economists and even the Federal Reserve, but this is always the forecast coming out of a deep recession, even though this was a self-induced recession unlike any other in the past. This serves to validate, once again, that while the circumstances differ, human behavior does not!
Research Report Excerpts #6
In earnest, most economists have remained surprised by the resiliency of the economy from what has proven unprecedented times. Forecasts have proven futile, underwhelming and overwhelmed by the actual monthly data. Even some of the more high frequency data has slowed, but continue on an upward path in August.

After moving sideways in June and July, people’s mobility has picked up in August, along with an uptick in consumer activity such as dining out, which increased for a seventh consecutive week.
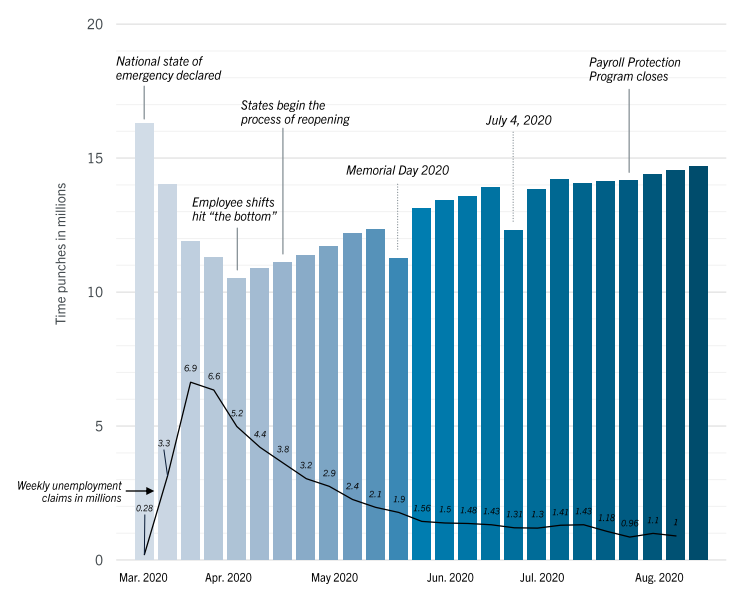
Additionally, a couple of labor market indicators have improved since our last update. Shift work edged higher according to employment firm Ultimate Kronos Group and job postings on Indeed, a job posting platform, also ticked up from a week ago.
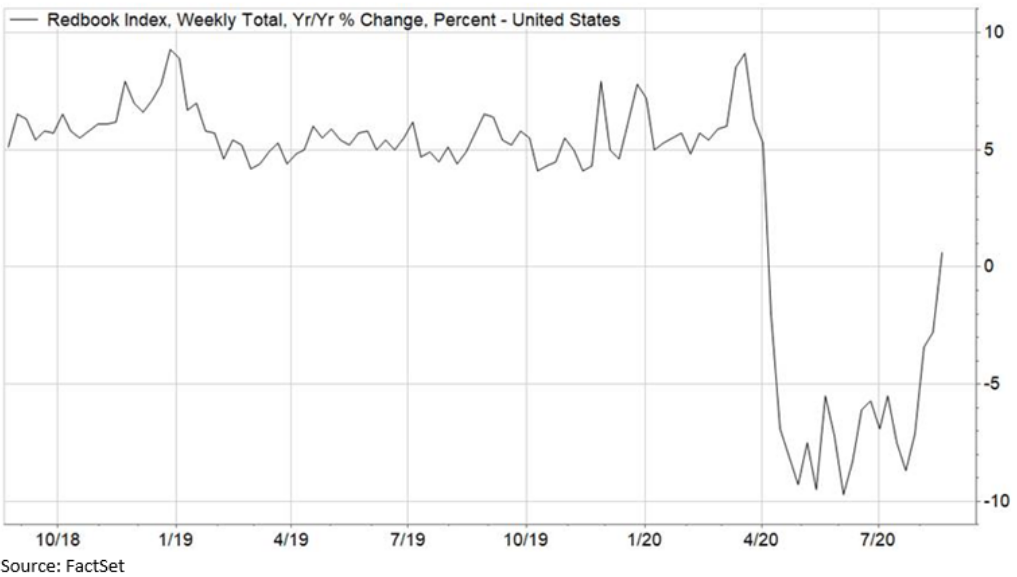
In spite of waning fiscal stimulus and fears of slow back-to-school, Redbook’s measure of weekly retail sales returned to positive YoY growth last week for the first time since early April. Another sign of the economic recovery process we’ve been monitoring closely is mortgage forbearance data. After holding flat for the last couple of weeks, the total number of mortgages in active forbearance saw stronger than expected improvement, with the number of active forbearance plans declining by 147k (-4%) over the past week. Active forbearances are now down about 1M (-21%) since the peak in May.
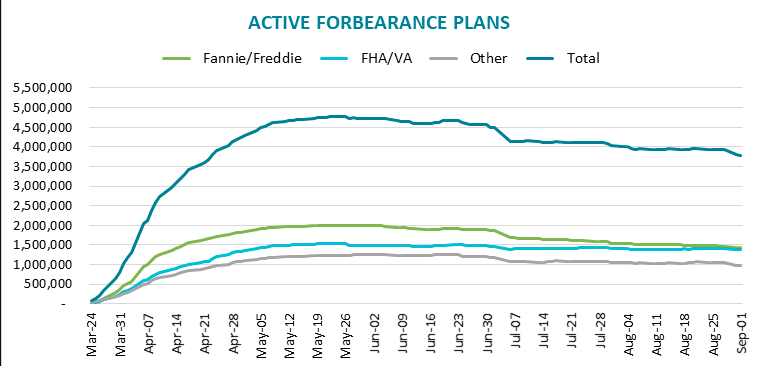
According to Black Knight’s McDash Flash Forbearance Tracker, as of September 1, 3.8M mortgages remain in active COVID-19 related forbearance plans, representing 7.1% of all active mortgages, down from 7.4%. Together, they represent $804 billion in unpaid principal. Of these, 75% have had their terms extended.
Research Report Excerpts #7
During the first two months of the 3rd quarter, analysts increased earnings estimates for companies in the S&P 500 for the quarter. The Q3 bottom-up EPS estimate increased by 2.6% (to $32.62 from $31.78) during this period. How significant is a 2.6% increase in the bottom-up EPS estimate during the first two months of a quarter? How does this increase compare to recent quarters? (FactSet Data)
Insight/2020/09.2020/09.04.2020_EI/Change%20in%20S%26P%20500%20Quarter%20EPS%20First%20Two%20Months%20of%20Quarter.png?width=912&name=Change%20in%20S%26P%20500%20Quarter%20EPS%20First%20Two%20Months%20of%20Quarter.png)
- During the past five years (20 quarters), the average decline in the bottom-up EPS estimate during the first two months of a quarter has been 4.1%.
- During the past ten years (40 quarters), the average decline in the bottom-up EPS estimate during the first two months of a quarter has been 3.4%.
- During the past fifteen years (60 quarters), the average decline in the bottom-up EPS estimate during the first two months of a quarter has been 3.9%.
- Thus, while analysts typically lower EPS estimates during the first two months of a quarter, they increased EPS estimates during the first two months of Q3 2020.
- In fact, this marked the first increase in the bottom-up EPS estimate over the first two months of a quarter since Q2 2018 (+0.2%) and Q1 2018 (+5.7%). Prior to Q1 2018, the last time the bottom-up EPS estimate increased over the first two months of a quarter was Q2 2011 (+1.5%). However, it should be noted that analysts made substantial cuts to EPS estimates for Q3 during the second quarter (March 31 to June 30). During this period, the Q3 bottom-up EPS estimate declined by 23.6% (to 31.78 from $41.60).
Research Report Excerpts #8
“But the second cause is simply a supply/demand equation that is ever increasingly in favor of long-term investors. The phrasing is called de-equitization of the stock market!”
If the de-equitization of the stock market continues, the supply/demand dynamic should remain favorable for price long-term. De-equitization means that the number of public stocks is declining. The number of publicly traded equities has been cut in half since the late 1990s, peaking at 8,309 in 1996 and down to 3,853 by 2016.
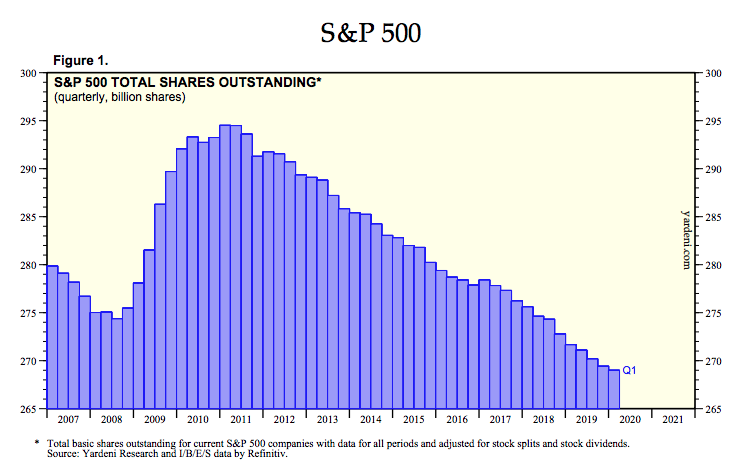
A similar and related dynamic is the ongoing shrinkage of the share count in the S&P 500, driven in large part by share buybacks, even if that has been less a factor in 2020. Yes, you want to be on the side of the equation that obtains the supply of a decreasing product whereby demand is not decreasing for said product.
Monetary policy remains ultra-accommodative and is likely to stay that way for a number of years to come (as confirmed by the Fed’s new inflation targeting stance just two weeks ago at Jackson Hole and since). With the P/E ratio on the 10-year Treasury now at 143x (the inverse of 0.7% yield), believe it or not, equities at 25x trailing earnings and 21X forward earnings seem like a bargain. The idea that there is no alternative place to find yield other than in stocks is a real and sustainable thesis underpinning stock valuations. For those that suggest cash is an alternative, I think that will prove a fleeting sentiment.
Thank you for joining us for another trading week and reviewing our weekly “Must Knows”! To receive and review our weekly, full-scale Research Report each Sunday and our State of the Markets weekly video analysis every Thursday, subscribe to our Contributor Membership level at just $7.99 monthly (Cancel any time)! With these two weekly deliveries, you’ll have all the unbiased and fact-driven market and economic data analysis at your fingertips. Don’t make capital allocation decisions based on headlines that brush the surface of what is and isn’t affecting markets. Let our deep-dive analytics supply you with bottom-up and top-down analytics. You won’t be disappointed. Upgrade today!!


