
Welcome to another trading week!! In appreciation of all of our Basic Membership level participants and daily readers of finomgroup.com content, we offer the following excerpts from our Weekly Research Report. Our weekly Report is extremely detailed and has proven to help guide investors and traders during all types of market conditions with thoughtful insights and analysis, graphs, studies, and historical data/analogues. We encourage our readers to upgrade to our Contributor Membership level to receive our Weekly Research Report and State of the Market Videos and take advantage of this ongoing promotional event today! Have a great trading week, be in touch, and take a look at some of the materials in this weekend’s published Research Report!
Research Report Excerpts #1
One of the notable charts from last week found a break in the S&P 500 trend-line, but only a minor break before recapturing it. Unfortunately, the trend-line did not hold this week and identifies a clean break below at the end of this past week.
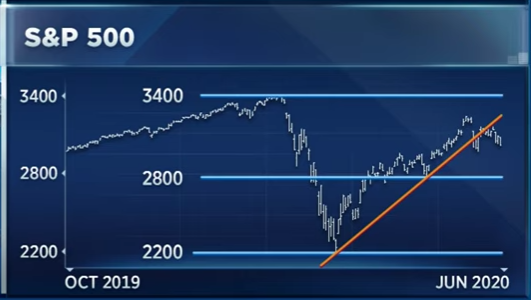
But, because there is always a but right? Should our trend-line begin at the March lows or the most recent low? Some might argue it should start at the ultimate low of the former bearish trend while others might argue that the chart should start at the former low from whence the new trend was first tested. If using the latter, the trend-line would start at the low in April and would look like this…
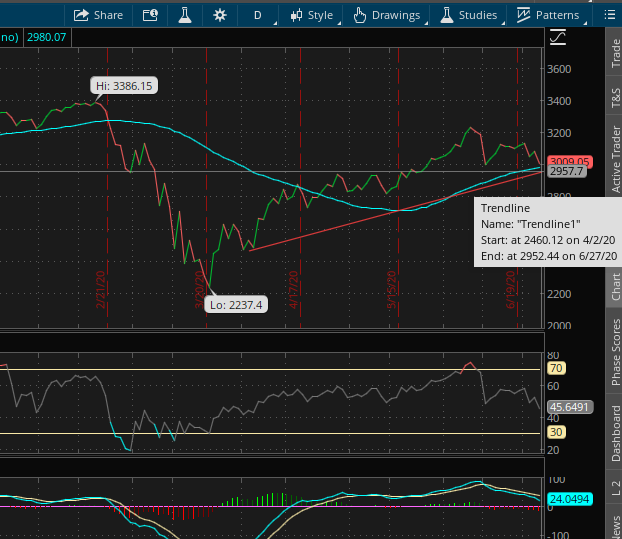
So if we start our trend-line from the April 2nd low, the support for the benchmark index would come in at 2,952 and not reveal a break of trend as of yet. Remember that technical analysis is little more than perspective, and clearly perspectives can change the outlook as identified in the exercise of where trend-lines begin and end. Nonetheless, when we review the technicals from the prior 3 trading weeks we recognize that we’ve definitely been consolidating for both time and price.
Research Report Excerpt #2
Tactically speaking, however, and for those more detail oriented with their game plan we take a look at market internals to denote strong weakness in the market last week. The S&P 500 Bullish Percent Index is one of the most widely followed market internals.
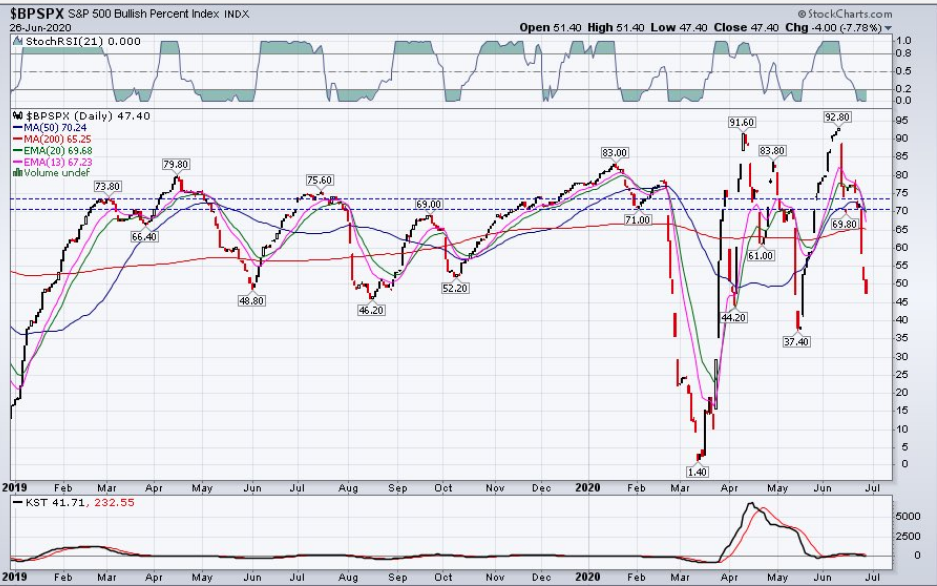
As we can see from the chart of the BPSPX above, there has been a severe drop in the percentage of stocks signaling a double-top, higher-high breakout. In terms of active capital management, the current level is not concerning and has been found to be realized for buying opportunities in the past. It would prove more concerning if we see the BPSPX drop below 40% in the coming week/s. This seems probable at this point in time, based on other market internals also having weakened in the past trading week. As such, the BPSPX is at an “in between signal” and may ask of active fund managers to hit the pause button before allocating any more capital to the market.
Research Report Excerpt #3
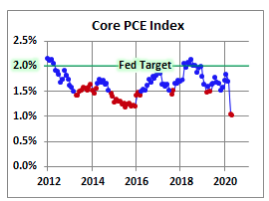
The rate of inflation as measured by the PCE price index, which is the FOMC’s primary gauge of inflation, slipped to 0.5% in the past 12 months from 0.6% in the prior month, well below the Federal Reserve’s 2% target. The rate of inflation has fallen sharply during the pandemic. Economists say the government will likely have to provide more money to families and businesses to maintain the recent momentum. If federal aid dries up, the economy could suffer another setback.
“Consumer spending sprung back to life in May as the nation reopened. But, don’t be fooled, the rebound was only partial and largely supported by April’s massive fiscal stimulus injection,” Gregory Daco and Lydia Boussour of Oxford Economics told clients. “Consumers are still fearful.”
“The rebound in May spending alongside substantial income support is encouraging, but the outlook now will be guided by how quickly the nation can suppress the recent flare-up in infections,” said senior economist Sal Guatieri of BMO Capital Markets.
Research Report Excerpt #4
Just 5 states make up 40% of America’s GDP; here are their recent/current unemployment rates versus the national jobless rate:
- California: down 0.1 points in May to 16.3% from 16.4% in April
- Illinois: down 2.0 points in May to 15.2% from 17.2% in April
- New York: down 0.8 points in May to 14.5% from 15.3% in April
- Florida: up 0.7 points in May to 14.5% from 13.8% in April
- Texas: down 0.5 points in May to 13.0% from 13.5% in April
Takeaway: aside from Illinois, the top 5 GDP-producing states all underperformed May’s national drop in unemployment to 13.3% from 14.7% in April and except from Texas all show higher unemployment rates than the US as a whole. Also, all were running much closer to the national average pre-COVID Crisis, as the following chart shows:

Research Report Excerpt #5
The relatively stable pace of new deaths contrasts with the rising trend in new cases. In the U.S., demographic data from the Center for Disease Control shows that new cases in May and June are skewing towards those that are younger, rather than towards the older portion of population as seen back in April and in months prior. While daily stock market volatility in recent weeks may be influenced in part to the rising number of cases, the overall trend in stocks seems more closely aligned with deaths than new cases, as you can see in the chart below. This makes sense since it is the risk to human life that may result in a return to the economic paralysis of lockdowns or self-quarantines, rather than solely a rise in new cases.
Stocks focused on deaths not cases

Stocks seem to have been moving in advance of the trend in deaths (by about four weeks), perhaps anticipating the trend based on what was seen in countries that led the first wave of the virus (ex. China and South Korea). But this relationship is now at a critical point and poses a risk to stocks if deaths were to trend higher. Expectations of a further decline in deaths seems to be priced into stocks in recent weeks; any challenge to that expectation could trigger a sharp selloff. These concerns are not unwarranted. Signs of vulnerability in the stock market over the past two weeks include rising volatility tied to virus data. So watching the number of deaths, not new cases, may be critical in the weeks ahead.
Research Report Excerpt #6
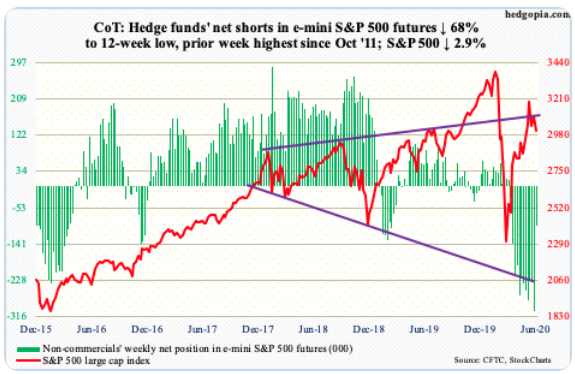
And these fund managers with low equity market exposure are now less hedged or outright short the market after witnessing futures short positioning in the S&P 500 futures decline by some 70% this past week!
Probably the most critical fund flow data surrounds the EOM/EOQ rebalancing taking place and the estimated flows surrounding this mechanical operation. Here is what J.P. Morgan offered earlier this week on the subject matter:
“We estimate around -$70bn of negativeequity rebalancing flow by balanced mutual funds globally into the current month end….
- We estimate that the pending equity rebalancing flow by US defined benefit pension funds into the current quarter end is likely modestly negative at around -$65bn.
- Norges Bank into the current quarter end is likely modestly negative at around -$10bn.
- SNB to sell around $15bn of equities given the recovery from March lows.
- GPIF into the current quarter end is likely negative at around $25bn.
- Created a need for negative rebalancing flow, i.e. equity selling, of around $170bn into the current month/quarter end. This $170bn should be thought of as an upper estimate as it is possible that same of this equity selling was done before quarter end.”
Research Report Excerpt #7
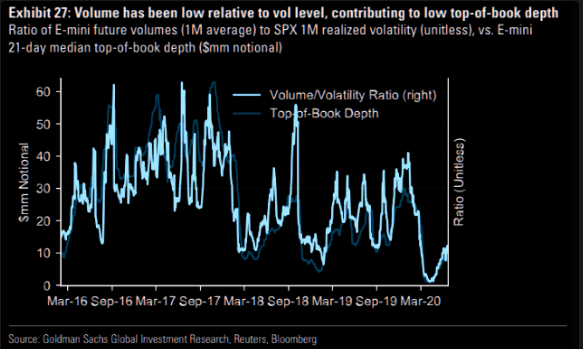
Equity market liquidity remains very poor and will not likely improve much further until after the election period. As such, investors should recognize that market volatility may remain elevated for both realized S&P 500 volatility and the VIX, for much of the year. Elevated does not mean constant!
Collectively, Finom Group still believes that much of what is making headlines from a macro-perspective is normal and in keeping with our full-year outlook.
Thank you for joining us for another trading week and reviewing our weekly “Must Knows”! To receive and review our weekly full-scale Research Report each Sunday and our State of the Markets weekly video analysis every Thursday, subscribe to our Contributor Membership level at just $7.99 monthly! With these two weekly deliveries, you’ll have all the unbiased and fact-driven market and economic data analysis at your fingertips. Don’t make capital allocation decisions based on headlines that brush the surface of what is and isn’t affecting markets. Let our deep-dive analytics supply you with bottom-up and top-down analytics. You won’t be disappointed. Upgrade today!!


