
A quick Finom Group housekeeping note: Due to travel engagements this coming weekend, we will be foregoing our weekly Research Report this weekend and be back on schedule in the following week. Our usual SOTM video will be due out Thursday evening!
Does it seem like “forever ago” that we were looking ahead to 2020 with an earnings rebound, phase-1 trade deal in-hand and our worst fears for the market related to the presidential election cycle? If the answer is yes, that’s what the fastest market correction in history and heightened market volatility will do. The S&P 500 was down some 18% from new all-time highs in only 13 days.
- Previous fastest?
- 28 days in ’29
- 31 days in ’98
- 38 days in ’87
- 52 days in ’90
- The good news? A year later the S&P 500 was up 23%, 28%, and 38% in years that weren’t a great depression.
These force factors of the market that deliver extreme daily moves seem to elongate the trading day and demand engagement. The more we engage and follow the market during these times, click on articles and watch the opinions flow on CNBC and/or Bloomberg throughout the day, the day itself seemingly becomes that much longer. Mind the health of your investor psychology during market corrections and recognize that corrections are normal even if the reasons for the correction seem abnormal.
A question I get asked a lot lately is if I think we’ll have a bear market and a recession, as if the 2 always go hand-in-hand. Fortunately, that is not always the case, it can be, but not always. The following chart from LPL Financial identifies past bear markets dating back to WWII and identifies whether or not a recession accompanied the bear market conditions.
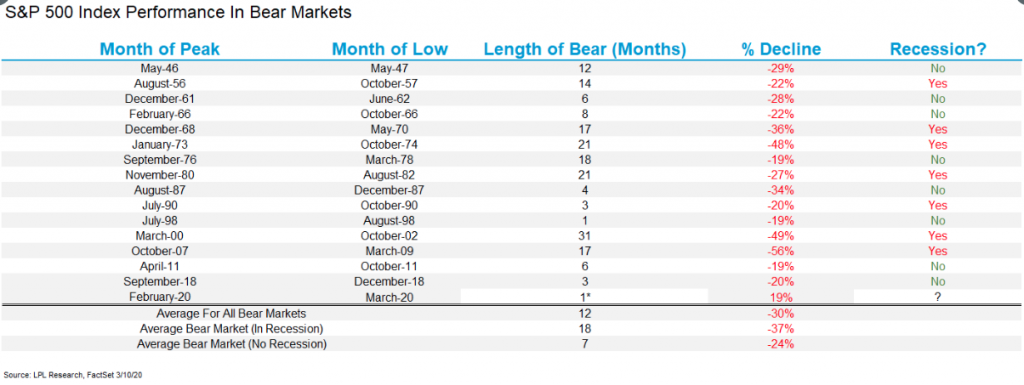
Stocks have dropped 37% on average in bear markets during a recession, while they have lost 24% if a recession is avoided. Additionally, five of the past six non-recessionary bear markets saw stocks bottom between 19% and 22% lower, with December 2018 being the most recent case. The only time stocks saw a larger decline without a recession was in 1987, but don’t forget that stocks were historically stretched heading into that bear market, with the S&P 500 up more than 40% year to date in August 1987.
After a sharp fall for equities on Monday, the largest percentage and point declines for the major averages, naturally a snap back rally took place on Tuesday. Turn around Tuesday as its been called for years now. It was an uneven rally with the Dow up more than 900 points at the open and turning lower by more than 150 points as European markets closed for the day. An afternoon rally found the major averages rallying alongside the 10-year yield and finishing with all major averages up nearly 5% on the session. The extremely tight correlation between bonds and yields is to be monitored closely; as yields move lower so have stocks and visa versa.
The strong market rally after a strong market dive on Monday is being met with the same back-n-forth action on Wednesday. Equity futures are once again faltering by more than 2.5% and with oil and yields once again falling.

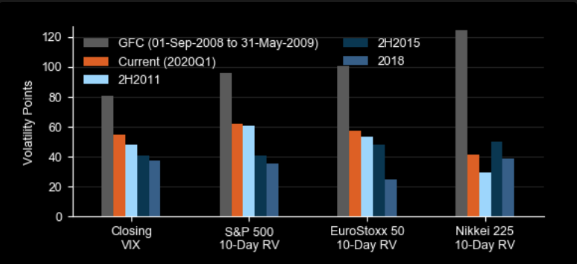
But it’s quite early and the trading day has many hours worth of potential surprises. As noted above, market extremes tend to deliver whipsawing market action/prices on a daily basis, as the VIX is still above 50. A VIX above 50 can also suggest that risk appetite for equities is quite weakened and also at extreme levels. The VIX touched 62 on Monday, it’s highest level since the Great Financial Crisis, identifying that indeed, the current market conditions don’t suggest investors are found without hedging their portfolio exposures and believe there is more to the correction than we can discern from the snapback rally days.
Goldman Sach’s RAI is now below the Great Financial Crisis trough levels, validating just how weak the appetite for risk assets is presently. Least we not forget that risk happens quickly folks.
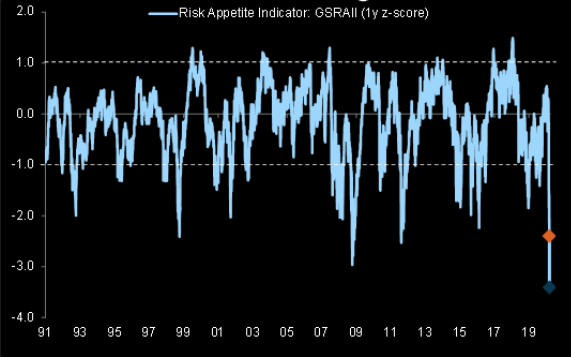
Despite the fact that the current reasons for the bear market don’t come with systemic financial market anomalies akin to the GFC period, the fear is seemingly suggesting COVID-19 is the equivalent. In fact, the Goldman Sachs RAI indicator is suggesting it is worse today.
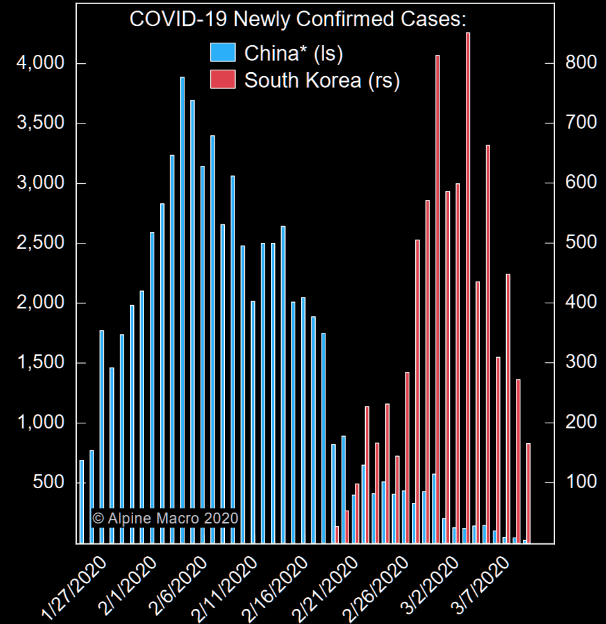
The rising fearfulness that investors are feeling is largely due to the increased headlines surrounding the increased cases of COVID-19 in the United States. While still an irrelevant number based on the size of the population, the fear of disease spread and methods for handling the potential spread remain the greatest factors underlying the emotional turmoil. And this while China and South Korea are well on their ways to normalizing conditions as new cases fall significantly.
Business is starting to operate ‘as usual’ again in China and Apple has reopened nearly all of its stores in China over the last 2 weeks.
- 38 out of 42 AAPL stores in mainland China have now reopened as of today.
- BABA’s parcel and meal delivery arms have returned to pre-Coronavirus outbreak staffing levels.
- President Xi Jinping of China made his first visit to Wuhan, arguably a strong ‘signal’ that Beijing believes the worst of the coronavirus outbreak is over.
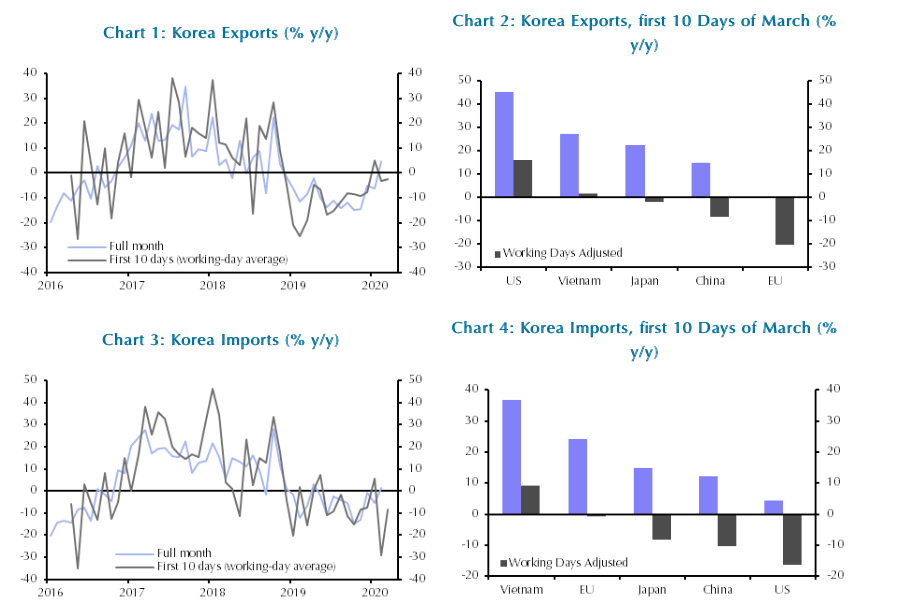
South Korea’s economic activity through the first 10 days of March is also on the mend! Korean trade data for the first 10 days of March suggest that the disruption from factory closures in China to regional industry eased recently, although both imports and exports remain depressed.The timely nature of Korean trade data makes them a good bellwether for the state of trade across the region. (Data from Capital Economics)
- During the first 10 days of March, exports jumped by 21.9% y/y. But this shouldn’t be taken as a positive sign. After all, there were fewer working days in the same period last year. In working-day average terms, export values shrank by 2.5%. (See Chart 1)
- The data are volatile so should be taken with caution, but there are some signs that demand from China is improving.
- Over the first 10 days of the month, exports to China dropped by 8.2% y/y in working-day average terms, compared to a much larger slump in February.
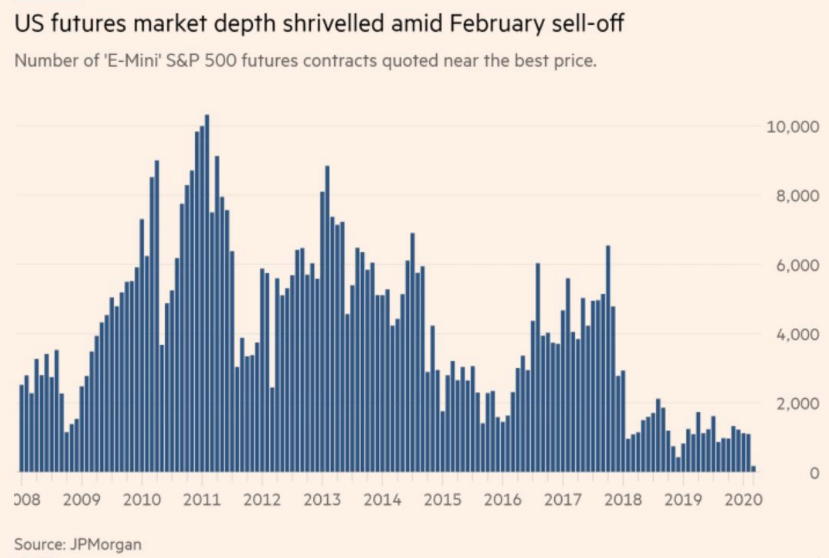
While life, transportation and commerce gets back on track in China and South Korea, however, the U.S. markets may be found wavering back and forth for several weeks to come. COVID-19 now being accompanied by a Russia/Saudi Arabia oil-price war has exacerbated risks to the economy, as the oil/nat gas and energy industries contribute to about 6-7% of total U.S. GDP. And the issues now plaguing the market, of course, couldn’t come at a more illiquid point in the market cycle. As J.P. Morgan’s Marko Kolanovic pointed out in a recent report, market depth has been extremely weak.
“Kolanovic estimates that the depth of the S&P 500 futures market collapsed by 90 per cent last week, caused at least in part by a retreat of the HFTs…”
- Monday’s sell-off represents a “black swan” event, with the oil price war between Russia and Saudi Arabia turning an already fragile backdrop into a perfect storm for risky assets.
- The sharp sell-off is also symptomatic of a fragile market structure that can amplify price both downside and upside—a volatility shock coinciding with a collapse in liquidity and significant forced selling by systematic portfolios (that is now largely complete).
- he volatility comes against a backdrop of investors moving from equities into the safer haven of bonds. In the last month for instance, we estimate that retail and institutional equity fund flows have seen ~$40B in outflows.
- Historically, a market sell-off of this magnitude implied a 65-75% chance of a recession in the next year. However, in our view, the market has priced in too severe of an adverse scenario; assuming a timely, strong counter-policy response, & a peak of COVID-19 in coming weeks.
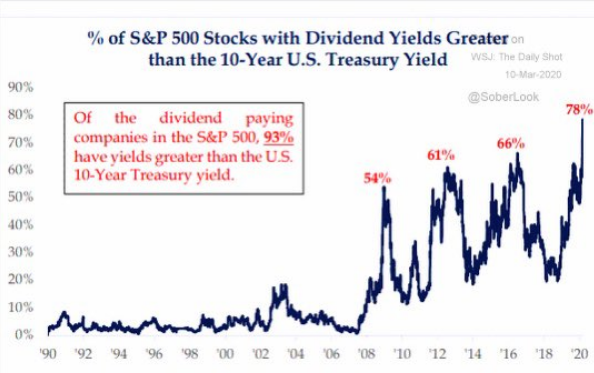
As J.P. Morgan represents in the bullet points above, a peak of COVID-19 cases and headlines is likely ahead, in the coming weeks. And while the market attempts to define where the price-to-earnings (P/E) multiple should be, the long-term risk/reward equation is incredibly enticing for investors, fueling the snapback rallies. At 55%, the equity risk premium is extremely high and now some 78% of S&P 500 stocks have dividend yields above the 10-yr. Treasury yield. As depicted in the chart below, the number of stocks with a higher dividend than the 10-year Treasury yield is at its highest in history and with yields at their lowest level in history.
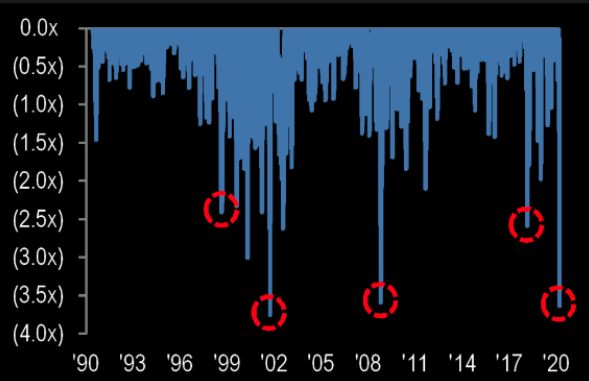
And referring to the market’s attempt at finding an appropriate PE multiple during the fastest correction in history, the S&P 500 multiple experienced one of largest multiple de-ratings in last 30-years. Over last 1-month its multiple de-rated by ~3.5 turns, which is comparable to TMT recession and the GFC.
The market is driving extreme values at the moment and can certainly drive even greater value if fear worsens and COVID-19 concerns and cases worsen without being met with the commensurate degree of fiscal policy. We’ll get to the fiscal side of combatting COVID-19 in a moment, but firstly…
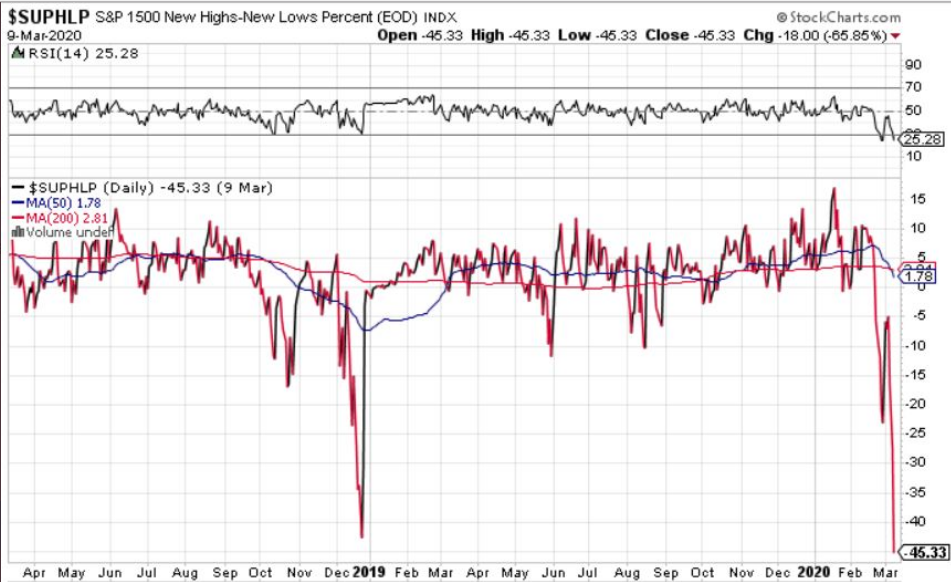
Market breadth has been extremely poor, as the technical damage to the market has been extreme. But breadth readings of late have been showing signs if not out delivering absolute signals of market puking, capitulation if you prefer. The S&P 1500 New Highs – New Lows Percent Index took out the December 2018 lows on Monday.
In terms of oversold conditions, WOW!!! Oversold conditions have been hit across the board with the percentage of stocks trading above their 20d, 50d, and 200d moving averages now firmly in bottoming territory. It’s important to denote the term bottoming does not equate to THE BOTTOM. There still may be yet some more pain to come and as weaker economic is assumed to roll in through the coming weeks.

Moreover, @MacroCharts shared this chart showing the clusters of S&P 500 down Fridays followed by -3%+ Mondays. As he points out “Since 87’, Monday crashes marked the closing bottom 6 out of 11 times (five later retested). The remaining 5 of the 11 occurrences were near final bottoms, but needed residual declines to exhaust selling. While we may not be at THE BOTTOM, conditions and historical occurrences definitely suggest we are bottoming and very near a bottom.

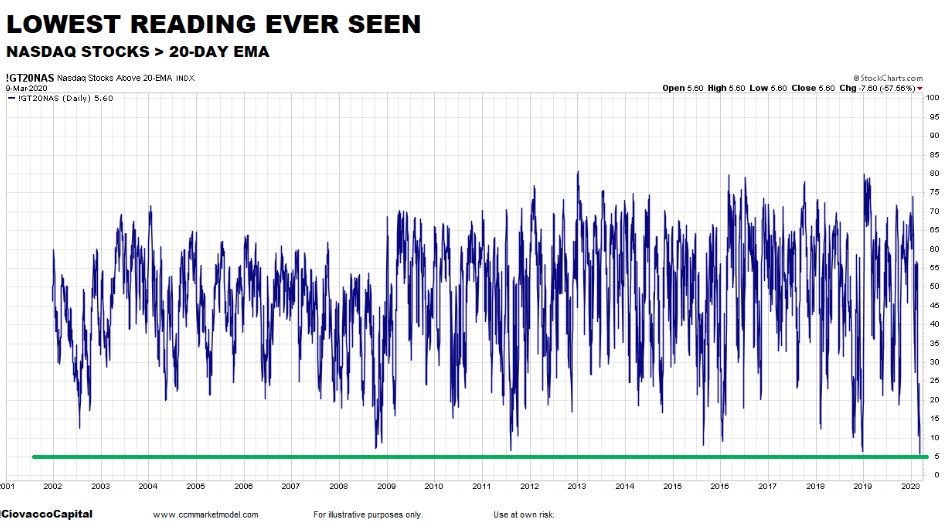
Another extreme breadth reading that indicates the market is, at least, forming a bottom comes by way of the Nasdaq. According to Chris Ciovacco, Monday was the lowest reading ever recorded for the percent of NASDAQ stocks that were above their 20-day exponential moving average at just 5.6 percent. (See chart below)
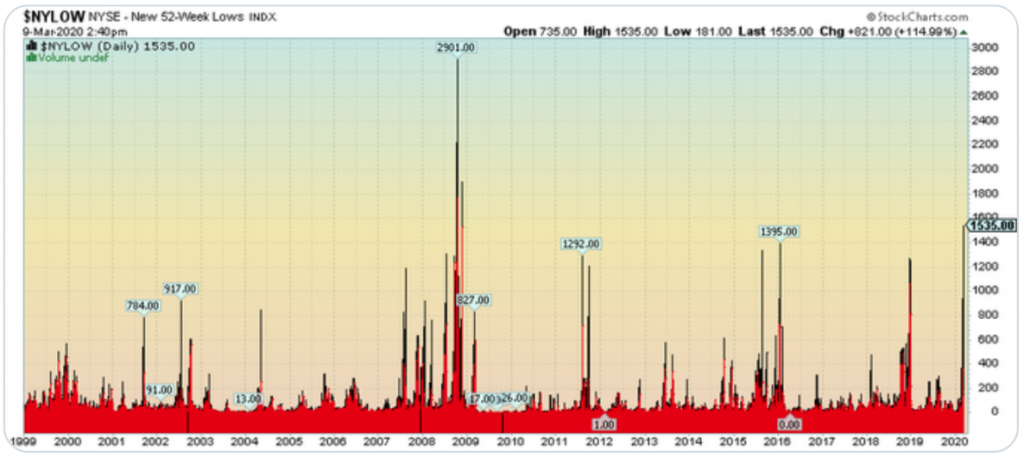
The last of our ugly breadth readings that ultimately and historically lead to good things happening over the next 6 and 12 month periods comes via the NYSE composite index. The NYSE New 52-Week Lows his the highest level since 2008. Nonetheless, look at how much room there could potential be for new lows to express should COVID-19 prove to carry greater economic and earnings fallout than assumed.
It’s for all the reasons and breadth indicators that Finom Group remains cautiously optimistic on markets going forward, and with an open mind to a wide variety of outcomes. Now, let’s get back to those fiscal policy responses to COVID-19.
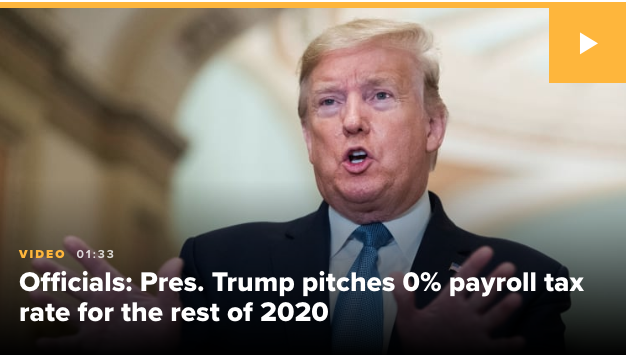
The market spoke more loudly, as all major averages declined by nearly 8% on the trading day Monday. With markets in turmoil, the White House response has also grown louder; imagine that! President Donald Trump, in a meeting with Republican lawmakers Tuesday on Capitol Hill, pitched a 0% payroll tax rate for employers and employees that would last through the rest of this year.
That proposed tax change would last through the rest of the year, and would apply to both employers and employees, a White House official told CNBC. The White House is also considering federal assistance for the shale industry, CNBC reported, as oil prices have recently plummeted due to a price war between Russia and Saudi Arabia.
While a payroll tax cut of sorts is a strong direct measure to offset many aspects of the economic fallout from COVID-19, when pressed as to how the payroll tax cut would be paid for, the White House seemingly had little plans in place. As such, equity futures tumbled in the evening and through Wednesday morning.
CNBC’s Eamon Javers had pointed out to Kudlow that federal payroll taxes generated $1.17 trillion in fiscal year 2018, according to the Center on Budget and Policy Priorities.
“Right now I want to stay in my lane, and I think the health story, the coronavirus story, is very, very important here,” Kudlow said. “We will do the best we can … to give you specific plans and details once we flesh them out.”
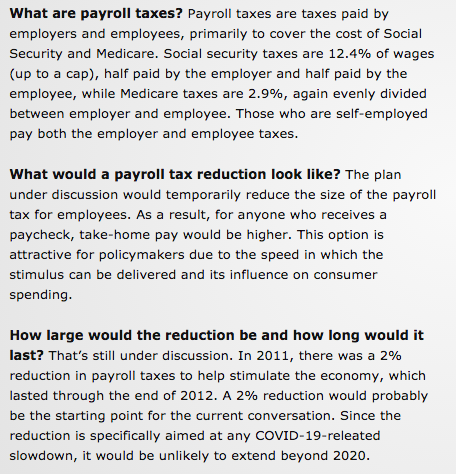
It should be recognized that payroll taxes are paid by employers and employees. They are used to fund Social Security, Medicare and other government programs. For Social Security, employee wages are subject to a 6.2% tax up to $137,700. Workers pay a Medicare tax of 1.45%. Employers match what employees contribute by kicking in 6.2% toward Social Security and 1.45% for Medicare.
It remains to be seen if/when fiscal policy gains traction and is pushed that much closer to implementation. Having said that, by then, we may be beyond the worst of COVID-19 in the U.S. and as warmer climate months greatly impact the ability of the coronavirus to spread. This highly weather-dependent situation only reinforces my belief that investors must consider the following:
- This is not 2008 !
- This is not the 2000 Dot Com Crash!
- This is not 1987!
- Why? Because interest rates and treasury bond yields are at record lows yielding virtually nothing, which means at some point the risk reward in stocks will be too enticing especially dividend stocks.
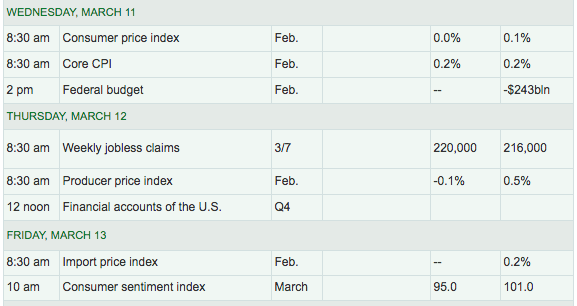
Looking ahead to the economic data due out today, I think it safe to assume that nobody will care about the Consumer Price Index when it is released Wednesday morning at 8:30 a.m. EST. Going forward, investors will be focused on issues such as jobless claims, consumer sentiment and consumer spending.
Looking back on Tuesday’s NFIB small business sentiment index, the reading proved to show growth. Strong job creation continued in February, with an average addition of 0.43 workers per firm, adding to a strong 1st quarter of 2020. Finding qualified workers remains the top issue with 25 percent reporting this as their number one problem.
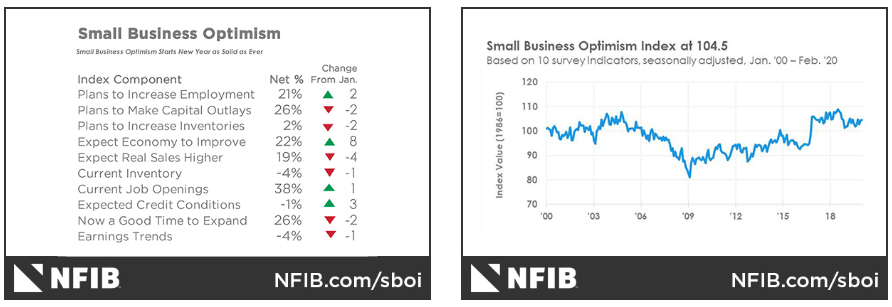
“The small business economic expansion continued its historic run in February, as owners remained focused on growing their businesses in this supportive tax and regulatory environment,” said NFIB Chief Economist William Dunkelberg. “February was another historically strong month for the small business economy, but it’s worth noting that nearly all of the survey’s responses were collected prior to the recent escalation of the coronavirus outbreak and the Federal Reserve rate cut. Business is good, but the coronavirus outbreak remains the big unknown.”
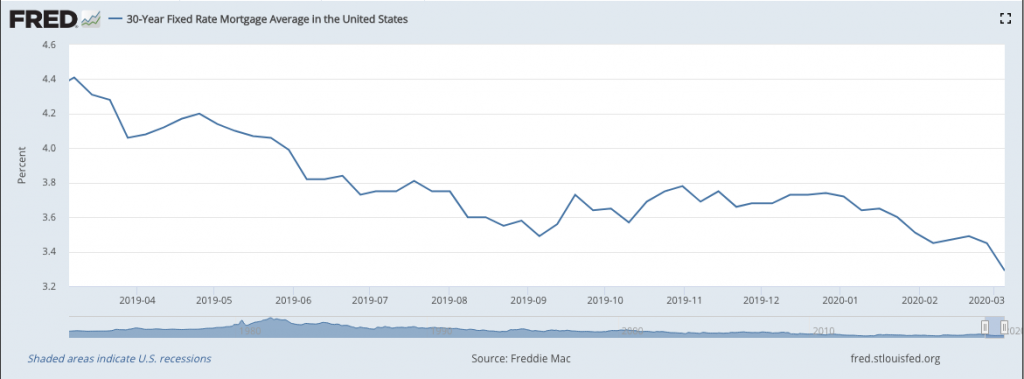
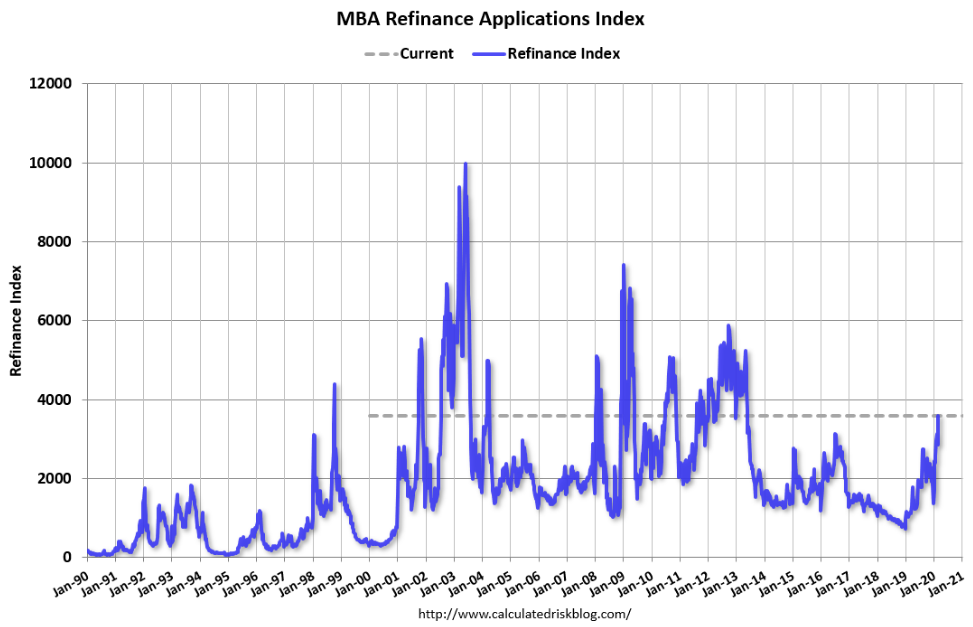
Given that the surveys were collected before the COVID-19 outbreak and Fed rate cut, it remains to be seen if the trend in the NFIB index can remain in place through March. I think it same to assume weakened sentiment going forward, but that is also likely to be pared with increased mortgage refinancing activity amongst homeowners. Mortgage rates hit 3.11% on Monday, according to Mortgage News Daily.
“Demand has ramped up in a way that many lenders have never experienced,” said Matthew Graham, chief operating officer at Mortgage News Daily, which tracks rates every morning. “Some of them have taken to raising rates in order to deter new business. Others have completely stopped accepting new applications.”
One borrower who called Bank of America on Saturday was told there would be a two-hour wait to speak with a loan officer. At Cross Country Mortgage, a small lender in Boca Raton, Fla, phones were ringing before 8:00 am Monday. They have increased hours and are trying to find more staff to handle the volume, which is now triple the usual. A Wells Fargo spokesperson said they are ramping up staff to deal with the onslaught.
“We continue to hire underwriters, processors and closers into our fulfillment group and we’re also executing on opportunities to shift team members from other non-fulfillment groups into our fulfillment operation,” said Tom Goyda, a spokesman for Wells Fargo.
And as for rates: “Lenders look at a lot of factors when setting mortgage rates and they are most directly tied to MBS yields, which have seen a widening spread relative to the 10-year Treasury yield,” added Goyda.
The Mortgage Bankers Association is now forecasting total mortgage originations of approximately $2.61 trillion this year — a 20.3% gain over 2019′s $2.17 trillion and a jump from last month’s forecast of $1.99 trillion.
Refinance originations are driving the change, now expected to double earlier MBA projections, and jumping 36.7% from last year to about $1.23 trillion.
Purchase originations are now forecast to rise 8.3% to $1.38 trillion, up from the previous forecast of $1.32 trillion.

With the potential for job losses due to COVID-19 looming, refinance activity will also be closely monitored by investors and economists going forward. Refinancing can put additional cash in the pocket of the consumer, potentially offsetting some of the economic impact from COVID-19.
There is a great deal for investors to weigh in the near-term, but I would be of the opinion the market turmoil and reduced valuations of the day will breed long-term opportunity for patient investors. Nonetheless, my cautiously optimistic sentiment is rooted in the history of such market conditions that ultimately and statistically lead to strong returns. For more on the near-term outlook, let’s see what Morgan Stanley’s Chief Investment Officer Lisa Shalett has to say on all things COVID-19, economic and market-related:
“Recession odds have materially increased. Initially, with news of the outbreak in China, investors worried about potential supply disruption. Now, the concern lies with a shock to both supply and demand. The full extent of lost activity is unknowable at this point. The longer consumers and corporate executives remain uncertain about the risks they face, the more likely they will curtail spending, creating a major headwind for economic growth.

“The expected growth slowdown may not last into the second half of the year and global growth could recover. Disrupted supply chains would resume quickly if demand picks up. There are some positive signs: new coronavirus cases in China appear to be declining and global health organizations are working together better.
When nerves calm and business activities resume, pent-up demand could fuel economic growth. In this scenario, the housing and construction markets, lifted by low interest rates, could provide a catalyst for more spending. Stocks could rebound, but Treasuries would likely sell off.
Investor Advice
Until some of the uncertainties lift, valuing stocks remains a challenge and “patience, but preparedness” remains my advice for any investor with more than a six-month investment horizon (less than that, reducing your allocation to global equities may make sense).
Pay attention to consumer and CEO confidence, the strength of the dollar and reported load of new coronavirus infections. A dip in that number globally may start to lift uncertainty and jumpstart global demand. At that point, investors should consider moving out of bonds and into U.S. and emerging-market stocks.“


