Once vaccinations start, how quickly can they lower daily new COVID-19 cases: Although the market understands that vaccination will lower daily new cases, the trajectory of the decline remains one of the top incoming questions we receive. We leveraged our previous epidemiological model and,after updating it for the recent uptick in daily cases (mean (sd) daily cases forecasted to reach ~240,000 (±55,000) by YE20), we simulated how different vaccination scenarios can impact the daily case trajectory. Given the uncertainty around the rate of vaccine adoption, we have simulated 5 distinct scenarios. The scenarios (based on percentage of total population vaccinated) that we evaluated (Exhibit 1) assume vaccinations start on Jan 1,2021:
- Low monthly vaccination rate (2%) in Jan-Feb that slightly increases in March (5%) and remain unchanged until Oct (blue line)
- Low vaccination rate in Jan (2%) that increases up to 10% by Aug (purple line)
- Low monthly vaccination rate (~3%)until April and higher monthly rate (15%) during May-Sept
- Modest vaccination rate (5%)until Sept and high rate (25%) in Oct (green line)
- Modest vaccination rate (6%)until April and high rate (15%) during MaySept (yellow line)
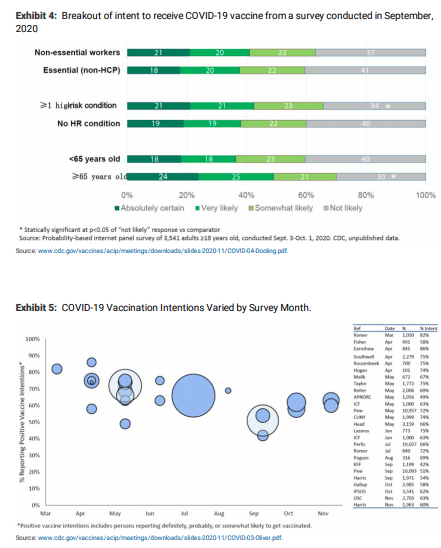
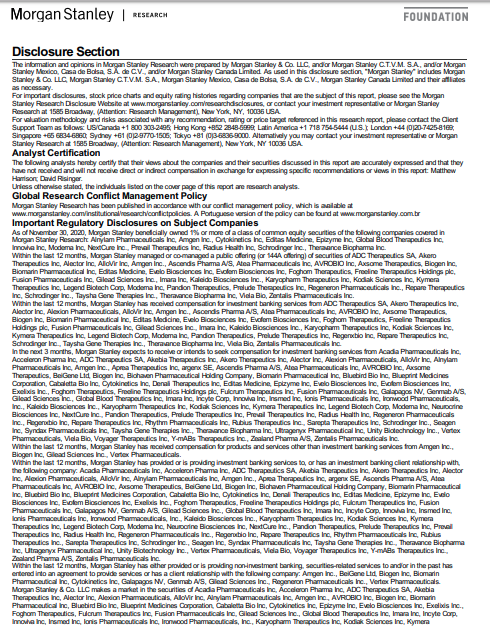
Simulations suggest that vaccinations can end the pandemic by late summer/early fall 2021: Note that (1) All scenarios above assume 90% vaccine efficacy (i.e. 10% vaccination means that 9% of the population is protected from symptomatic COVID-19 infection); and (2) The value of R was kept unchanged across all scenarios (vaccination impacts the effective reproduction number not R ) and, therefore, the difference in the decrease in cases across scenarios is solely driven by the difference in the remaining susceptible population following vaccination. We highlight that according to CDC presentations (here and here), the portion of the adult population with a strong intention to be vaccinated is ~40-50% (Exhibit 4). The portion of adults in US with any positive intention to be vaccinated has been 40-85% over time and recently is stable at ~60% (Exhibit 5). We believe that the recent positive vaccine efficacy readouts may increase individual’s desire to be vaccinated. Please note that adolescents (12-18 years are just being studied now) and pediatric patients (trials have yet to start) will not be eligible for vaccination initially. We would expect adolescent data from Pfizer in the coming months and Moderna by spring 2021. Pediatric data could follow within 3-6 months after the adolescent population. We would expect Middle and High School students to be able to be vaccinated prior to the 2021/2022 school year. These populations represent ~20% of the US population.
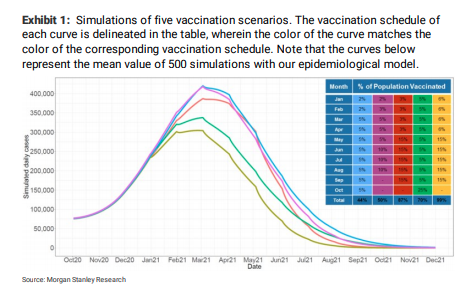
The key takeaways from our simulations include: (1) Simulations suggest that a reduction of the daily cases down to ~25,000 (equal to number of cases in midMarch 2020) can be achieved as early as July 2021 under the scenario of ~100% vaccine adoption that commences as early as Jan (yellow line). However, in case the early vaccination rates are low (~2% monthly) during early 2021 and only increase modestly (~5% monthly) throughout 2021, the reduction of cases down to ~25,000 will be delayed by ~2+ months (blue line); (2) Aggressive vaccination in Jan, that leverages the entire vaccine availability can limit the peak daily cases in 2021 below ~300,000 (yellow line) , whereas slow vaccine adoption can result in a peak of up to ~450,000 daily cases assuming no strict lockdown measures (blue, purple lines); (3) All scenarios indicate that dropping daily cases to insignificant values does not require vaccination of the total population (100%), confirming the assumption that herd immunity could potentially be achieved by immunizing only a portion of the population (see below); (4) Vaccine adoption early in 2021 has a high impact on the peak daily cases, whereas vaccine adoption later in 2021 has an impact on the time required to attenuate the daily cases to ~25,000. For the assumptions underlying our approach see Assumptions underlying our model/approach.
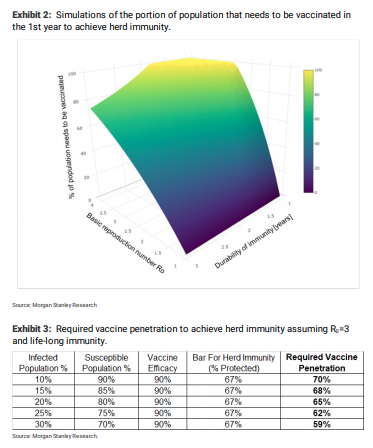
How many people need to be vaccinated or infected to achieved herd immunity? Assuming that the duration of immunity that is offered by the vaccine is ~1 year, for R values of ~1.5-2(we believe R is ~1.6), the proportion of the US population that needs to be immunized in the 1st year to achieve herd immunity is ~47-80% while for R values of 2.5+ it is ~100%. On the other hand,assuming life-long immunity and R =3, the required vaccine penetration for herd immunity is 60-70% (Exhibit 3). For the assumptions underlying our approach see Assumptions underlying our model/approach.
COVID-19 vaccine timeline: As we discussed here, we expect the vaccine roll-out in the US to be characterized by 3 phases: (1) The initial EUA population of healthcare workers and long-term care facility patients will have access to ~40- 50M doses (~20-25M people) by YE20; (2) A potential expanded EUA population including front-line workers,high-risk patients and elderly (over 65+) will be granted access next and likely vaccinated during 1Q21; (3) We would expect anyone who wants to be vaccinated to be able to receive a shot starting in April 2021. Based on comments from Pfizer/Moderna and Moncef Slaoui (scientific head of Operation Warp Speed), we believe that doses for ~15-25M people will become available each month starting in January.
Assumptions underlying our model/approach
Our approach assumes that 100% of the population (including children) may have access to vaccines. This may not be the case at the early stage of the vaccine launch as the vaccine data on children is limited and vaccination of children may be delayed/avoided.
- We assume that vaccine efficacy is equal to 90%. In addition, we hypothesize that the 90% of the people who are successfully vaccinated are not only immune but also they cannot infect other people (which is yet to be proven)
- We assume that vaccine availability begins no later than Jan (under EUA)
- The portion of population with natural immunity is unknown and therefore not explicitly included in our calculations.For example,a potentially high % of existing natural immunity will lead not only to a faster reduction of daily cases in 2021 but also lower the % of people that need to be vaccinated to achieve herd immunity
- We look at the US as a homogeneous region;however, seroprevalence studies have indicated that the % of the infected population may vary significantly across states. Each state may reach herd immunity at different time points that differ from the time point at which US reaches immunity
- The parameters of the model have been chosen to capture the current trend in daily cases while the vaccination scenarios are selected based on potential patterns in vaccine adoption rates
- Our approach assumes that people who decide to get vaccinated will receive all required doses for efficacious vaccination
For Exhibit 3, we assume the immunity gained from either infections or vaccinations does not wane out. With an R0 of 3, we set the bar for herd immunity as % protected to be ~67% based on the formula 1-1/R0. With vaccine efficacy of 90%, the required vaccine penetration is calculated as (67% – % infected population) / 90% / % susceptible population. The % of vaccine penetration refers to the % of susceptible population (and not the % of total population) that needs to be vaccinated.
How we attempt to calculate herd immunity: Based on the SIR model, the % of population that needs to be immunized (either through COVID-19 infection or through a vaccine) in order to reach herd immunity is 1-1/P , where P is the basic reproduction number. However, this formula assumes 100% vaccine efficacy and life-long immunity. Given that the covid vaccines that are currently being developed have <100% efficacy and the durability of the immunity they offer is currently unknown, the formula 1-1/P cannot anymore be applied to calculate the % of people who need to be vaccinated to achieve herd immunity. To this end, we assumed 90% vaccine efficacy (slightly lower than what was reported by Pfizer/Moderna given the higher heterogeneity in actual population vs trial) and implemented a more complex formula derived from the SIR model to calculate the % of population that needs to be vaccinated in the 1st year to achieve herd immunity (details here and here). In Exhibit 2we present the % of population that is required to be vaccinated under different values of R (1-4) and distinct values of immunity duration delivered by the vaccines (1-3years). Recall that although prior COVID infection may offer immunity for at least 6+ months (reference), the duration of the immunity remains unknown. As expected, the higher the R, the larger the population that needs to be vaccinated to achieve herd immunity; similarly, the shorter the immunity duration, the larger the population that needs to be vaccinated. We note that the value of R in the US has been reported to be ~1.6 (cutoff Jul 30th) or higher depending on the method/data set utilized. Based on our calculations of Re in the US, and the relationship R =R /(1-P) where P is the proportion of the population who are not susceptible at that time (reference), we believe that a range between >1 and 4 is reasonable. Recall that the exact proportion of the immune population is unknown (as the actual cases are likely higher than the reported), and therefore it is challenging to estimate the exact R -R relationship.