

Research Report Excerpt #1
Nonetheless, some variables provide greater force and as such are characterized as force factors. I’m of the opinion, the force factor of the day is monetary policy, the Fed (FOMC).
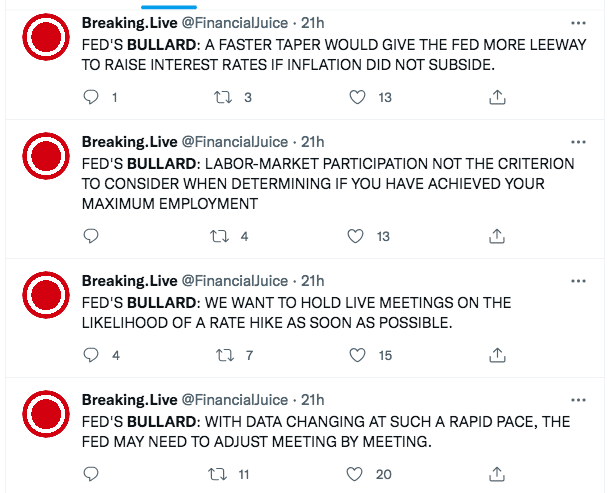
The tweet stream above from St. Louis Fed President James Bullard Friday identifies his commentary shortly after the release of the November Nonfarm Payroll report. James Bullard is one of the most respected Fed Presidents, who has historically been “dovish”, but turned more hawkish during the period leading up to the “tapering” announcement at the November Fed meeting. Although he is a non-voting member in 2021, his influence amongst the FOMC members is profound. He is a trusted and widely admired Fed President. So when Bullard speaks about increasing the pace of tapering and future rate hikes, this forces investors to consider the markets’ valuations, given his previous messaging on tapering came to fruition.
Research Report Excerpt #2
While there is now a 50% probability of a May 2022 rate hike, this still recognizes NO PROBABILITY for a hike in May. This is where history has never been wrong, as I will explain and answer the question, “But Seth how is a 50% probability NO PROBABILITY?”
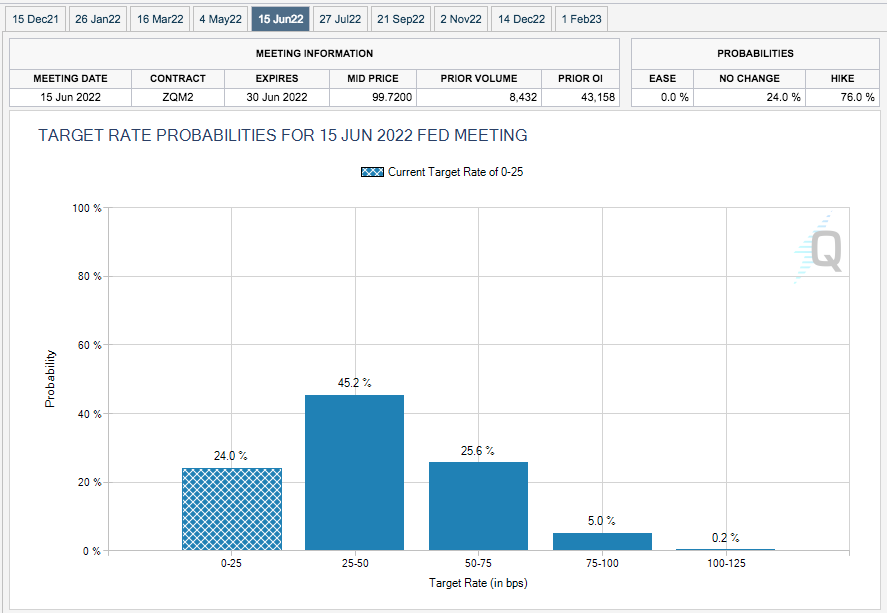
The bar chart of Fed Fund Future monthly contracts above aims to offer a daily tracking of the probabilities for Fed rate hikes at monthly Fed meetings (date of Fed meeting noting in top row). I pulled the June 2022 probability chart because that is the first Fed Fund Futures monthly meeting where investors are betting a rate hike will ACTUALLY occur. The upper right-hand corner of the chart shows the Rate Hike probability at 76% presently. This changes every hour of every day, and there is certainly a long time between now and June 2022 for the probability of a June rate hike to improve or deteriorate, increase or decrease.
Historically, a 50% probability of Fed action results in no action, that’s why it’s not a true probability, as we study Fed Fund Futures. However, if the probability is 60% or better, the Fed has always delivered upon the probability assigned. If the probability was 60% or better for no change in Fed rates; that is what happened. If the probability was 60% or better for a hike or lower rates; that is what happened. The 60% or better probability has never, in the history of Fed Fund Futures existence, failed to deliver the probable action by the Fed. As such, today’s 50% May Fed Fund Futures rate hike probability is still a NO PROBABILITY. Nonetheless, where investors had previously opined over a mid-2022 rate hike, they are now forced to consider a rate hike even sooner if the May Fed Fund Futures continue to rise, which they did on the heels of St. Louis Fed President James Bullard’s comments Friday. The May probability, based on Fed Fund Futures for May jumped from 40% to 50 percent.
Research Report Excerpt #3
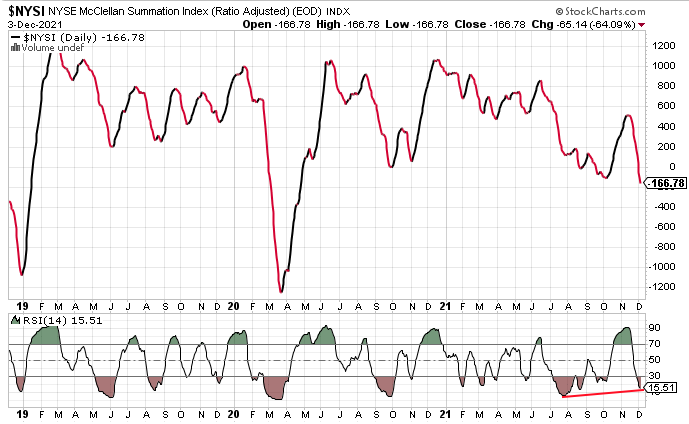
The NYSE Summation Index (NYSI), another broad market breadth indicator, has reached a new 2021 low as of Friday, eclipsing the October 2021 low. In doing so, however, the 14-day RSI has not made a lower-low (bottom panel). This suggests that the downward pressure has not been as strong as it was in the August through September period. We’ve looked at this bullish relative strength divergence during the September 5% drawdown in the S&P 500 to identify strength or weakness/weakening in the downtrend. While the NYSI made new lows in September, the 14-day RSI was higher than in August. The bullish divergence then helped Finom Group identify a potential dip buying opportunity that was realized for profits and with new highs for all major averages in October and November thereafter. The current relative strength level is still concerning, but may be informing of another dip-buying opportunity for investors is afoot.
Research Report Excerpt #4
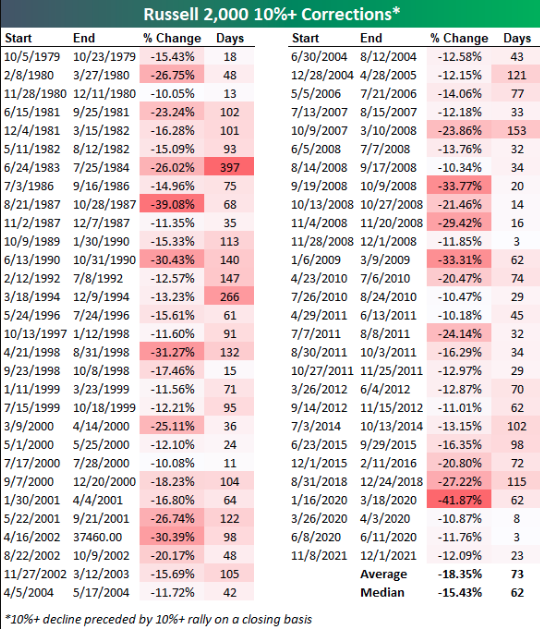
In terms of extremes, the biggest correction that the Russell 2,000 has ever experienced was the 41.9% decline seen during the initial COVID Crash from 1/16/20 to 3/18/20. The longest correction lasted 397 days from 6/24/83 to 7/25/84.In terms of the shortest correction, there were two that lasted 3 days. One of those came during the Financial Crisis while the other happened last June.
As I have offered in the recent past, the mile markers of a transition from early stage bull market to mid-cycle bull market is often marked by a flight from small-caps and speculative stocks toward large-cap, growth stocks. The oversold conditions in small-caps from the previous week only resulted in greater oversold conditions. This only serves to further inform investors of the current mid-cycle bull market regime. I do still anticipate a bounce in the small-cap index, given oversold conditions eventually lend themselves to an oversold bounce, but this is not what I would be “chasing”.
Research Report Excerpt #5
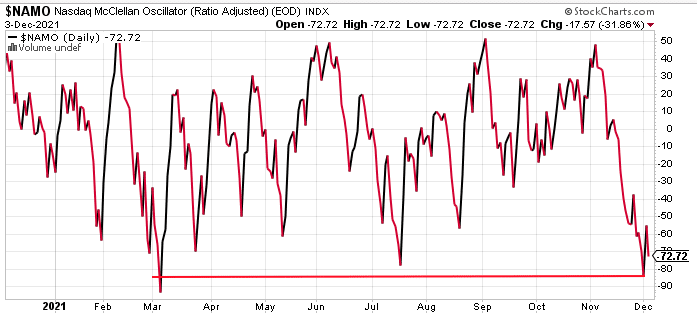
The Nasdaq McClellan Oscillator also made a new low for the 2nd half of 2021, although narrowly missing a new low for the year. This breadth metric for the Nasdaq also informs of deeply oversold conditions. The Nasdaq is seemingly going through a goodly amount of mid-cycle cleansing as well, given its tech-heavy weighting and the concerns over rising rates and how that would impact unprofitable tech companies. Recall the following chart from our weekly State of the Market below:
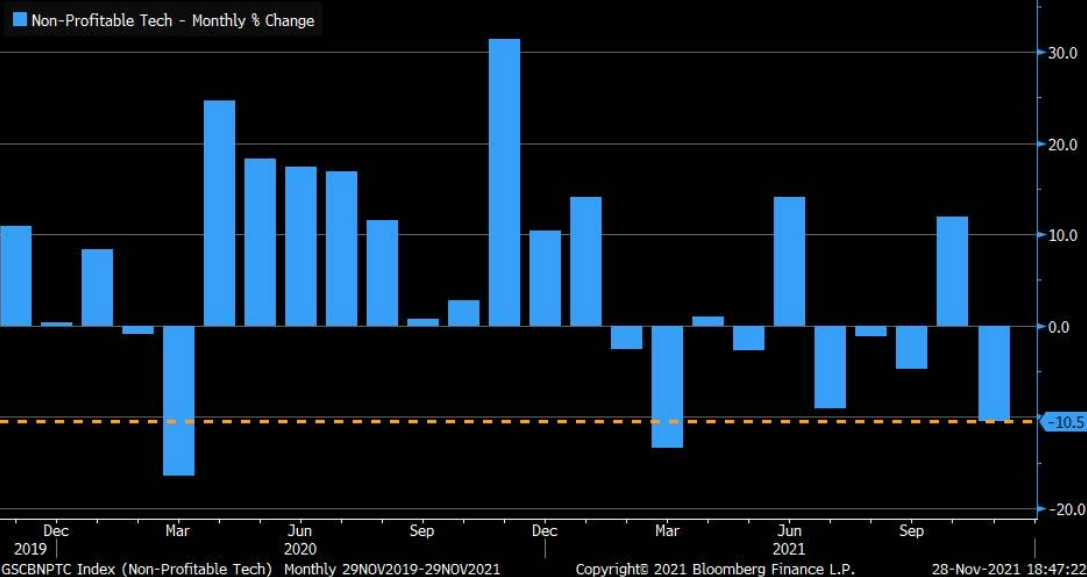
While the Nasdaq itself is down 7% from its all-time high, Non-Profitable Tech is down a greater 10.5% since November. With considering the market climate and path forward, despite the 7% drawdown in the Nasdaq, this is where I prefer to buy dips, given the concentration of growth stocks that make-up the Nasdaq and/or its driving force, the Nasdaq 100 (QQQ/NDX).
Research Report Excerpt #6
In another encouraging sign, the size of the labor force grew substantially. Some 594,000 people rejoined the labor force in November, based on a separate survey of households. The so-called rate of participation rose two ticks to 61.8% and reached the highest level since the start of the pandemic.

While the attention is captured by the headline Nonfarm Payroll number, this is what offered Fed President James Bullard the ability to message that much more hawkishly on Fed tapering & future rate hikes. The household survey showed a gain of 1.91 million jobs in November. This is the largest jump since October 2020.
Research Report Excerpt #7
For 2022, the bottom-up EPS estimate for the S&P 500 (which reflects an aggregation of the median EPS estimates for CY 2022 for all of the companies in the index) is $222.32. If $222.32 is the final number for the year, it will mark the highest (annual) EPS number for the index since FactSet began tracking this metric in 1996. However, what is the likelihood that $222.32 will be the final EPS value for the S&P 500 in 2022?
Insight/2021/12.2021/12.03.2021_EI/sp500-bottom-up-eps-start-of-year-vs-final.png?width=912&name=sp500-bottom-up-eps-start-of-year-vs-final.png)
Research Report Excerpt #8
Since 1930, if we exclude the best 10 days per decade, the S&P 500 return would be only 58 percent. That’s crazy right. Now remember that the best and worst days tend to occur near the same time. (chart below)
- The best days often follow the worst days, and the worst days occur in periods of above average volatility (red dotted line).
- These volatility spikes happen in lousy markets, so, if you can avoid the very best days, you will probably also avoid the very worst days, thereby avoiding lousy markets.
- You don’t know exactly when a lousy market will develop, and therefore it is a best practice to simply stay in the market, and buy the dips, because you’re also likely going to miss the best market days.
Research Report Excerpt #9
Another VIX metric is also confirming a potential bounce and easing of volatility; the 10-day ROC (rate of change) of the VIX. Previous reversals from a position around the +50% line have usually resulted in a market rally (chart below). The fact that we got to 75% this past Friday does tell us more about what the market is trying to do, which may be related to addressing potential Fed rate hikes by resetting the P/E ratio to one degree or another. You’ll notice in the VIX 10-day ROC that we got well above 50% during this spike. This is different, this is not the typical market dip and volatility spike we’ve seen since late 2020 and should be respected. It is validating everything we’ve offered related to the force factor of monetary policy within the context of a potential rate hike regime.

If it were about Omicron, we would expect to see a similar VIX spike severity as seen during past Covid variant periods? So it’s something else, and more probably RATES forcing an adjustment to the S&P 500’s P/E ratio. As such and until proven otherwise, any interim easing of volatility that coincides with an S&P 500 bounce may prove fleeting, with a resumption of further volatility and equity market pressure.


