
What drove markets on Monday? Apparently nothing, as all 3 major U.S. indices finished just about flat for the day. It was if the trading day never took place if one looks at the closing values. The S&P 500 finished the trading day off .29 points for the day and on the heels of a rather rough ride for trade across the pond, in Europe. European trade was dragged down by a rather poor showing in the broad manufacturing sector.
The flash eurozone manufacturing purchasing managers index fell to an 83-month low of 45.6 in September, down from 47 in August. Economists polled by FactSet expected a 47.3 reading, and any reading below 50 indicates worsening conditions.
German manufacturing PMI fell to 41.4 in September from 43.5, the worst reading in more than a decade. The flash eurozone services PMI fell to an 8-month low of 52 from 53.5 in August, which was below the 53.2 reading expected by economists.
“Declines were broad-based, across countries and sectors. The composite measure fell to a new cycle-low in a sign that the economy may be inching closer to contraction,” economists at Morgan Stanley told clients.
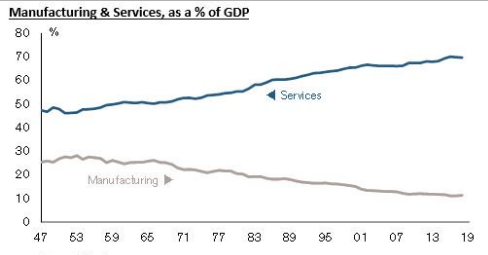
But while the Eurozone economy continues to falter, awaiting a pro-economic stimulus plan to rollout, the U.S. economic data suggests the worst MIGHT be behind it with regards to the manufacturing sector. It’s appropriate to recognize that the U.S. manufacturing sector only represents about 11% of GDP, and declining. Nonetheless, better data is better data.
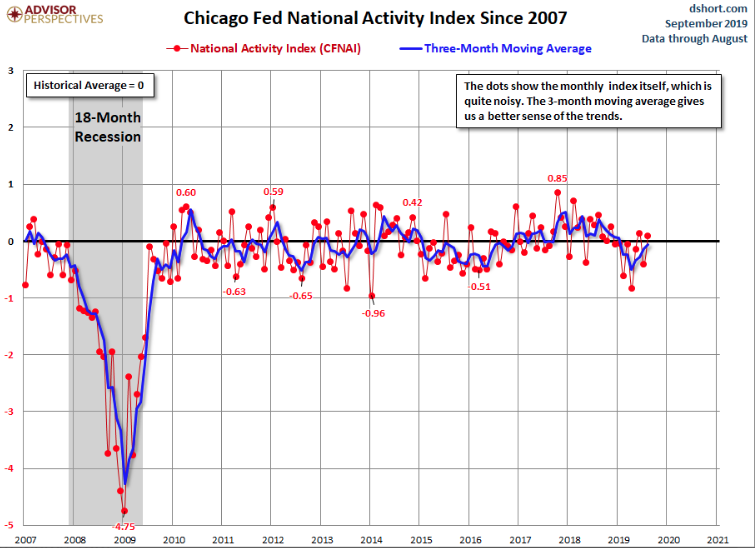
With that being said, on Monday it was revealed that the Chicago Fed’s National Activity Index (CFNAI) rose, when most economists were looking for a decline. Led by improvements in production-related indicators, the CFNAI rose to +0.10 in August from –0.41 in July. All four broad categories of indicators that make up the index increased from July, but three of the four categories made negative contributions to the index in August. The index’s three-month moving average, CFNAI-MA3, edged up to –0.06 in August from –0.14 in July.
The better than anticipated U.S. economic data didn’t stop there as Markit manufacturing data also proved to grow during the month of September. The initial reading of U.S. manufacturing Purchasing Managers’ Index for September reached 51.0, the highest figure since April and up from 50.3 in August. Conditions can change between now and the final reading from Markit for September, which will be out Oct. 1.
Stronger new order growth and rates of output largely helped boost the overall sector this month, according to Markit. However, export order books continue to weaken, with the new work from abroad dropping for the fourth time in five months, Markit said.
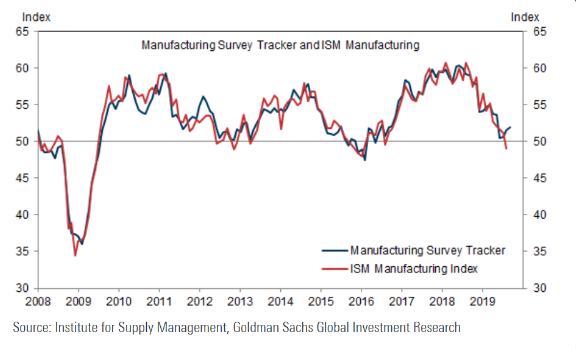
Between the better than anticipated Empire State, Philly Fed and CFNAI, the string of data has some economists believing that the ISM Manufacturing index may prove to recapture growth/expansion territory. Goldman Sachs’ recent manufacturing survey also identifies this sentiment.
After a rather lackluster quad-witching Friday last week and a half percent loss for the S&P 500, investors picked up where they left off yesterday, but are attempting to make up for it on Tuesday. U.S. equity futures are moving higher in the pre-market and for any reason one desires to put before the move. Is it the promise of October trade negotiations. Here is how Marc Chandler characterizes the speculation of near-term trade talks between the U.S. and China, and who may have the upper hand.
“A preliminary agreement is possible because China needs soy and pork, and the US needs for the uncertainty to be lifted or risk the historic-long expansion. It does not change the underlying dynamic that we think is pushing toward disengagement: not entirely and not overnight. Chimerica was really two ships passing in the ocean. It was a naive (and arguably dangerous) illusion .Nationalism and national security interests are in ascendancy over the interests of economic efficiency.”
But what investors may need to be more concerned with for the Tuesday trading session is The U.K. Supreme Court ruling on whether Prime Minister Boris Johnson lawfully prorogued Parliament. This could have some ripple affects across Europe, that could subsequently seep into U.S. markets. Fortunately, the ruling will come even before the open of trading on Wall Street. The decision, due at 10:30 a.m. local time (5:30 a.m. Eastern), could potentially result in the immediate recall of Parliament, which at the moment is shut down until Oct. 14, with a so-called hard Brexit looming on Oct. 31 in the absence of further action.
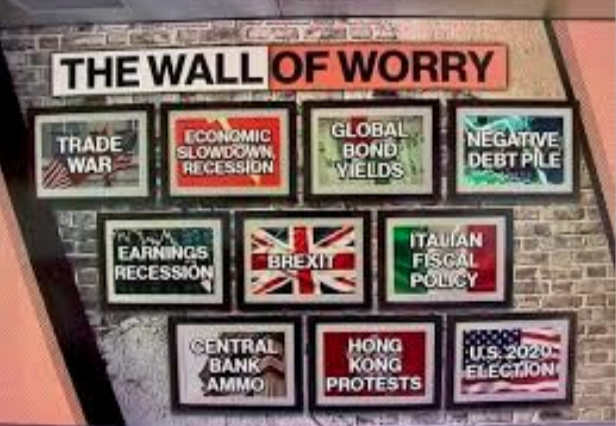
While there’s always a “wholelotta” geopolitical issues to consider, investors have seemingly been looking beyond these issues, remaining focused on improving data and the earnings outlook. The wall of worry, so to speak, never seems to dissipate, but rather moves to different issues of the day.
The earnings outlook for the Q3 period is not one that brings about a lot of confidence, but with central banks easing and the potential for easier comparisons come 2020, investors have leveraged up in recent months.
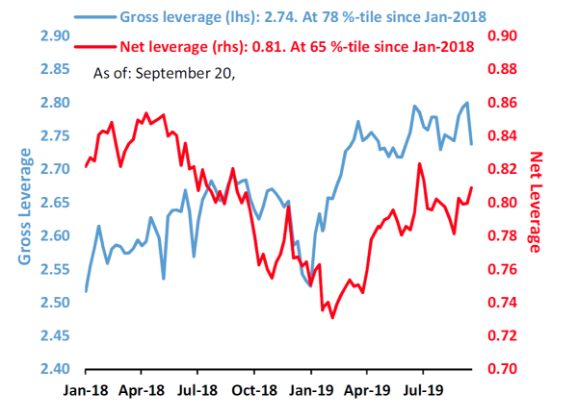
- Nets: continue to increase, now just shy of YTD highs.
- Gross: came down a little over the past week, but still at 78%-tile since Jan 2018.
Goldman Sachs suggests recent equity leverage is becoming stretched in their notes issued Monday: (from The Market Ear)
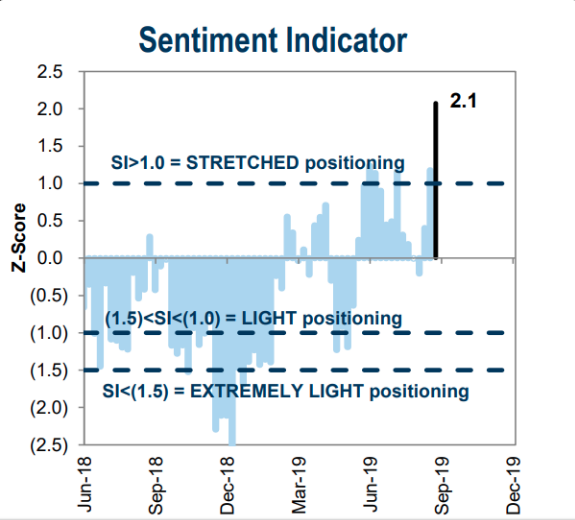
- Overall, positioning has also become more full within US equities.
- This can be best seen in GS Research’s recently reconstructed Sentiment Indicator. This more comprehensive SI is in “stretched” territory, suggesting near-term headwinds to the S&P 500.
- The enhanced SI combines six weekly and three monthly indicators of stock positioning across institutional, retail, and foreign investors:
- The Sentiment Indicator stands +2.1 standard deviations above the 52-week average.
- Readings above the “stretched” threshold of +1.0 have frequently corresponded with negative S&P 500 returns during the subsequent eight weeks
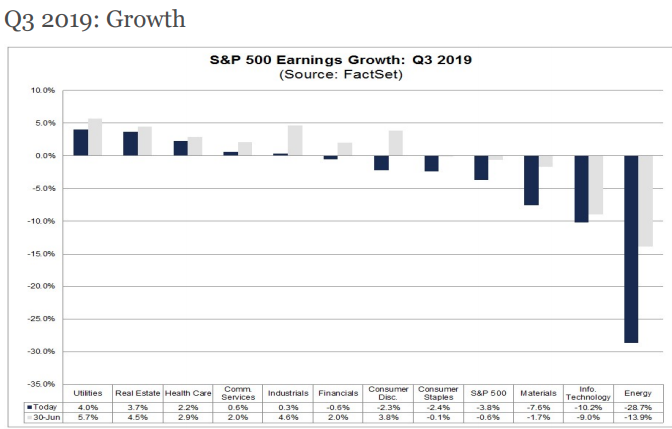
At present, FactSet forecasts Q3 EPS to decline by roughly 3.8%. This is a similar forecast to that which it had offered in Q1, as S&P 500 EPS came in roughly flat for the quarter.
Strategists and analysts are very torn as to what comes next for the market, given the many geopolitical, macro and technical issues to consider. Just how torn are strategists and analysts; Jim Cramer has offered both optimism and concern in each of the last two weeks and with the markets rallying. It was only a week ago that the CNBC “Mad Money” host declared that Apple (AAPL) and Microsoft (MSFT) could lead the markets to new all-time highs.
Citing technical analysis from stock analyst Dan Fitzpatrick, Cramer said Microsoft and Apple can provide some much-needed long-term influence on the S&P 500 and Dow Jones Industrial Average. The two indexes are both less than 1% off their all-time closing high set in July.

“The charts, as interpreted by Dan Fitzpatrick, suggest that Apple and Microsoft could both be ready to roar, potentially giving this market the leadership that it deserves.
If these two tech titans can break out to the upside here, Fitzpatrick thinks they’ll pull the whole Dow higher, and after looking at the charts, he likes the odds of a breakout.”
With this optimistic outlook just last week, Cramer became a bit more sanguine with his verbiage on Monday night. Investors ought to be cautious as more and more stocks are being valued based on measures other than the revenue or earnings numbers that their underlying companies produce each quarter, CNBC’s Jim Cramer warned Monday.
We can’t blame Cramer for this commentary on markets, given the litany of IPOs coming to market that simply don’t have earnings to offer investors.
“You have to be skeptical of markets, entire markets, where more and more stocks are valued on something other than earnings. This is what happened during the dot-com crash — you had tons of companies that were trading on eyeballs and page clicks,” he said. “The more stocks that trade on weird metrics, the more likely it is that the market’s overvalued.”
“You need to realize that sooner or later there will be a correction in the class of 2019 IPOs, and when that happens…”
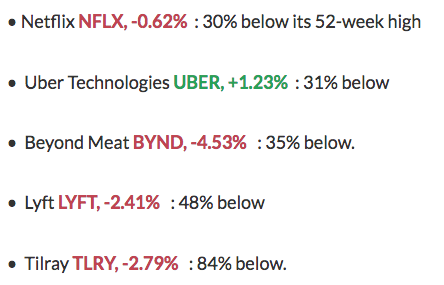
Cramer is concerned for these unicorn IPOs and even the correction in MOMO stocks such as Netflix (NFLX). But even though the MOMO trade has been out of favor in September, this hasn’t been a sign of market tops cites a recent column by Mark Hulbert.
“Contrary to conventional wisdom, high-momentum stocks typically do not fade as a bull market approaches its end. In fact, such stocks often produce some of their most spectacular gains in the weeks prior to the final top.
I reached this conclusion after analyzing a hypothetical portfolio constructed to always contain the 10% of publicly-traded stocks with the best trailing-year performance, reconfigured monthly. For the performance of this portfolio, I relied on data from Dartmouth College finance professor Ken French; to find out how it performed during the last weeks of bull markets, I relied on the bull/bear market calendar maintained by Ned Davis Research.
Since 1926, this portfolio produced an annualized return of 74.0% in the last three months of bull markets. That’s nearly double the 38.7% annualized return during all but the last three months of bull markets, and a 24.2% annualized loss during bear markets.“
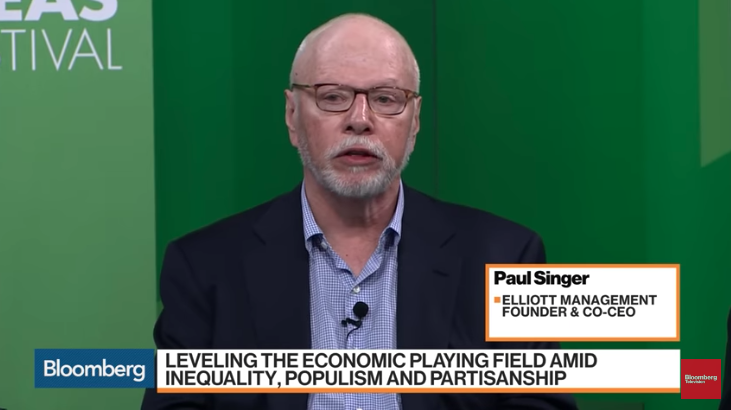
While Cramer flip flops from one optimistic view to another issue that builds upon the wall of worry, some portfolio managers are kissing the market goodbye and raising cash. Two years ago, Paul Singer warned the global financial system was in bad shape and investors were facing the possibility of a big market drop. The billionaire behind the $38.3-billion Elliot Management fund, raised about $5 billion in one day .
According to the Financial Times, Singer is asking investors for another $5 billion in anticipation of a “market meltdown.”
In this YouTube video, Singer is talking about his bearish forecast at a panel in Aspen last summer, when he said “The global financial system is very much toward the risky end of the spectrum in terms of debt”:
Not for nothing folks, but just because a fund manager has a big number under management, don’t believe for a second they are gurus or even outperforming markets. Singer’s fund is up almost 5% this year, the FT reported. This while the market is up nearly 19% on the year. And while Singer is singing a gloom and doom song, others are singing a different tune altogether.
In Finom Group’s most recent Research Report, we outlined the sideways movement in the market over the last 18 months, at least. We also reminded our subscribers of what happened during a like period from 2015 to July 2016.
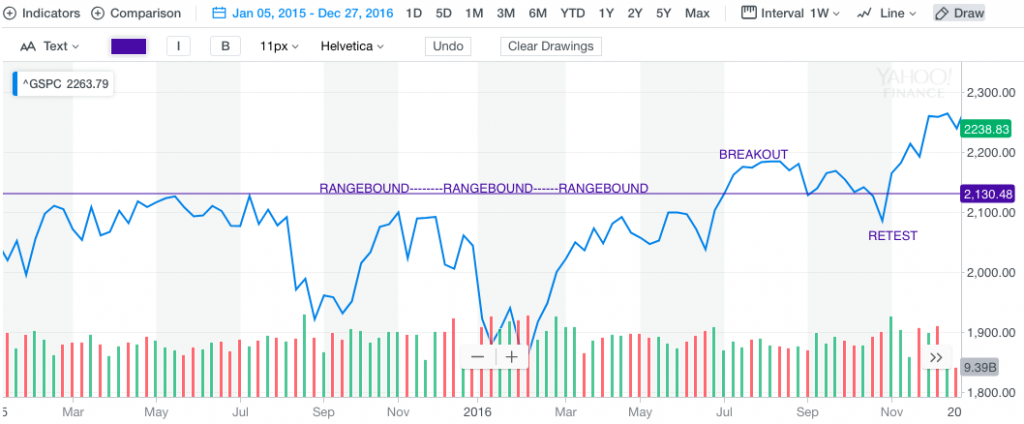
It was in July 2016 that the S&P 500 broke out of an 18-month consolidation period and eventually surge to new, all-time highs. By the way, the S&P 500 also broke out to new highs in July 2019. The sideways action is often promoted by the bears when suggesting the market has topped and is about to rollover, even as this narrative is not historically the greater probability for markets. Joseph LaVorgna, chief economist for the Americas at Natixis offered his analysis in this regard.
“Some investors have speculated that the market might be topping out ahead of a possible U.S. slowdown over the next year. However, this would be very unusual, as equities have always had a double-digit rally before the economy experiences a downturn.” (See table below.)
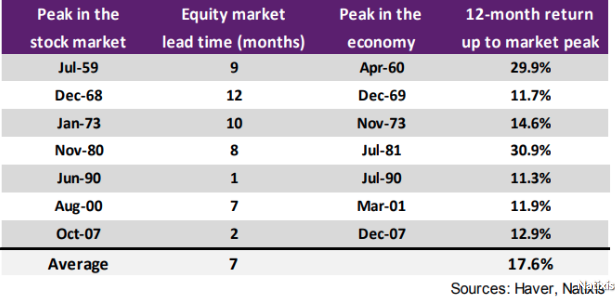
Identified in the table above, the stock market’s peak has come ahead of the economy in the run-up to seven of the last eight recessions dating back to 1960 and with an average lead of seven months. More recently, there have been much shorter lead times from the stock-market peak to the peak in the economy, Lavorgna noted, which “means that strong stock-market performance could persist until very late in the business cycle.”
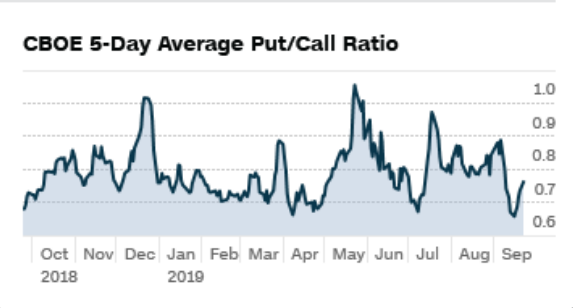
Finom Group’s weekly Research Report looks into a great many factors that suggest the market top has not been achieved and may not be achieved until at least 2020, as financial conditions are relatively loose, rates remain quite low and most sectors of the economy remain with expansionary characteristics. Equity market breadth, moving averages and internals have shown a long-term bullish trend, with a recent breakout that also finds strategists bullish on the long-term prospects for the market, even as the 5-day equity put/call ratio just turned up. Not for nothing, but it’s about time!
Let’s take a look at what some of the notable technicians, strategists and analysts have to say about market conditions and what they might be signaling.
- “The intermediate and long term gauges that we track have relatively new buy signals. They are very widespread,” said Katie Stockton founder and chief technical strategist at Fairlead Strategies. “Even in Japan, we’re seeing signs of life from a momentum perspective. There’s potential for it to be broad-based, not limited to the U.S.” Stockton said the S&P faces minor resistance at its high, and a measured move from there could be to 3,120. “That would be a Q4 target,” she said, adding a longer term move would be to 3,280.
- “We think the market is positioned to rally into the 2020 U.S. election. I will reassess when the November 2020 presidential election gets closer. Ari Wald, technical strategist at Oppenheimer, said based on past performance, the stock market could gain 20% to 25%, and in the past it has moved higher for 17 to 20 months before peaking. Our take is after a period of such little, poor market progress, we think returns should be better looking ahead. This looks a lot like the resets in 2011 and 2016.”
- Fundstrat founder and strategist Thomas Lee says these types of sideways markets have produced unusually strong gains, once they end. He pointed to three instances since WWII when the the market was near all time highs but had minor gains, within 3% over the trailing 12 months or under 5% for 20 months. Those periods were July 1952 to March 1954; May 1983 to December 1984, and November 2014 to July 2016. “In 3 of 3 cases, the resolution was a strong upside move in S&P 500 … with an average gain of 51% over the next 24 months,” Lee wrote in a recent note. “In other words, ‘nowhere markets’ have been resolved by a massive upside breakout in stocks. This implies we could see the S&P 50 reach 4,500 by the end of 2021. This is pretty eye opening upside.”
- Jason Hunter, head if J.P. Morgan global fixed income and equity technical strategy said the trade story could become a positive, and he is holding stocks that broke out in September and should benefit if trade negotiations go well. Hunter said he expects a positive trade story would propel the market, and the S&P 500 would break through trend lines at 3,040 and 3,060. “3,200 is what our fundamental guys had penciled in [as a 12-month target] and I think that’s a fair base case assumption,” he said.
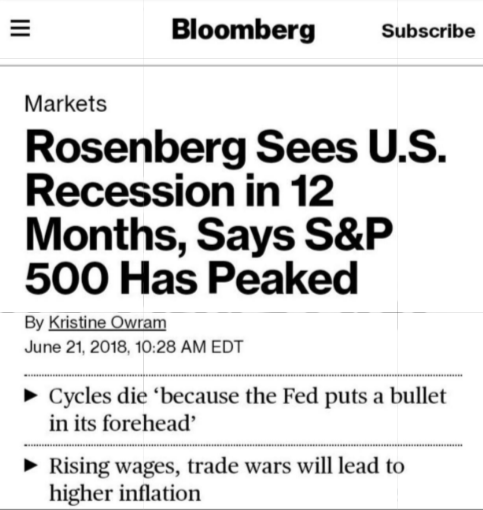
That’s a “wholelotta” positive outlooks proposed by various market pros, but it better come before the foreseeable recession according to Jeffrey Gundlach and David Rosenberg. Both foresee a recession before the 2020 election.
DoubleLine Capital CEO and longtime bond investor Jeffrey Gundlach said Wednesday that the odds of a recession before the 2020 presidential election are rising.
“I think the economic data has gotten a little bit better, yet I still think, when we put it all together … it seems that there is an increasing probability of a recession before the 2020 election.”
Though Gundlach said he looks at a variety of measures when trying to gauge recession odds, his preferred indicator is a measure of consumer sentiment. Where Gundlach leaves off with his recession prognostication, noted permabear David Rosenberg picks up the fear mongering ball.

“There’s a recession coming in the next 12 months,” he said last Thursday on CNBC’s “Futures Now.“
The Fed lowered its benchmark interest rate last Wednesday by a quarter point. Fed Chairman Jerome Powell signaled rates would only be cut again if there’s new evidence the economy is softening. However, Powell said he didn’t expect that to happen.
“The only reason that he said that he’s optimistic on the outlook is because of exactly what the Fed is doing which is breathing stimulus back into the economy.”
By the way, this is nothing new for David Rosenberg. Every year Rosenberg forecasts a recession within the next 12 months, every year. The same 12-month prognostication was offered to Bloomberg, by Rosenberg in June of 2018.
Some day David, some day! And while investors await that some day to become the present day, they will also turn their ears and eyes toward the economic calendar of data releases, which is rather light for Tuesday. At 10:00 a.m. EST, the Conference Board will release the latest Consumer Confidence reading. The index has remained elevated for much of 2019 and has been in keeping with both strong consumer spending and retail sales for much of the year.
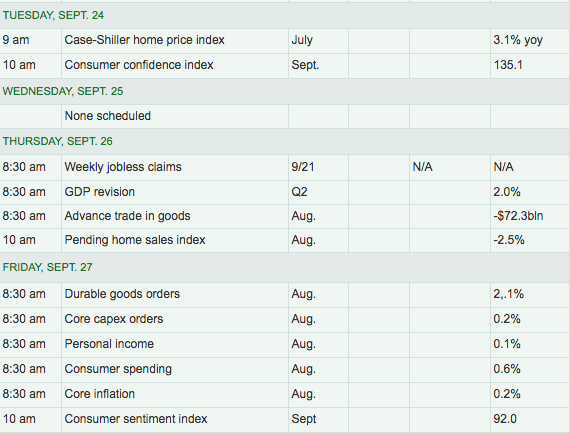
Later in the week, investors will turn their focus toward the final Q2 GDP reading, Pending home sales, PCE and Durable goods orders.


