

Research Report Excerpt #1

Are you trying to make quick returns and trading yourself out of the market, quickly… Or are you refining your long-term process for steady repeatable annual profits? Are you utilizing time/duration as your key asset for long-term success?
All good questions, that many have not been focused on since the March 2020 bottom and since the S&P 500 hasn’t had any protracted drawdowns, drawdowns that occur over months, not days or even weeks like the current cyclical bull market. Yes, the market has had typical drawdowns since March 2020, but the rebounds from those pullbacks have been extremely swift and proven inconsequential to the bulls, which include many newer investors/traders who have never lived through cyclical bear markets. The big picture perspective of how markets work under more normal conditions and without substantial fiscal and monetary supports may elude many investors/traders. So while the “fast money” has been made at the index level, and continues to be made, I would encourage investors/traders to understand that mean reversion or normalization is another fundamental truism of markets. The best way to prepare for such normalization is to know its inevitable and adjust to change when it arrives.
Research Report Excerpt #2
Research Report Excerpt #3
Research Report Excerpt #4
Simply put, we are of the opinion the labor market has been aiding in maintaining some degree of elevated inflation levels, while also exacerbating supply issues. As more and more people head back to work, fewer goods will be purchased on the fringe, given less time/trips to stores and while more service spending should be engaged. This will help alleviate some of the goods-supply issues over time. We are still monitoring the progress of this economic issue of the day, but note that September’s Nonfarm Payroll data may not prove a robust rebound for labor and employment in the meantime.
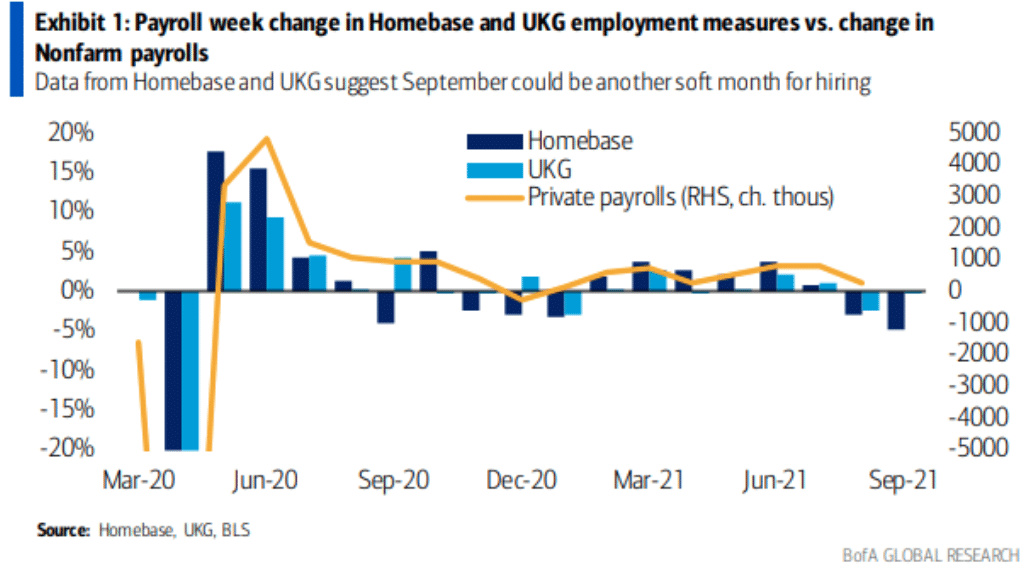
A number of factors that have created headwinds for the workforce return in 2021 were still in place during September, while Mother Nature also held back new job creation in September via Hurricane Ida. High frequency data from Homebase and UKG (Ultimate Kronos Group) suggest that the September jobs report may again be on the softer side, as shown above.
Research Report Excerpt #5
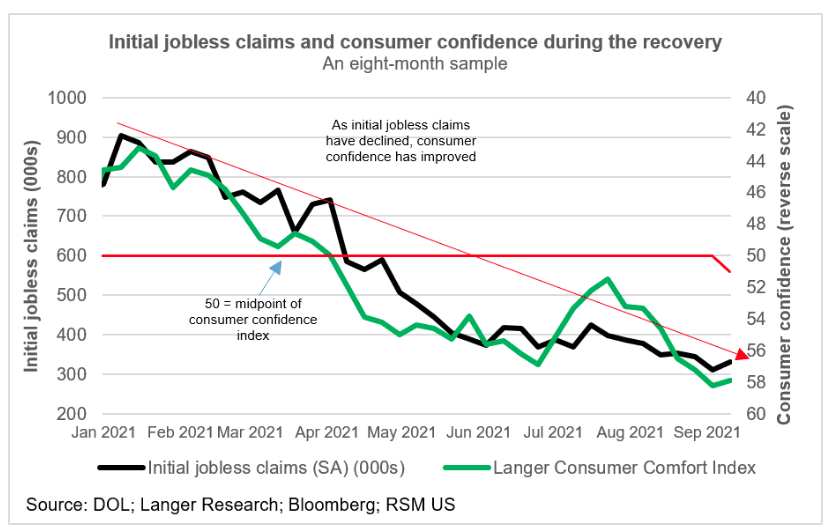
The economic impact of Hurricane Ida was evident in the most recent initial jobless claims data. There were noticeable increases in first-time claims, as one would expect, in New York, Pennsylvania, Connecticut, Louisiana and Alabama, according to government data released on Thursday. Given that the impact of the storm unfolded over the better part of a week, we think it will be early October before we get a sense of the true underlying trend in claims.
With now 2 weeks of consecutive increases, this may also be one of the reasons we’ve yet to see a meaningful bounce in consumer sentiment/confidence from the August lows (University of Michigan Consumer Sentiment Survey) The following chart offers how correlated jobless claims and consumer sentiment track.
Research Report Excerpt #6
The Conference Board Leading Economic Index (LEI) for the U.S. increased sharply in August, fueled by positive contributions from all components except for consumer expectations for business conditions and average weekly manufacturing hours. In the six-month period ending August 2021, the leading economic index increased 6.4% (about a 13.1% annual rate), up sharply from 3.4% (about a 6.9% annual rate) over the previous six months. In addition, the strengths among the leading indicators remained widespread.
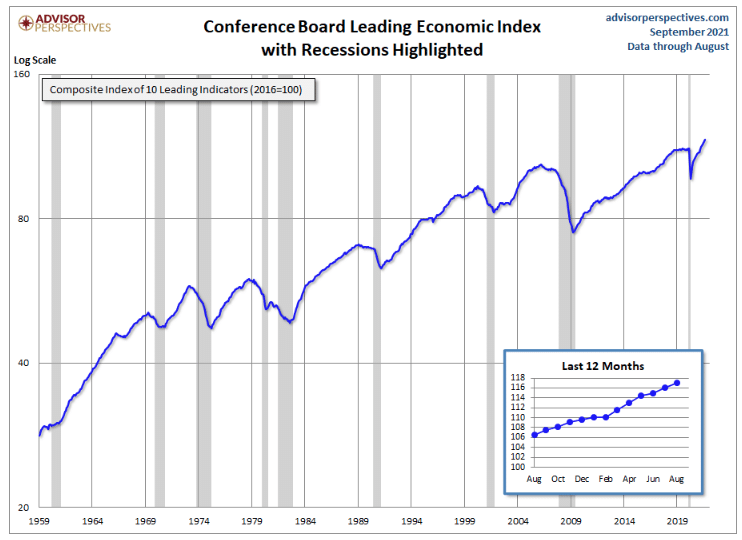
Now, also recall that the Leading Economic Indicators (LEI) remain at extremely strong levels, which tends to precede strong earnings and S&P 500 returns. Recall this study from FundStrat, concerning forward S&P 500 returns when LEI levels are as strong as they are today (9.9% YoY):
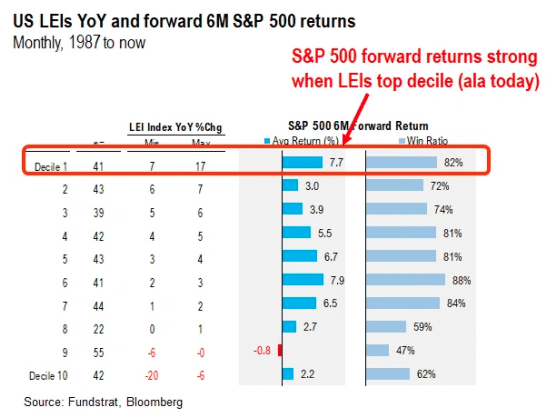
- S&P 500 averages ~8% 6M forward returns when LEIs >7% YoY
- According to the data compiled by “tireless Ken” and our data science team, S&P 500 6M forward returns are unusually strong.
- When LEIs >+7% YoY – S&P 500 6M forward returns +7.7% – win-ratio is 82%
- This implies S&P 500 would rather >4,480 by November.
Research Report Excerpt #7

Research Report Excerpt #8
To better understand the overall interim directional trend, it may prove better to take a broad market approach by way of the NYSE % of stocks above their 200-DMA relative to the % of stocks above their 50-DMA. Remember, if the chart shows the trend line moving higher, the interim trend is weakening, and when the trend line is moving lower, the interim trend is strengthening.
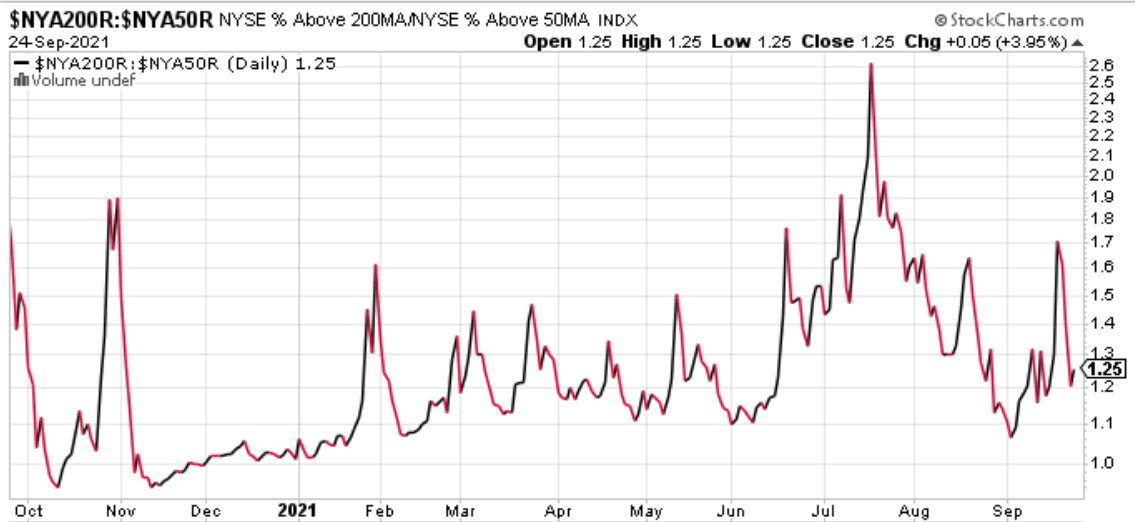
Based on the breadth indicator chart above, indeed, the interim trend strengthened on the week, going from 1.70 down to 1.25 to finish the week. Nonetheless, Friday did find some folks either taking profits or reducing exposure altogether, given the slight rise in the breadth indicator on Friday. We can’t make too much of this Friday’s action, and should probably lean into the absolute level identifying a stronger interim trend for the week was accomplished. Cautiously optimistic!
Research Report Excerpt #9
Let’s consider the big picture for a moment and reassert that this is a SECULAR BULL MARKET, which likely started in April 2013, the day that the S&P 500 cleared its double top from 2000 and 2007.

Now, look at the sector ETF gains since:
- Technology (XLK): +483.24%
- Communication Services (XLC): +321.11%
- Consumer Discretionary (XLY): +283.21%
- Health Care (XLV): +221.26%
- Financials (XLF): +197.96%
- Industrials (XLI): +183.41%
- S&P 500 ($SPX): +180.21%
- Materials (XLB): +146.63%
- Real Estate (XLRE): +143.40%
- Consumer Staples (XLP): +119.09%
- Utilities (XLU): +117.66%
- Energy (XLE): -12.29%
Aggressive sectors lead by a very wide margin during secular bull markets. Laggards since 2013 include materials and energy, two sectors adversely impacted by a rising dollar environment, and three defensive sectors.


