
February was a difficult time for investors, having to grin and bear the first market correction in roughly 2 years. Some investors in the market threw in the towel so to speak, others staid the course and were rewarded for their longer-term vision. And so here we are once again on the cusp of another SPX correction, but… but with nearly 3 quarters worth of economic and corporate earnings growth in the rear view mirror, staring at another quarter ahead that may prove to produce 20% YOY earnings growth and consumer spending that is accelerating to various degrees…sounds promising right? Well of course for every pro there is a con and we’ll touch on those cons later. But before we do let’s look at the week that was.
Major Averages & Expected Move Ahead
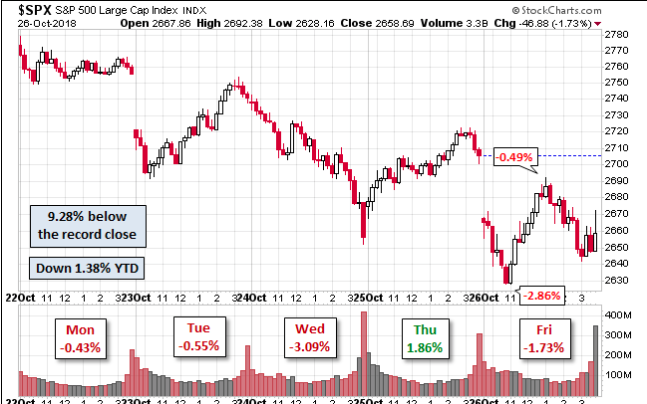
As depicted in the chart above, the S&P 500 experienced losses 4 out of 5 days this past week and neared a correction on Friday, closing 9.28% below the record close. Friday saw a loss of 1.73%. The index is down 3.9% from last week and now in negative territory for 2018 by nearly .5 percent.
These losses add to a sharp drop seen throughout this month. For October, the Dow Jones Industrial Average (DJIA) and S&P 500 are down 6.7% and 8.8%, respectively. The Nasdaq (NDX), meanwhile, has lost 10.9 percent. The Dow is now on pace for its biggest one-month decline since May 2010, and the S&P 500 is tracking for its biggest monthly loss since February 2009. The Nasdaq is set for its largest one-month pullback since October 2008. As Finom Group has mentioned time and time again, such numerous records during a bull market are an indication that indeed, this time is different. Good different or bad different can only be left for discovery and as time will do the telling.
As far as efficiency goes, the market wasn’t terribly efficient this past week. The SPX weekly expected move was $66 and we captured that $66 and then some. The SPX declined by nearly $104 on the week, dramatically overshooting the expected move. Remember, the VIX is now at 24% and with a VIX this high the daily and weekly moves are outsized.
The SPX weekly expected move for this week is $90. A VIX at nearly 25% indicates daily moves of roughly 1.3% up or down. After the SPX’s least volatile Q3 period since 1963, October has ushered in a wave of volatility. The heightened level of volatility will not and cannot last, but until it subsides, hedging can offset drawdowns to one degree or another.
So why has the market been selling off in October? If you listen to media headlines and even the analysts that participate on CNBC or Bloomberg, one would be led to believe it’s the prospects that tariffs and rising rates will take a chunk out of corporate earnings, gross profit margins and other metric performance indicators. To some degree they are right. With that agreeable comment in mind, can we not recognize the self-fulfilling prophecy they inject into markets? Finom Group recognizes that FOMC/central bank tightening reduces market liquidity and acts as a headwind for equity market appreciation, but the tariffs are a whole other story. At the current stage of tariff implementation, 25% on steel, 10% on aluminum and 10% on $250bn in Chinese imports, it’s simply not enough to derail the U.S. economy or SPX earnings on the whole.
UBS analysts said the trade concerns are mostly limited to certain industrials and semiconductor companies. For instance, chip makers Texas Instruments (TXN) and AMD (AMD) both issued disappointing fourth quarter outlooks. Texas Instruments said demand is weaker and it is not stocking up on inventory ahead of tariff implementation. Analysts at UBS say they are not factoring in much impact at all from tariffs. For next year, they expect earnings to grow by 8.6% and just 6.6% if current tariffs and those threatened are implemented.
“UBS chief U.S. equity strategist Keith Parker said the tariffs aren’t really showing up in Wall Street’s 2019 forecasts yet, but they have dented fourth-quarter growth by about a percentage point. Typically, in the month of October, analysts in aggregate chop an average 1.4 percentage points off the next year’s earnings growth forecasts. But this year, there is no change and the number is basically flat. The consensus for 2019 earnings growth is 10%, on average very low.”
It’s not just UBS that isn’t forecasting much of an impact from tariffs; corporations aren’t expressing much of any adjustments to their 2018 forecasts either. With regards to 2019, we’ll have to wait until February 2019 to see what corporations forecast in the way of EPS numbers. 2019 is where the uncertainty lay and if there is one thing markets do not have a stomach for it is uncertainty.
It’s no secret the Fed is removing liquidity from the financial system by raising rates and reducing its balance sheet, otherwise known as tightening fiscal policy. The Fed has forecasted one more rate hike in 2018 for the month of December. Interest rate sensitive sectors of the economy have come under pressure in 2018 and as rates have risen. Housing and autos are two such sectors that have been a wasteland for investors. The equity market has been pricing in such a concern for much of 2018.
Until recently, the biggest market pullback post a rate hike, occurred at the onset of 2016. The current market pullback should come as no surprise and is seemingly very orderly, as many investors have forecasted the probability of the pullback. With the 1st ever rate hike for the month of September, equities hitting all-time highs and volatility having its most complacent 3rd Quarter in decades, something had to “give”.
Will The Fed Pause
Moreover, it’s also no secret that Fed is coming under increasing pressure to “hit the pause button. “ Where there are significant market pullbacks, there is the expectation that the Fed will become more accommodative with its path for rate hikes. The market is essentially accepting the inevitability of a December .25 bps rate hike, but calling on the Fed to pause rate hikes in efforts to see how the economy performs thereafter and as we enter Q1 2019. With regards to the Fed hitting the pause button on rate hikes, here is what famed economist Ed Yardeni had to say on the subject matter recently.
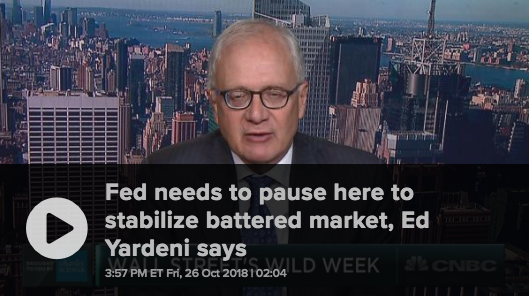
“We need the Fed to pause here and just take a breather,” the Yardeni Research President said Friday on CNBC’s “Trading Nation. “Let’s see how the economy plays out, and that will help the stock market a lot.
Fed officials have been talking like mission accomplished — that it’s the best economy that we’ve ever had,” he said. “If it’s the best economy that we ever had, why raise interest rates? Why not leave it be if it’s growing with low inflation?”
It’s widely understood that the Fed doesn’t favor the appearance of acquiescing to equity market demands, but the phrases “the Fed is behind the curve or the Fed will overshoot” exist for good reason. The Fed does indeed react to the equity markets, for better or for worse, like it or not.
Economic Data, GDP
In spite of the 4 rate hikes taking place in 2018, the economy, as a whole has not faltered. In fact, the economy has accelerated since the 1st Quarter of 2018 with Q2 GDP coming in at 4.2% and the first read on Q3 GDP coming in better than expected at 3.5%, as reported by the Commerce Department.
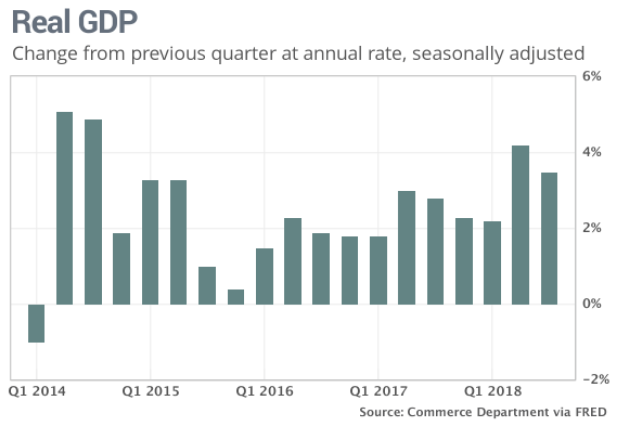
Expansion in the last two quarters is the fastest six months of growth in four years. The economy looks like it will expand above a 3% rate in 2018. That hasn’t happened since 2005. At the same time, inflation cooled in the third quarter. Nonetheless, investors remain concerned about the Fed’s rate hike path and it’s ability to curtail economic growth.
Now let’s get back to the GDP data released last week. As noted previously, GDP came in at 3.5% for the Q3 2018 period, a deceleration that is typical from Q2 periods.
“The headline was not too far from expectations, but we did get a few surprises. Consumer was stronger than we expected,” said Scott Brown, chief economist at Raymond James. “The consumer accounts for 68 percent of overall GDP, and the consumer really drives the bus.”
The increase in consumer spending was offset by a slowdown in business and residential investment. The rather sizable drop in business investment is to be expected given the outsized increase in business investment during the Q2 2018 period. It’s a simple mean reversion. Household investment has fallen for three straight quarters.
Despite all the headlines surrounding a slowing consumer and overall slowing economy, the data and corporate earnings aren’t validating such headlines that have persisted throughout October. Personal Consumption and Expenditures data released this past Friday further validates the strength of the consumer and economy, despite rising rates. We get it, the consumer is forming households and buying homes at a slower rate than it has been post the Great Financial Crisis, but everything else is up for grabs according to consumer spending data and retail sales.
The Commerce Department said consumer spending rose 4% in the 3rd Quarter, even stronger than the prior three months 3% clip. What’s more, we could see an early Q4 spike in consumer spending and retail sales due to the replacement goods needed due to the past hurricanes. Finally, here is how Ed Yardeni colors his outlook on the consumer and the future of holiday retail sales:
“I think it’s going to be the best retail season we’ve ever had. Consumers are really in very good shape,” Yardeni said. “That should help to turn the market around.”
General Commentary For the Coming Week
An ugly October could give rise to a future rally that coincides with better than forecasted earnings growth. A great deal of importance will be placed on Thursday’s release of Apple’s (AAPL) Q4 2018 earnings results.
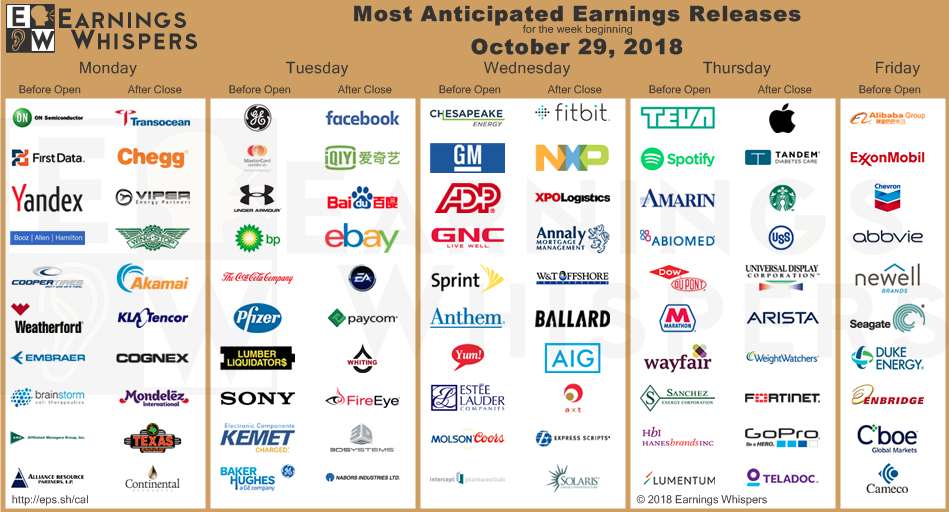
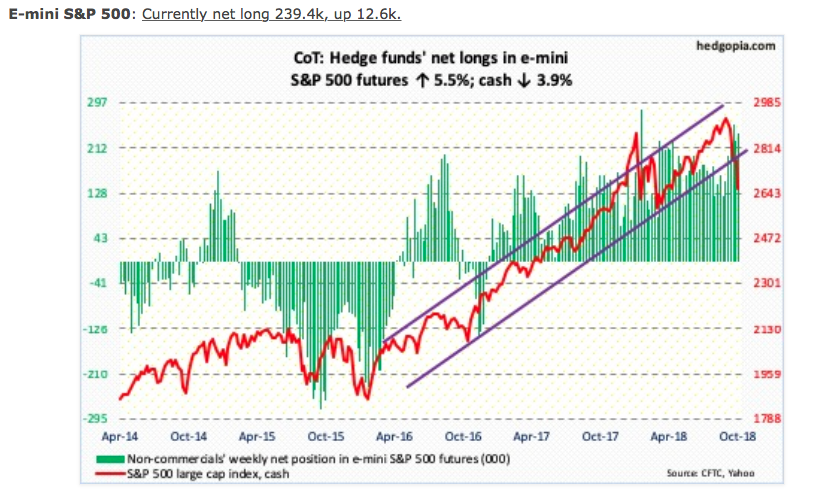
Apple’s report will be highly anticipated and scrutinized ahead of it’s release, but it may only serve to distract institutional investors momentarily as the broader earnings picture for the S&P 500 remains robust, possibly growing beyond 23% when all is said and done for Q3 2018. When we review COT’s hedge fund net long e-mini futures positions, they actually increased last week.
Additionally, perhaps encouraging for bulls, flows improved last week. In the week to Wednesday, US-based equity funds (including ETF’s) gained $4.2 billion (courtesy of Lipper.com). In the same week, SPY (SPDR S&P 500 ETF) took in $3.3 billion, IVV (iShares core S&P 500 ETF) $497 million and VOO (Vanguard S&P 500 ETF) $257 million (courtesy of ETF.com). These are bullish fund flows, which when combined with the resumption of stock buyback programs expected in the coming weeks, may provide markets with a lift.
Given the rise in forecasted earnings growth for the Q3 period that coincides with a market pullback, equity prices have become increasingly cheap. Such conditions rarely last as value investors flood the market, scooping up… value.
The path of least resistance is for volatility to subside, duration and magnitude notwithstanding. Non-commercials have been actively cutting back their net shorts exposure in recent weeks. Throughout the year, Finom Group has maintained a median VIX forecast of 15.50 +/- .50 percent. Additionally, back on July 10th we had forecasted the VIX to break below 11% and rise above 22% in the fall. Both bookends of the forecast have been met.
Earnings Outlook for S&P 500
Over the last 2 weeks, both FactSet and Thomson Reuters have revised the Q3 S&P 500 earnings forecasts higher. While much concern continues to be expressed in the media about peak earnings cycles and margin impact from tariffs, corporations have benefitted from the strength of the consumer and a robust labor market.
In the previous week, FactSet upwardly revised their Q3 S&P 500 earnings forecast to just under 20% YOY growth. That number took a large leap higher this past week. For Q3 2018, the blended earnings growth rate for the S&P 500 is now forecasted to be 22.5 percent. If 22.5% is the actual growth rate for the quarter, it will mark the third highest earnings growth since Q3 2010. The forward 12-month P/E ratio for the S&P 500 is 15.5. This P/E ratio is below the 5-year average (16.4) but above the 10-year average (14.5).
To date, almost half (48%) of the companies in the S&P 500 have reported earnings for the 3rd Quarter. Of these companies, 77% have reported actual EPS above the mean EPS estimate, which is above the 5-year average of 71%. In aggregate, earnings have exceeded expectations by 6.5%, which is above the 5-year average of 4.6 percent. During the upcoming week, 139 S&P 500 companies (including 6 Dow 30 components) are scheduled to report results for the third quarter.
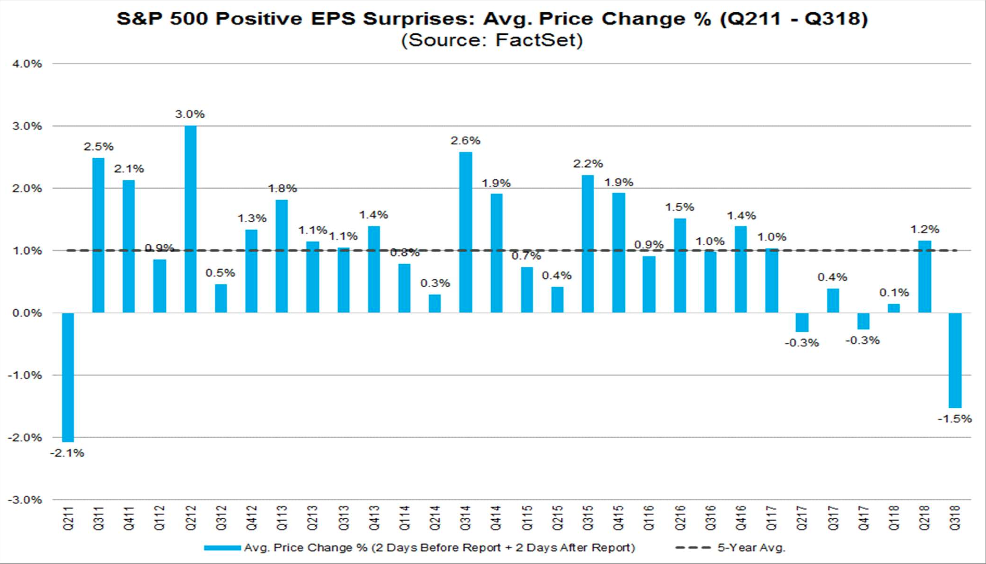
Why is the market punishing companies that have reported positive earnings surprises? It is likely NOT due to EPS guidance or analyst revisions to EPS estimates for the fourth quarter. To date, 63% (26 of 41) of the companies that have issued EPS guidance for Q4 have issued negative guidance. This percentage is below the 5-year average of 70%. In aggregate, analysts have made smaller cuts than average to fourth quarter EPS estimates during the month of October. The following chart from FactSet depicts the poor response to positive earnings.
There is uniqueness to the current macro-economic and market environment that can be no better characterized with the following 2 adjectives, uncertain and cheap! We know that markets tend to overshoot, to the upside, as we witnessed in January and to the downside in February and probably at present.
We believe the consumer remains strong and this could be one of the strongest holiday shopping years for retailers and brand providers. From a 3rd party perspective and outlook on the markets here is some recent commentary from Scott Minerd of Guggenheim Partners.
“Stocks are cheap based on forward multiples and should rally by 15%-20% from here unless policy uncertainty around China and tariffs remains in place.
I think we’re going through a classic seasonal adjustment,” Minerd told CNBC during a Friday interview after his Twitter missive. He said he now thinks the seasonal trend, with October representing one of the more volatile periods for stocks, has turned positive, paving the way for a powerful uptrend to begin.”
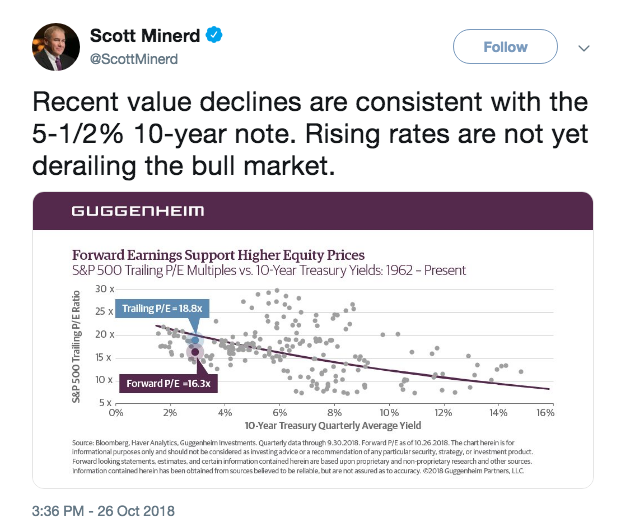
The Guggenheim CIO said climbing rates, as the Federal Reserve normalizes monetary policy, “are not yet derailing the bull market” that has run for about a decade. Minerd estimated that the selloff investors have suffered reflects a 10-year Treasury note yielding 5.5%, not the one that currently sits at 3.08%, around the lowest level for that debt since Oct. 2.


