

Research Report Excerpt #1
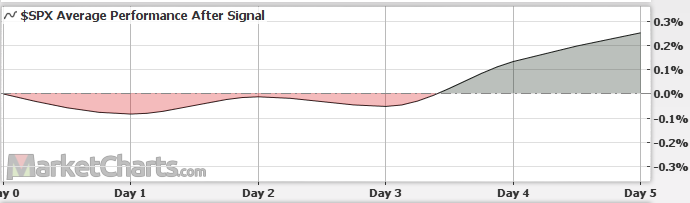
Putting some more context to this past Friday’s price action, with a minor loss in the S&P 500, this was the more probable and even predicted price action based on the overbought and/or overheated conditions Seth had been analyzing during the course of the trading week. On Thursday, the S&P 500 achieved a new all-time high (56 new all-time highs YTD), and finished above its upper Bollinger Band. As discussed in the weekly SOTM video, here is what Seth outlined via a MarketCharts quantitative study:
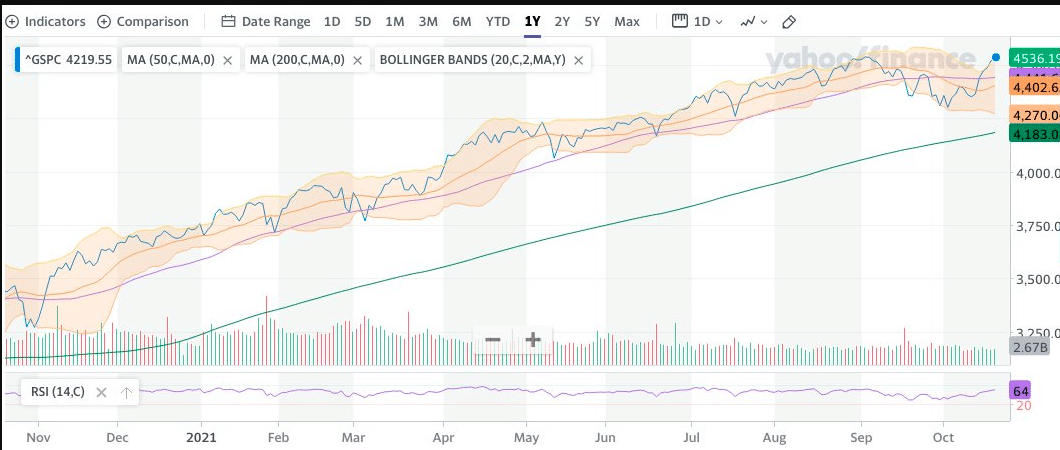
- Up 6 days in a row for the 3rd time in 2021
- 5 days later, market higher each time
- Finished above upper Bollinger band Wednesday
- Usually weaker initially and before resuming uptrend
- S&P 500 finishes above its upper Bollinger Band = 44 times since 2017.
- Average return was .25% 5 days later
- Percent positive rate 5 days later = 63%.
Research Report Excerpt #2
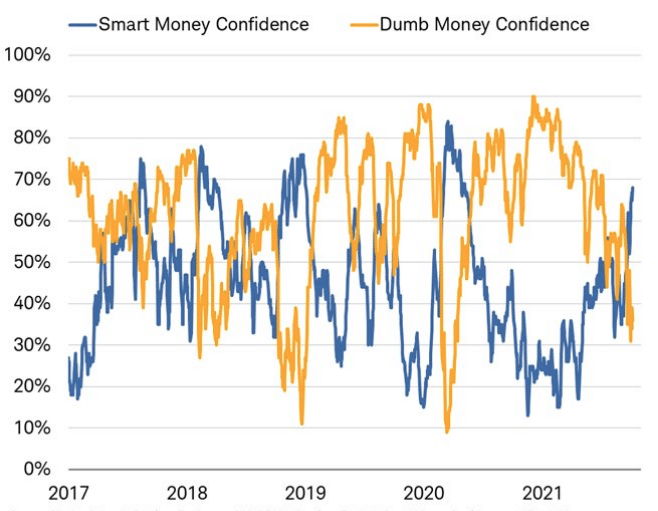
Dumb Money” (smaller speculators, yellow line falling) Confidence has fallen sharply lately, with “Smart Money” (larger commercial hedgers/hedge funds, blue line rising) Confidence on the rise. The current trend or spread is a reversal from earlier this year.
Research Report Excerpt #3
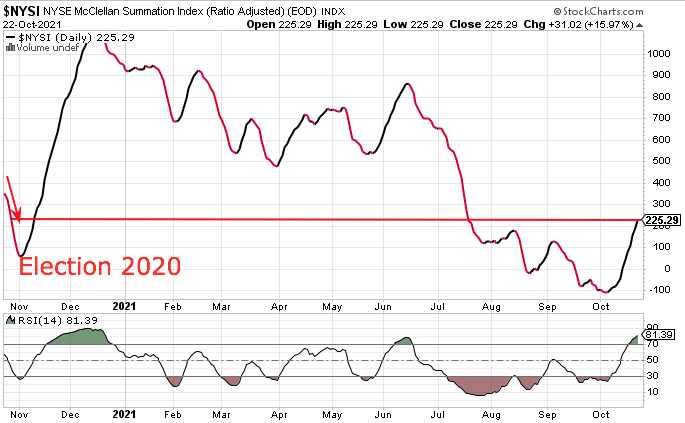
The current upswing in the NYSI has now eclipsed the former August and September swing highs, on stronger relative strength (14-day RSI). Interestingly, this is a very different configuration of the NYSI heading into November 2021 when compared to November 2020. This was likely a bi-product of the pending election in 2020, which was feared to produce a contested election. Elections are highly relevant to investors. The presidential cycle is also, which will be discussed later.
Research Report Excerpt #4
I kid you not. Don’t do it; don’t bet against Seth, just don’t do it!! I can’t tell you how many times I’ve seen market “pros”, other analysts and strategist offer a market or stock call contrarian to Seth’s analysis and the Golden Capital Portfolio positions. Bed Bath & Beyond (BBBY) was a perfect example, given CNBC’s Jim Cramer was bullish on the name while we were very bearish. BBBY shares took everyone for a ride over the last 18 months or so, but pretty much ended back where it began.
While the reputable analysts and strategists in the tweet above have been pounding the table for a market correction of 10-20% over the last 3 months or so, Seth has been stating and restating that market internals and the macro-fundamental earnings picture has not warranted an index decline of such magnitude. He suggested investors would better position themselves buying dips over hedging or shorting the indexes.
Research Report Excerpt #5
If a winning strategy was all you needed to be a successful investor or trader, then everyone would make money. Why doesn’t that work? It doesn’t work because strategies don’t make money, traders do! There’s a fine line between successful & unsuccessful traders and one key difference is instincts. Finom Group’s trading hit rate on over 280 trades issued year-to-date is 98 percent. How do we achieve this success rate; adhering to a time-tested process… and yea, instincts from years of experience. Continue to work on your process, always!
Research Report Excerpt #6
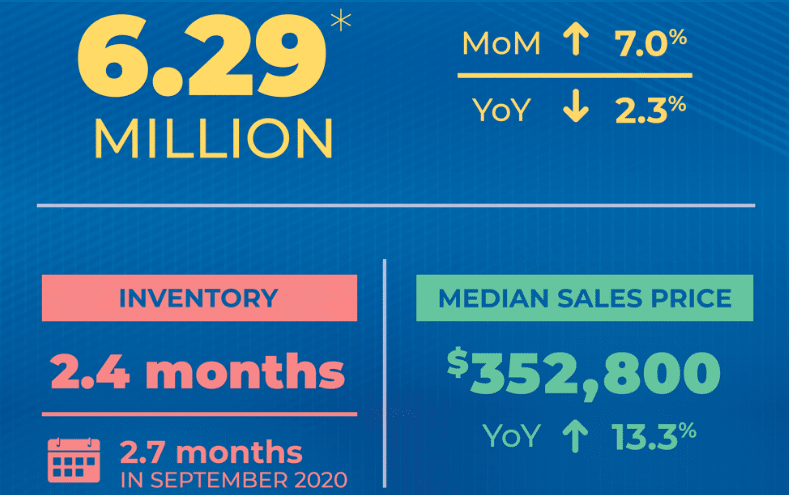
Existing home sales beat estimates with a 7% September gain to a 6.29 million pace that marked an 8-month high, after an unrevised 5.8 million August clip. Analysts saw a -0.8% inventory drop-back to 1.27 million as analysts further unwind the 9-month high of 1.31 million in July, while the months’ supply fell to 2.4 from 2.6. Analysts saw a 1.4% drop in the median price that left a seasonal 3-month pull-back from four months of all-time highs through June. The supply of homes for sale remains remarkably tight, though inventories have risen from record-lows in 2020, while prices remain remarkably elevated.
Research Report Excerpt #7
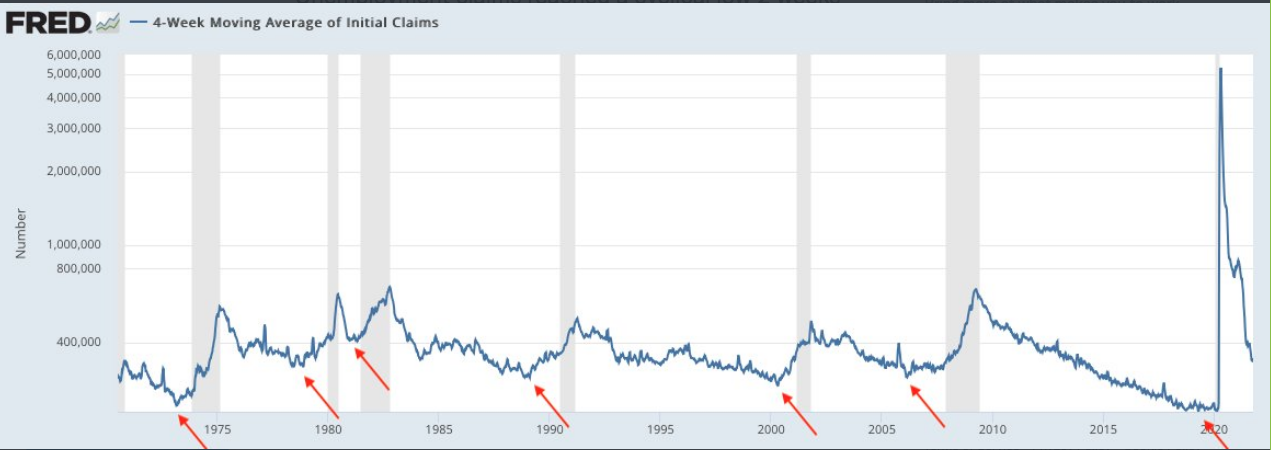
Unemployment claims reached a new cyclical low this past week, with respect to the 4-week average. Historically, claims have started to rise at least 7 months ahead of the next recession. With the Delta variant in full retreat, booster vaccinations receiving CDC and FDA approval in recent weeks, I think it’s a good bet that the cyclical lows will continue into 2022, even if with some bumps along the way.
Research Report Excerpt #8
In the Finom Group weekly State of the Market, Seth highlighted the seasonal tailwinds just ahead for the market, and how the S&P 500 tends to trade well the final week of October and through year-end. So I’m going to add some points of interest to ensure we are all keeping an open mind. And why? Well there are only 2 calendar years where a Fed tapering cycle began, 2014 and potentially 2021. Nothing terrible happened in 2014 when tapering began and continued, so that is our baseline understanding, but recognizing the sample size of 1.
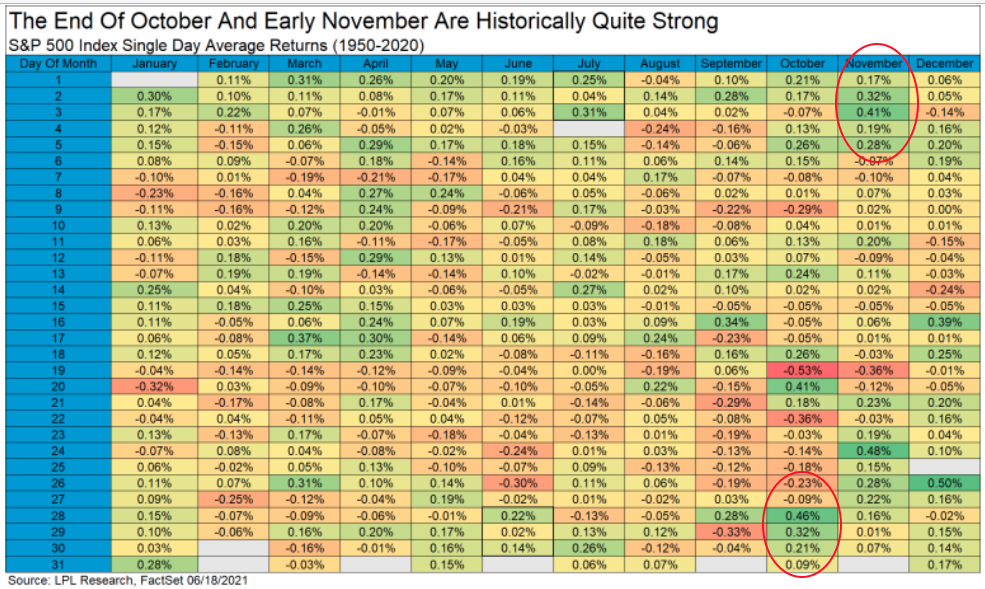
The only concern with this heat map of the S&P 500 monthly, daily performance dating back to 1950 is that if we dig a little bit deeper, we come to discover there is one notable variable. Next week includes the last 5 trading days of October during the 1st year of the Presidential Cycle. The tables below show the daily change, on a percentage basis, for that period.
Research Report Excerpt #9
- The final 5-trading days of October are what we are up against with still yet overheated and/or overbought conditions prevailing.
- Some 87% of S&P 500 stocks are trading above their 10-day moving average. (chart below)
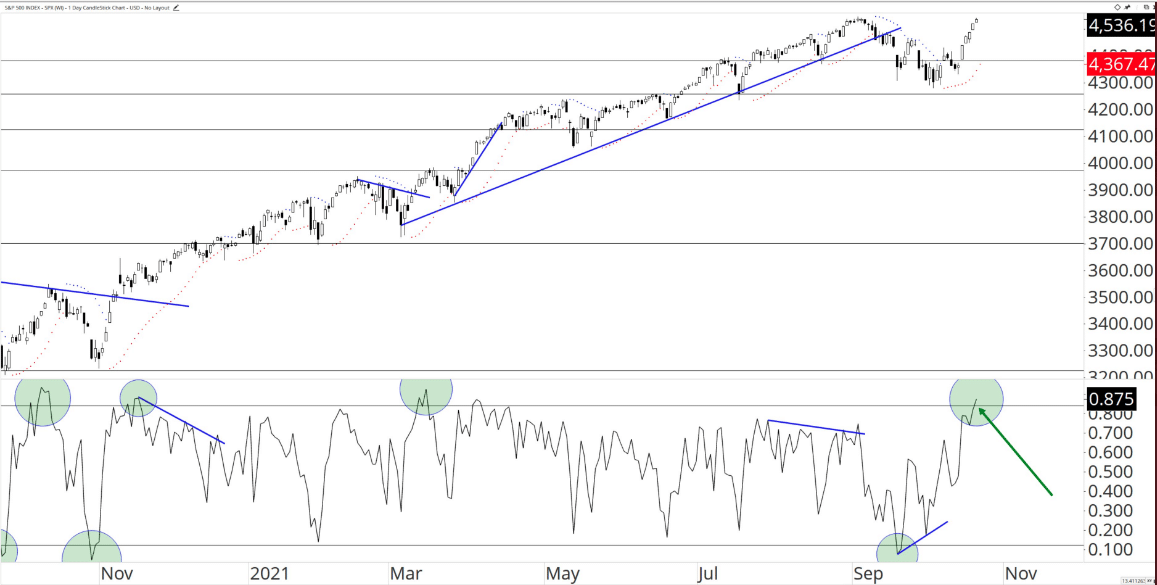
- The good news is that after a period of breadth chop, this is a sign of initiation, just like it was in March and November, which led to higher-highs in the not too distant future.


