

Research Report Excerpt #1
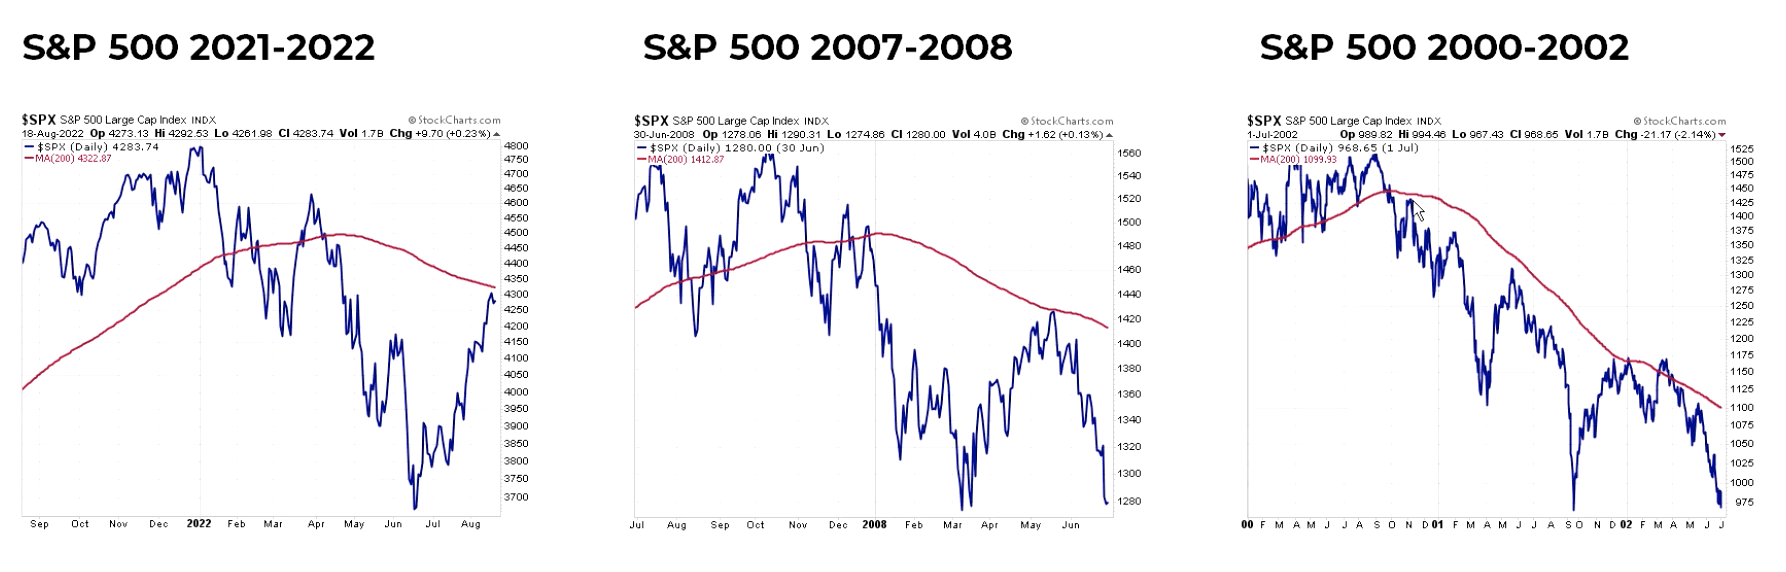
Our first chart comes to us from Chris Ci0vacco. As we had discussed in the past, there will be many, many market participants and pundits that will lay claim to the recent rally as proving nothing more than a bear market rally. Heck, a prominent Wall Street strategist recently offered that very context this past week.
BofA’s Michael Hartnett:
“Average market gain in 43 bear market rallies since 1929 = 17.2%, average duration = 39 trading days; this one 17.4% in 41 days; textbook bear rips always “narrow”, of 17.4% gain in the S&P 500 just 4 stocks (AAPL, MSFT, AMZN, TSLA) contributed 30% of gain.”
Research Report Excerpt #2
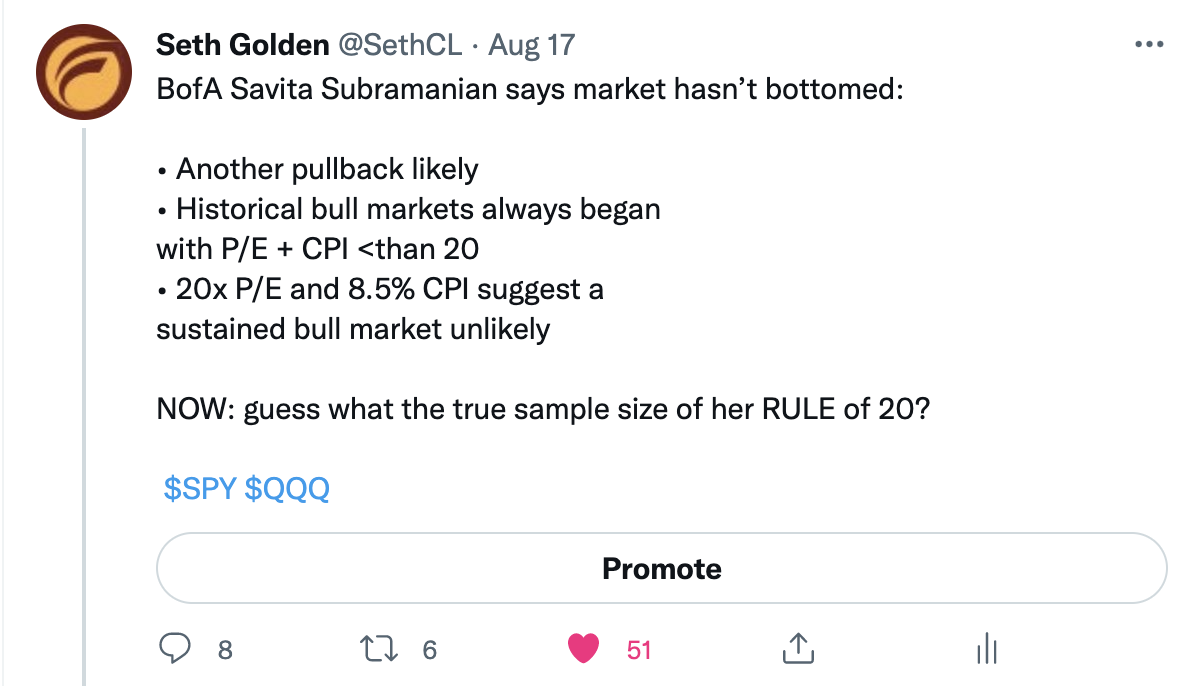
At the bottom of the tweet I asked investors to guess what the sample size for this data point offered by BofA’s Subramanian. The answer is 4. Moreover, this particular data point that points bearishly at the market’s P/E and macro-fundamentals hasn’t occurred in since 1962. Piper Sandler’s Chief Investment Strategist Michael Kantro (noted bear with 3,400 price target for the S&P 500) characterized the Rule of 20 as follows: “Rule of 20 is garbage in/out. Hasn’t “worked” in decades and based off a small sample size many decades ago.”
Research Report Excerpt #3
Do we foresee the consolidation continuing into the coming week? Yes. Do we still believe the market has transitioned from a sell-the-rip to buy-the-dip environment? Yes. In fact, selling the rip this year has mathematically been the wrong way to particpate as we will outline at the end of our report.
Research Report Excerpt #4

In the 2020 S&P 500 chart above, we can see that the 50% Fibonacci retracement level came in at 2,808 and was breached in April of 2020. After that point there was a dip back below the level, an ample amount of sideways action over the next month around the 50% level, and ultimately a breakout above that level in June of 2020. What we surmise from the past is that such strong bullish momentum and technical achievements build-up overbought and overheated conditions that provide healthy consolidation, which occurred in 2020 and may very well be taking place as of this past week. Don’t be “scured”, but rather rejoice in the potential opportunity to once again buy-the-dip.
Research Report Excerpt #5
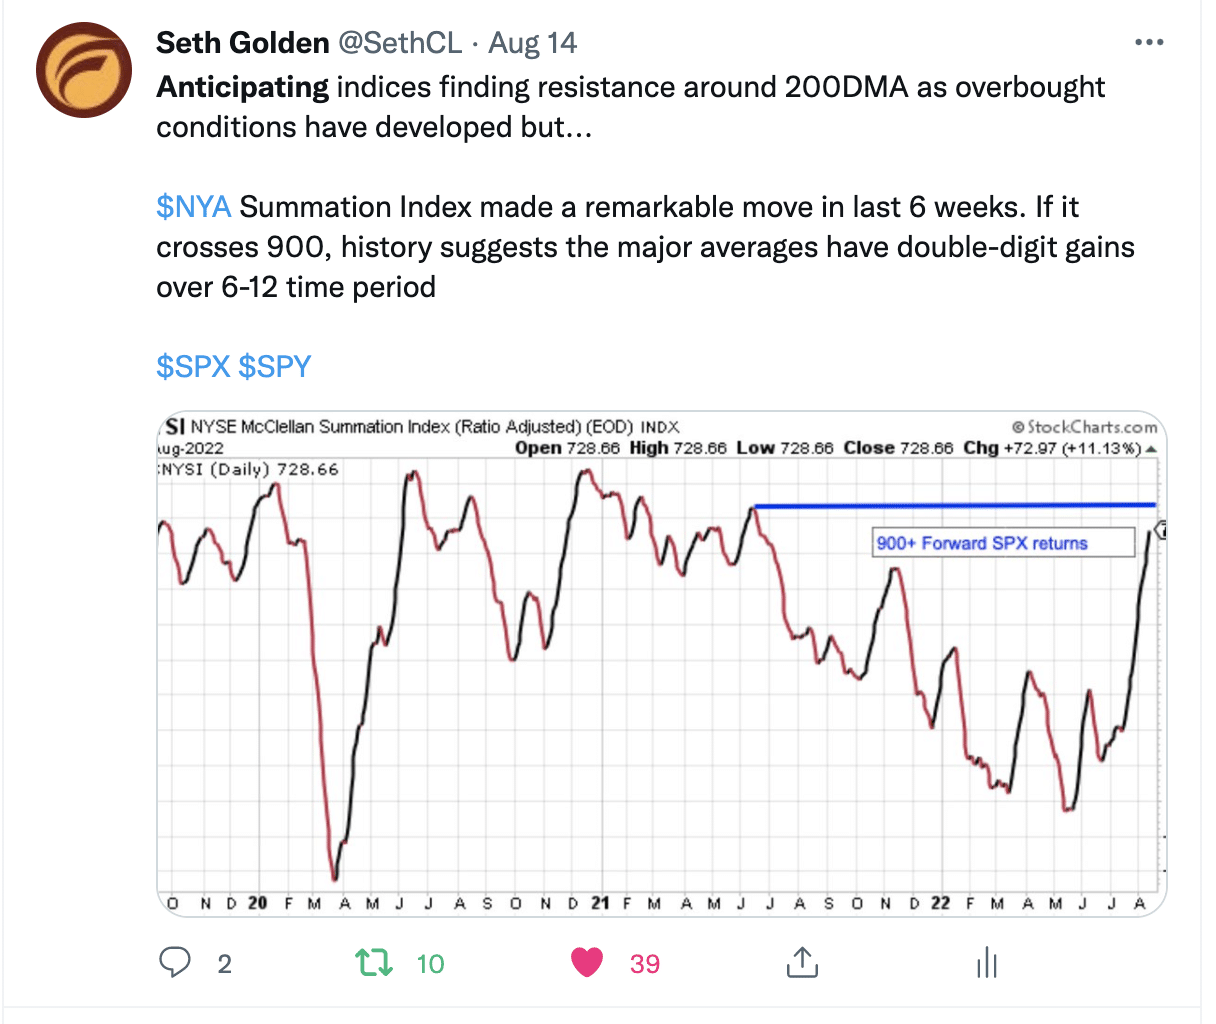
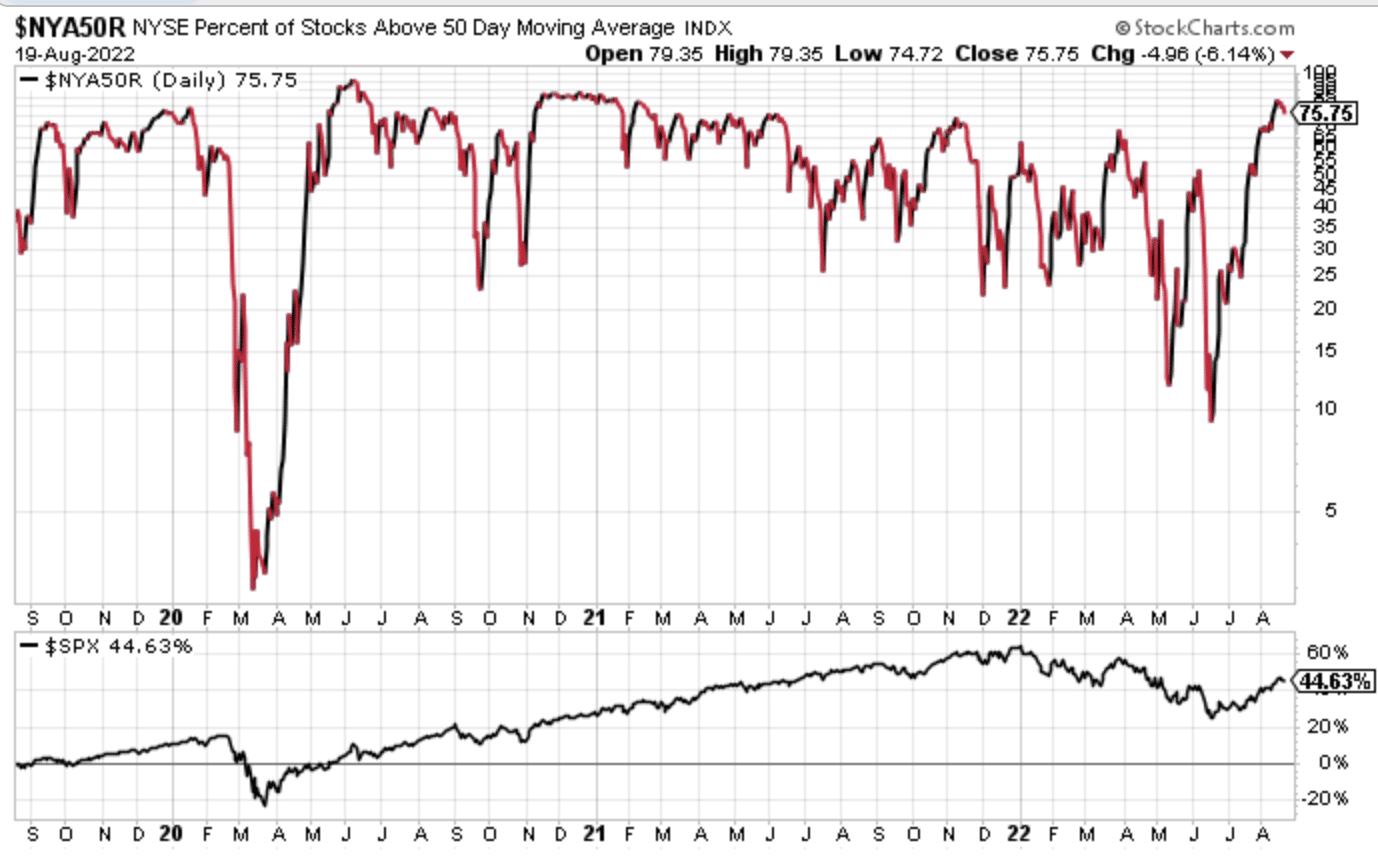
Here is another market internal that has historically coincided with the beginnings of a new bull market, regarding the NYSE. The percent of stocks trading above their 50-DMA within the NYSE just hit a key threshold for the first time in 2022, at 75 percent. Such a level has been indicative of a new cyclical bull market.
Research Report Excerpt #6
On behalf of Finom Group I have been emphasizing this THEME of the economic/business cycle as being unprecedented and found for a very unique set of circumstances. As such, using past models and sequencing of economic data may not prove as fruitful and/or predictive of future outcomes as these traditional economic models have in the past. I’ve mentioned in the Trading Room and in weekly State of the Markets that the health of the household balance sheet and unprecedented, accrued savings is like an ATOM BOMB 
 to traditional economic models. For those whom are using such models, they have largely been disappointed in the fact that while the economy has expressed 2 quarters of contracting GDP, a true recession has not been found, as determined by the National Bureau of Economic Research (NBER).
We’ve been able to discover, through our ongoing research and tracking, before the pandemic the average household had $400 in savings. After the pandemic and to-date the average household (data from Bank of America) now has roughly $1,700 in savings. At $2.5trn in total accrued household savings this is ~3X the most accrued savings level since the 1980s.
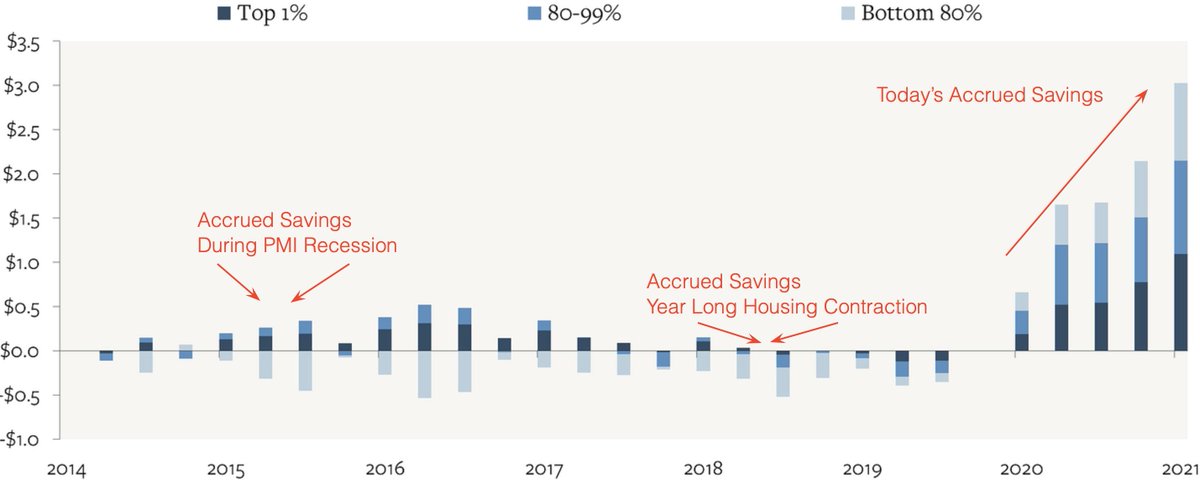
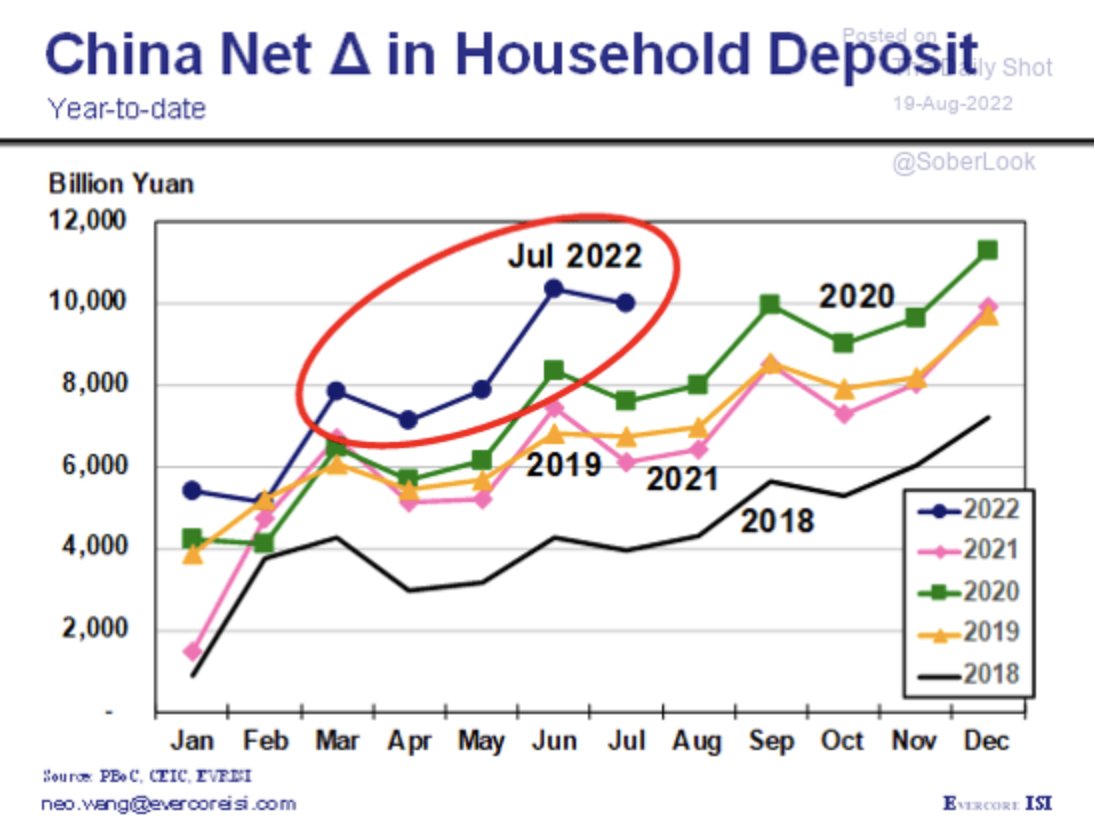
What we are depicting in the chart above is the accrued savings/household since 2014, juxtaposed with some of the recent economic industry slowdowns. Whether it was the Housing and/or PMI recession of the previous years, we have NEVER had consumer savings buffers like today. NO PRECEDENCE!! As an aside, China’s bogged-down economy by the many restrictive policies put forth from the CCP have also stalled the demand/consumption side of their economy. But like the U.S., the average Chinese household has ample savings just waiting to be unleashed into the economy:
Research Report Excerpt #7
While we would typically see the consistent contraction in LEI as a net negative and a precursor to a forthcoming recession, we can’t necessarily view it the same way as we have in the past. The average peak in LEI to recession conditions, historically, is roughly 7 months. Does the economy produce the average? Clearly not, as depicted in the chart of LEI recession signals below:
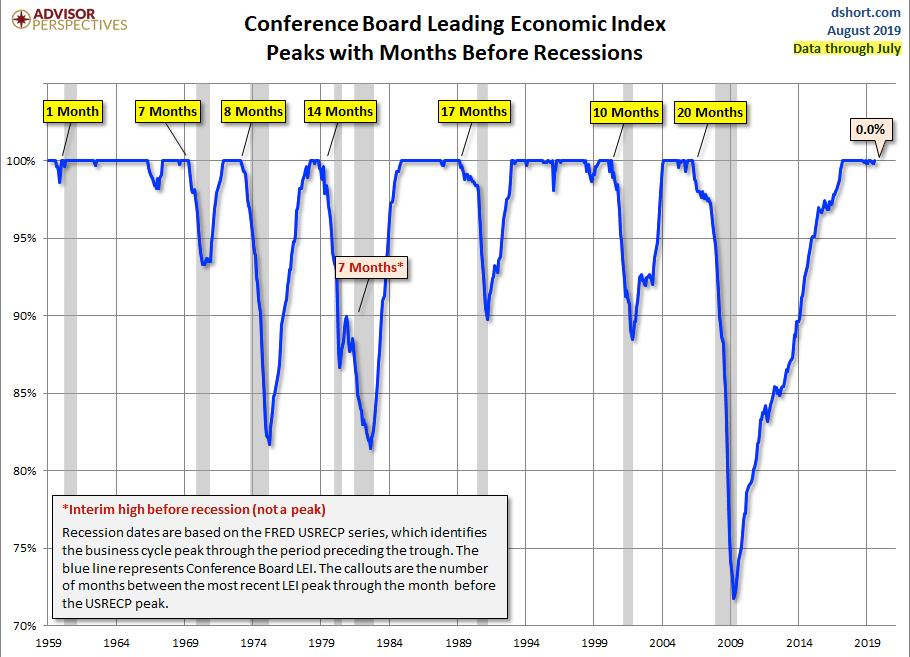
There has been a recession from the peak in LEI as quickly as 1 month later and as distant as 20 months later. So while we pay attention to leading indicators such as this, we are served better by simply tracking the data for weakness and or resurgence going forward.
Research Report Excerpt #8
As shown in the CFTC Committment of Traders futures positioning below, Institutional investors continue to add to their long equity market exposure while the Leveraged Funds (Hedge Funds) continue to add to their short equity market exposure. In the week ending August 16, 2022, those Leveraged Funds which are often referred to as Non-commercials or “dumb money”, increased their short S&P 500 Futures positions by more than 10 percent.

Their “bet” is clear, as they are positioning for further downside near-term. The smart money plays the long game in the markets, always has and likely always will.
Research Report Excerpt #9
The media sees price action tilting and trending in a certain direction and thusly builds a narrative to justify the trend. When the market is rising, the narrative is more positive or bullish and when the market is falling the narrative becomes increasingly negative or bearish. Ben Carlson of Ritzholts Management offered the following, in a narrative of his own: “The prevailing narratives 2-3 months ago in the stock market were as follows:
- The stock market is pricing in an imminent recession or we’re already in one.
- The Fed has lost control of inflation.
- Without the Fed put there’s nothing stopping the stock market from falling 40-50%.
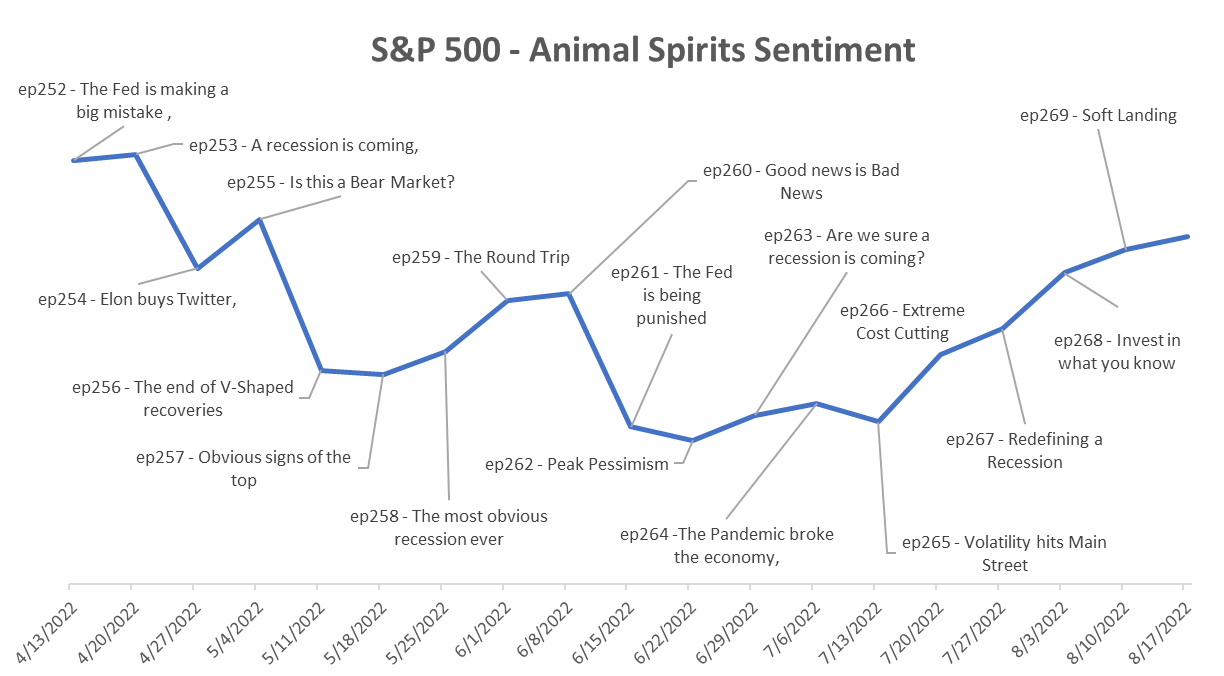
Now that the market has rallied 15%, here are some new narratives gaining steam:
- It’s possible the Fed could orchestrate a soft landing.
- A recession is no longer guaranteed.
- Inflation is improving.
- Well even if we do go into a mild recession, the Fed will probably step in and lower rates.


