
Welcome to another trading week!! In appreciation of all of our Basic Membership level participants and daily readers of finomgroup.com content, we offer the following excerpts from our Weekly Research Report. Our weekly Report is extremely detailed and has proven to help guide investors and traders during all types of market conditions with thoughtful insights and analysis, graphs, studies, and historical data/analogues. We encourage our readers to upgrade to our Contributor Membership level ($7.99 monthly, cancel any time) to receive our Weekly Research Report and State of the Market Videos and take advantage of this ongoing promotional event today! Have a great trading week, be in touch, and take a look at some of the materials in this weekend’s published Research Report!
Research Report Excerpts #1
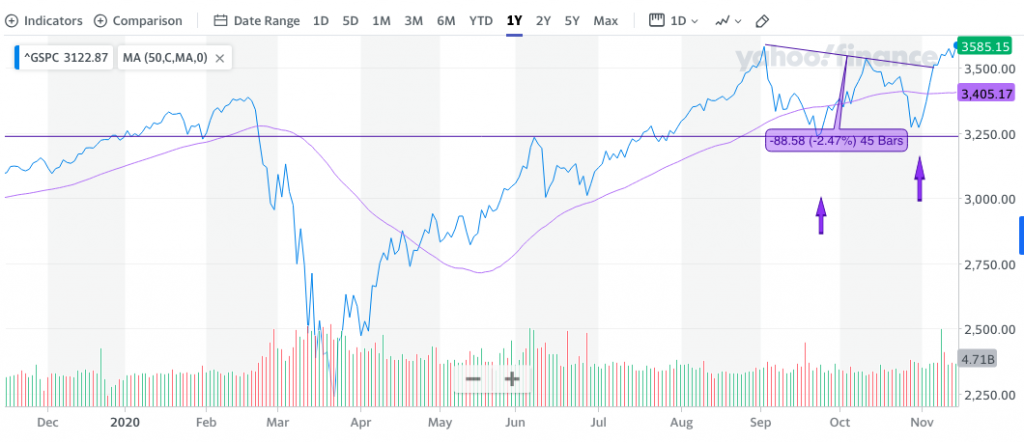
- The S&P 500 chart above identifies a bullish picture for investors.
- The benchmark index achieved its highest level intra-week and highest daily close at 3,585.
- The large-cap index is now roughly 6% above its 50-DMA and holding above its 10 and 20-DMAs as well, on strong breadth readings.
- Some 83% of SPX stocks are trading above their 200-DMA, highest of the post-pandemic period.
- Breadth readings are similar for the % of stocks trading above their 50 and 20-DMA at the end of the week.
Many investors avoid technical analysis; they think it is a difficult discipline. In reality, it’s not terribly difficult and becomes easier with time, just like anything else. Having said that, here is a very, very simple and true recognition of ALL THE TECHNICAL ANALYSIS YOU’LL EVER NEED TO KNOW AND LIKELY USE!***
Uptrend = higher highs, higher lows above rising moving averages. Downtrend = Lower highs, lower lows, below declining moving averages. Determine your time frame & identify the trend.
Research Report Excerpts #2
As simplistic as it sounds, investors have been buying the dips the whole market recovery period. I emphasize this point to further emphasize the point that they have not been shorting the market to any significant degree (other than the Nasdaq) since the March lows.
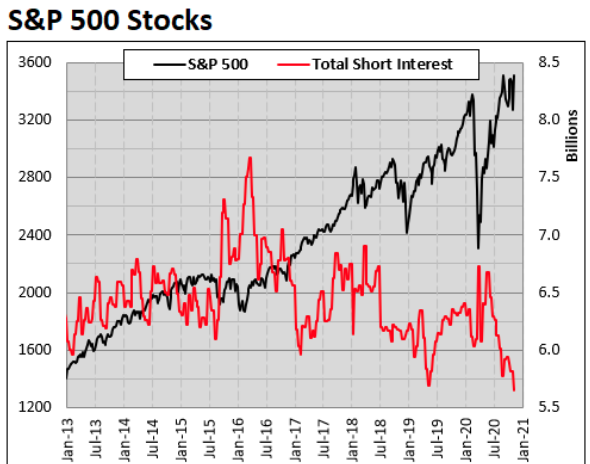
The short interest chart above for the S&P 500 identifies that this is the lowest amount of short interest in for stocks over the past year and past 5-year period with both at 0% on a %Rank basis. Additionally, the aggregated data shows short-interest is down 10.33% YOY and down 11.73% year-to-date.
Research Report Excerpts #3
European equity markets have performed very well after the economic restrictions were imposed, contrarian to what many investors may have assumed. Perhaps that is because the current restrictions are mainly targeted at services, travel, restaurants, entertainment, rather than manufacturing. Because it makes up only 17% of the global economy, manufacturing is not enough to fully offset the weakness in GDP. There is a greater impact for stocks, as manufacturing businesses make up about 50% of global market capitalization.

Unfortunately, in the U.S. the service sector is the larger sector of the economy, but with global trade having rebounded investors shouldn’t anticipate a March-like market reaction to pending economic restrictions.
Research Report Excerpts #4
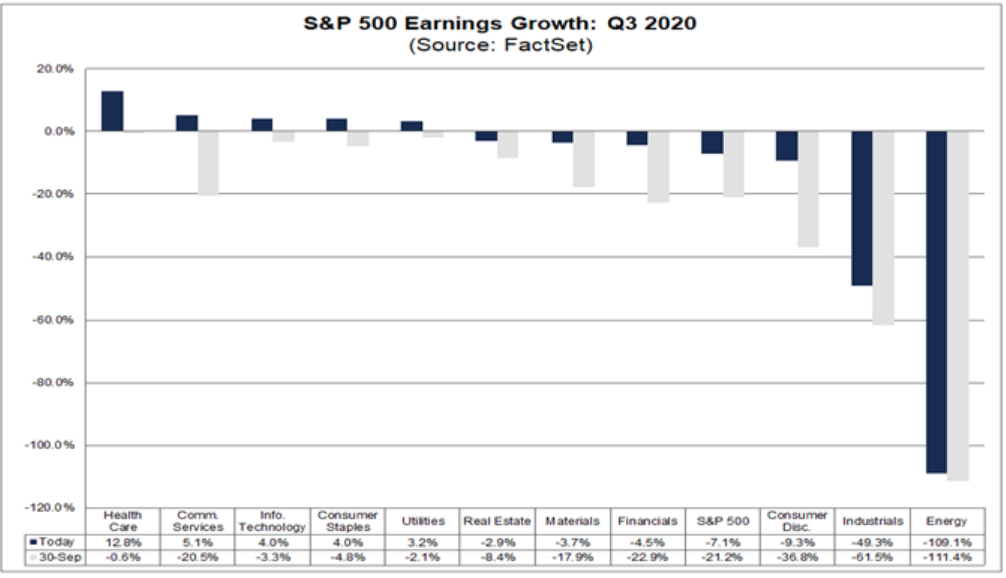
FactSet, with just one full week to go in the Q3 earnings season has updated its earnings tracking model to recognize that the S&P 500 is reporting a YoY decline in earnings of -7.1%, a lesser decline than the previous week at 7.5 percent.
- In terms of revenues, 79% of S&P 500 companies have reported actual revenues above estimates, which is above the 5-year average of 61%. If 79% is the final percentage for the quarter, it will mark the highest percentage of S&P 500 companies reporting a positive revenue surprise since FactSet began tracking this metric in 2008. The current record is 78%, which occurred in Q4 2017.
- In aggregate, companies are reporting revenues that are 2.6% above the estimates, which is also above the 5-year average of 0.7%. If 2.6% is the final percentage for the quarter, it will mark the largest revenue surprise percentage reported by the index since FactSet began tracking this metric in 2008. The current record is 2.2%, which occurred in Q4 2012.
Insight/2020/11.2020/11.06.2020_EI/S%26P%20500%20Revenues%20Above%20In%20Line%20Below%20Estimates%20Q3%202020.png?width=920&name=S%26P%20500%20Revenues%20Above%20In%20Line%20Below%20Estimates%20Q3%202020.png)
Research Report Excerpts #5
Bank of America’s Michael Hartnett sees a confluence of vaccine, reopening and rising rates ultimately leading to a 2018 type of market environment. Here’s how he outlines his take on 2021:
“…we are sellers-into-strength into vaccine in coming months…peak positioning, peak policy, peak profits likely coming months; best analog is 2018 when US tax cuts caused peak positioning, policy, profits early that year; 2021 (vaccine) sees early peak in asset prices on higher interest rates; watch XHB, RPAR, HYG, DXY for signs rate rise becoming disruptive.”
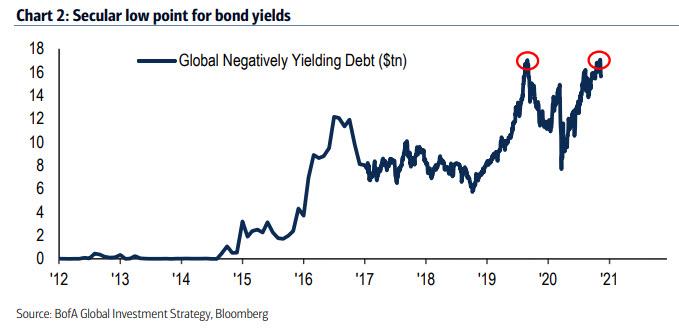
To bolster his bearish position, Hartnett points out two more things. First, total global negative-yielding debt is back at its $17 trillion record, which is a double-top (with Aug’19), and which suggests that 2020 is a secular low point for bond yields.
… and that according to the BofA GLobal Beadth Rule: A “sell” signal has been triggered with 91% of MSCI equity country indices above 50dma & 200-dma. To Hartnett this is an early warning signal to equity investors that the topping process has begun. Hartnett cites a successful backtest with similar conditions in ‘07, ‘10, ‘18 and early-2020.
Research Report Excerpts #6
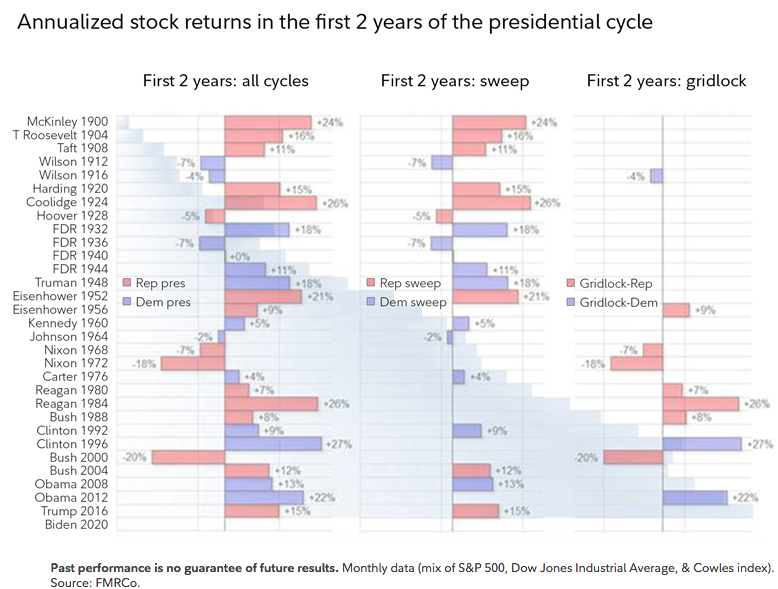
The chart below shows the stock market’s annualized return during the first 2 years of the presidential cycle. On the left are all cycles, in the middle are the sweeps (red or blue), and on the right are periods of divided government. For the Democrats, divided governments have been few and far between, but the last 2 produced outstanding results for the market.
Research Report Excerpts #7
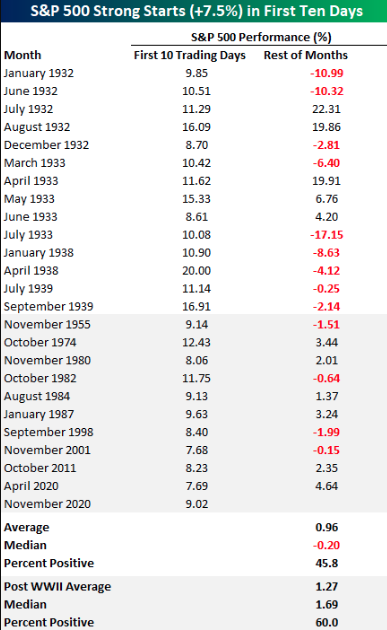
The table below, from Bespoke Investment Group, shows each month since 1928 where the S&P 500 was up at least 7.5% in the first 10 trading days of a month. Overall, the S&P 500’s average rest of month performance has been a gain of 0.96%. That sounds good, but on a median basis, the rest of the month typically sees a decline of 0.2% with positive returns less than half of the time.
In looking at the chart above and the table below, you’ll notice that most of the strong starts for the S&P 500 came during the Depression in the pre-WWII period. In 1932 and 1933, for example, there were 5 occurrences each year! Looking at the post-WWII period where the frequency of occurrences wasn’t nearly as common, strong starts to a month typically saw a more positive, but still not a very consistent trend. In the 10 prior months since the end of WWII, the S&P 500’s average rest of month performance was a gain of 1.27% (median: 1.69%) with gains 60% of the time.
Research Report Excerpts #8
Such a drop in MACD for the Value Line Arithmetic Index has only happened 4 other times in history, as discovered by Chris Ciovacco. In discovering what market returns were after the signal in question, here is what Chris Ciovacco found. Spoiler alert… good things happen!
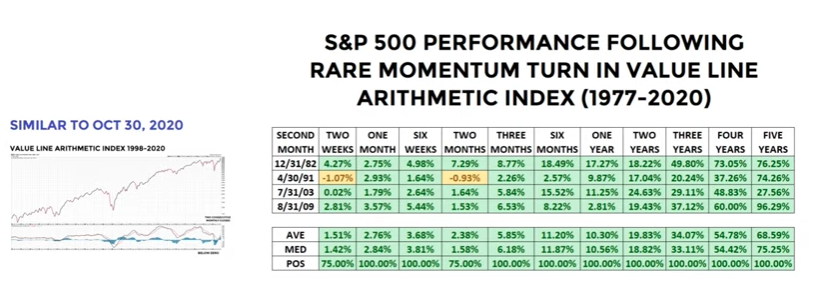
For those who have been trading/investing for a long time and recognize the years in the table, you are likely aware of the sea of green over the next several years and after the MACD signal.
Research Report Excerpts #9
As the fiscal relief package from Cares Act wears thin and certain programs end with the calendar year ending, the Goldman Sachs Consumer Disposable Income Forecast in 4Q20 offers some consumer insights:

What the chart shows is that the transfer payments ($1,200 per tax payer) from Cares Act is all but gone in Q4 2020, as a portion of disposable incomes. Furthermore, the extra unemployment insurance as well as proprietor and rental income from the PPP programs and benefits have also largely been curtailed across the country, reducing disposable income. To this point, more and more households will be forced to tap into their personal savings in order to get through the holiday period as a means to bridge the divide to the next relief package.
News about the early efficacy rate of the BioNTech/Pfizer vaccine is unambiguously positive for the economic outlook. Admittedly, a vaccine will not arrive in time to spare a probable contraction in GDP in many European countries or weakening GDP in the U.S. for the current quarter. However, it gives us more certainty that economic activity will rebound strongly in 2021. One important tailwind through next year will be the substantial amount of savings that households have built up in developed markets since March. In the U.S., for example, aggregate personal savings over the past twelve months were $1.3 trillion higher in September than they were in February. If effective vaccines are rolled out, it appears probable that much of those savings will be unwound, with spending likely to be particularly strong in badly hit services sectors such as hospitality and tourism.

Thank you for joining us for another trading week and reviewing our weekly “Must Knows”! To receive and review our weekly, full-scale Research Report each Sunday and our State of the Markets weekly video analysis every Thursday, subscribe to our Contributor Membership level at just $7.99 monthly (Cancel any time)! With these two weekly deliveries, you’ll have all the unbiased and fact-driven market and economic data analysis at your fingertips. Don’t make capital allocation decisions based on headlines that brush the surface of what is and isn’t affecting markets. Let our deep-dive analytics supply you with bottom-up and top-down analytics. You won’t be disappointed. Upgrade today!!


