
Welcome to another trading week!! In appreciation of all of our Basic Membership level participants and daily readers of finomgroup.com content, we offer the following excerpts from our Weekly Research Report. Our weekly Report is extremely detailed and has proven to help guide investors and traders during all types of market conditions with thoughtful insights and analysis, graphs, studies, and historical data/analogues. We encourage our readers to upgrade to our Contributor Membership level ($7.99 monthly, cancel any time) to receive our Weekly Research Report and State of the Market Videos and take advantage of this ongoing promotional event today! Have a great trading week, be in touch, and take a look at some of the materials in this weekend’s published Research Report!
Research Report Excerpts #1
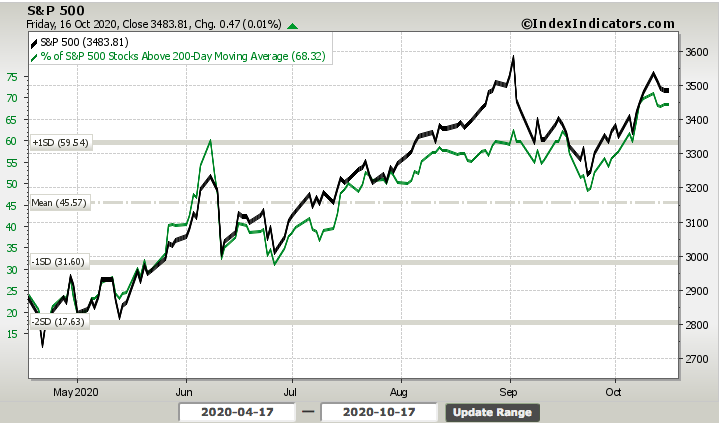
Moving away from our small-cap index and back to large-cap index issues, I don’t see broad market breadth deterioration. What I see is sideways, choppy market breadth that may persist without a more tangible catalyst to boost investor sentiment. The percentage of stocks trading above their 200-DMA remains elevated, although lower on a WoW basis by roughly 1 percentage point. The absolute level remains quite strong.
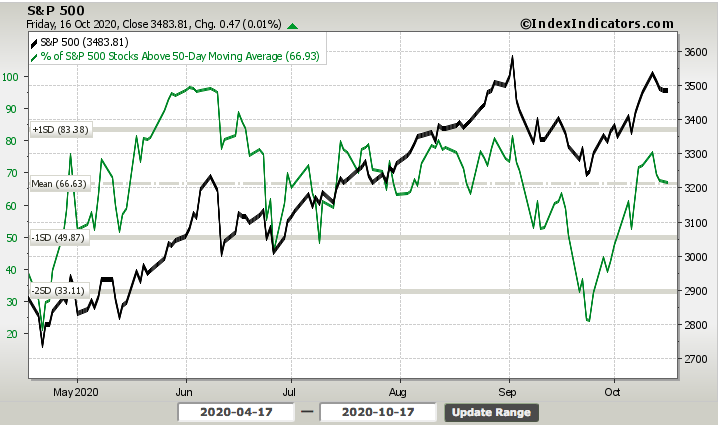
We can see similar weakened, but not weak breadth in the percentage of stocks trading above their 50-DMA in the chart below. This particular breadth indicator proved weaker than the 200-DMA breadth indicator given the proximity of the moving average with current SPX price.
Given that the markets basically went nowheres this past trading week, breadth proves less consequential as such indicators move little as well. Our longer-term trend remains our guide under such circumstances and until the markets or breadth signal something more relevant.
Research Report Excerpts #2
So while CAT shares are responding to what is a likely recovering global economy for years to come, BA shares are also responding to the probability of new orders and resumed normalized business operations that should also feed through to the regional manufacturing indexes. There’s a goodly amount of strength in the XLI supporting investors who choose more diversification through ETF investing and those who think like a sailor as opposed to a surfer! More on that in a bit.
In keeping with a focus on defining choppy near-term expectations but longer-term bullish momentum, it’s hard to argue with new highs in the Equal-Weight Consumer Discretionary ETF (RCD), Retail sector ETF (XRT), Home Construction ETF (ITB) and Semiconductor ETF (SOXX)
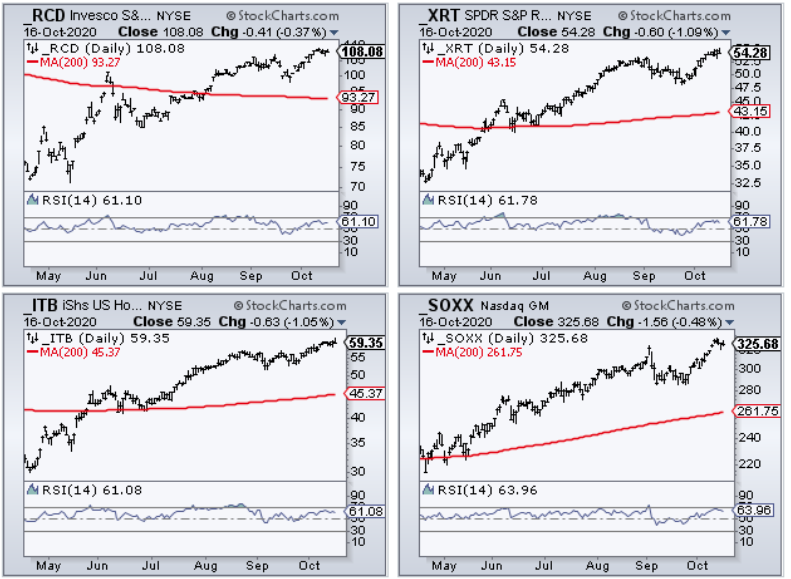
The reason why I didn’t include the Cap-Weight Consumer Discretionary ETF (XLY) is because that horse left the barn a long time ago. Two stocks within XLY make up some 35% of the ETF, Amazon (AMZN) and Home Depot (HD). As they go, the XLY goes and therefore it doesn’t give us a really good gauge of the consumer and the broader consumer discretionary stocks’ performance. With the Equal-Weight Consumer Discretionary sector RCD also hitting new highs recently, this offers an under-the-surface look at consumer discretionary stocks and supports the understanding of absolute strength within the sector and the economy.
Research Report Excerpts #3
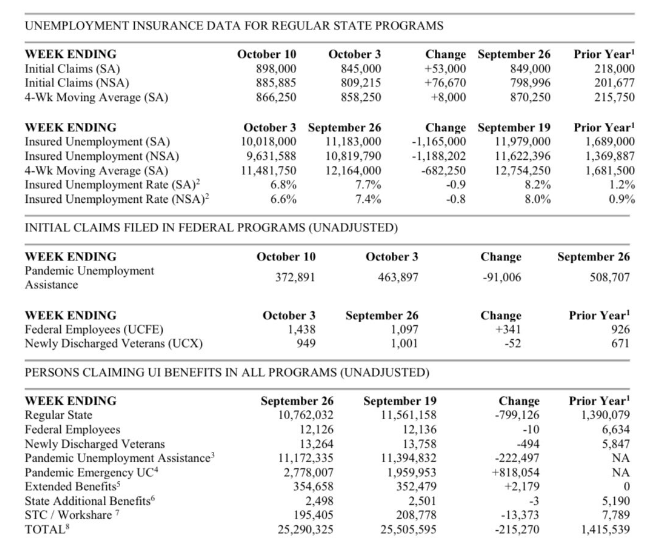
The table above comes directly from the jobless claims report. The very bottom line identifies total claims. Taking together all jobless claims categories, jobless claims fell by ~215,000 last week.
With all the jobless claims data we have since March, something just doesn’t add up. The fact is that the U.S. recorded roughly 50 million initial claims in the four months between March and June, yet that translated in a peak to trough drop of just 22 million jobs. That math just doesn’t make any sense. Fifty million people said they were out of a job and filed a claim. Yet, and to repeat, the Nonfarm payroll report said we only lost 22 million jobs over the same time period. One can only conclude from the black and white data that the pace of REHIRING was either remarkably rapid or it should be a red flag that something is broken in the claims data process or processing of claims.
I can recall from the heights of the pandemic back in April and May when individual state unemployment offices were being overrun with claims and saying that our SYSTEMS weren’t created to handle such record, rapid level of claims filed. I’m now more convinced, based on the weight of the evidence, that this is the underlying problem with the jobless claims data to-date. Having said that, presently and until further notice, this is the data we have to work with. To the degree that the market has seemingly bucked the weakness in the jobless claims data, it may have long-since taken such a rational and logic-based approach.
Research Report Excerpts #4
Monthly retail sales for September rounded out the most pressing of economic data this past week and it proved to be much stronger than economists were forecasting… much stronger! In fact, September marked 5 consecutive months of YoY gains. It is worth noting the economy has never been in a recession after 4 or more consecutive monthly gains in retail sales. Still, in the face of one of the most severe recessions ever, it took only a few months for sales to get back to new highs, as shown below. Historically, new highs in retail sales happen in expansions, and this is yet another clue the recession is likely over.

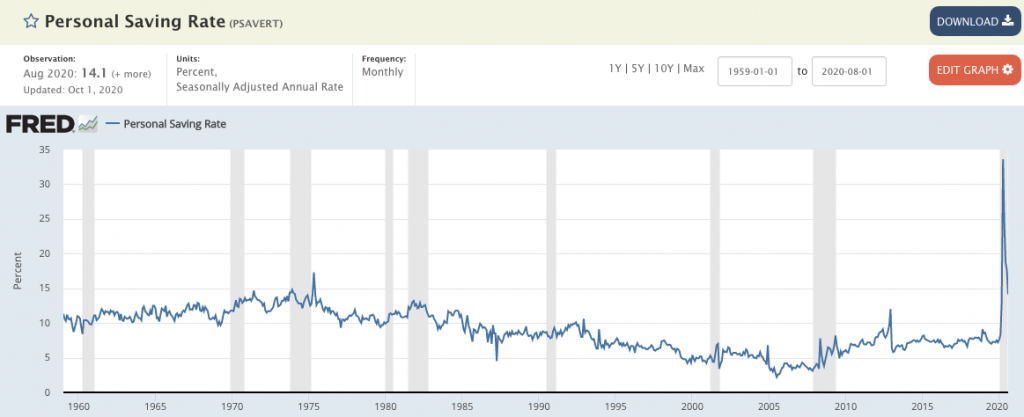
September retail sales grew 1.9% from August and were up 5.4% year-over-year. Such YoY strength would not be assumed even in expansion years. This strength in retail sales is undoubtedly a byproduct of the former unemployment insurance benefits from the Cares Act, which accelerated the Personal Savings rate to record levels.
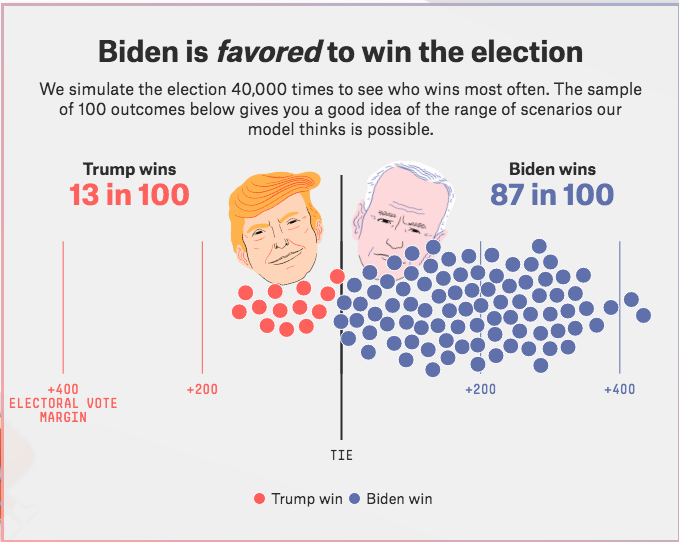
Another factor in the unusually strong September retail sales was likely a factor of pent-up demand combined with a belief that more fiscal relief was coming. This belief, despite the seeming impasse amongst Congress to deliver any relief before the election, is also likely due to what is extrapolated in the polling data.
Research Report Excerpts #5
Due to the number and magnitude of these positive EPS surprises, the blended (combines actual results for companies that have reported and estimated results for companies that have yet to report) earnings decline for the third quarter is smaller now relative to the end of last week and relative to the end of the quarter. As of today, the S&P 500 is reporting a YoY decline in earnings of -18.4%, compared to a YoY decline in earnings of -20.4% last week and a YoY decline in earnings of -21.0% at the end of the third quarter. Positive earnings surprises reported by companies in the Financials sector were mainly responsible for the decrease in the overall earnings decline during the past week.
Insight/2020/10.2020/10.16.2020_EI/S%26P%20500%20Earnings%20Growth%20Q3%202020.png?width=920&name=S%26P%20500%20Earnings%20Growth%20Q3%202020.png)
As of today, the S&P 500 is reporting a YoY decline in revenues of -3.3%, compared to a YoY decline in revenues of -3.5% last week and a YoY decline in earnings of -3.6% at the end of the third quarter. Looking at future quarters:
- Analysts predict a YoY decline in earnings in the fourth quarter (-11.8%) of 2020.
- However, they are also project a return to earnings growth starting in Q1 2021 (14.1%).
- The forward 12-month P/E ratio is 22.0, which is above the 5-year average and above the 10-year average.
- During the upcoming week, 96 S&P 500 companies (including eight Dow 30 components) are scheduled to report results for the third quarter.

Research Report Excerpts #6
Friday morning October 16, a couple of very large VIX option trades hit the tape. Both trades were 1 x 2 put spread, using the same strike options, initiated at the same price, but differing with respect to expiration dates. The first trade consisted of a buyer of 59,757 of the VIX Mar 21 puts at 1.74 who then also sold 119,514 VIX Mar 17 Puts at 0.45. The net result was a cost of 0.84 per spread. The payout at March expiration shows up below.

Spot VIX was quoted at 26.25 and the March VIX future was trading at 27.05 when this spread was executed. Anywhere above 21.00 this trade goes out with a loss equal to the cost of 0.84. The range of profitability, however, ranges from 13.84 on the downside and 20.16 on the upside. Best case is a March 2021 VIX settlement of 17.00 which results in a profit of 3.16 per spread. Two trades, totaling about 360,000 VIX option contracts, are looking for VIX to return to the teens.
Research Report Excerpts #7
David Kostin, Goldman Sachs’ chief U.S. equity strategist argued that the macro-outlook remains upbeat, despite headline risks. Yes, he says that a Biden win will mean higher corporate taxes. But, he argues, there are a lot of positive offsets to the increased taxes. First, Kostin believes that a Biden win means that a larger stimulus deal is likely, which will be “additive to earnings.” This alone, Kostin says, will overcome the higher tax rates (Kostin’s team projects next year’s S&P 500 EPS will be between $170 on the low end and $179 on the high end). LPL Financial agrees with Kostin on the potential offset to tax increases coming from a fiscal package.
“Higher taxes may be one part of it, but Biden is also looking at huge spending initiatives,” explained LPL Financial Chief Market Strategist Ryan Detrick. “Stock markets like spending, and this could more than help offset potentially higher taxes.” Lower tariffs could potentially provide another offset as well.

Next, there is the interest rate outlook. With Powell & Co. saying in no uncertain terms that rates are going to stay lower for longer, which historically has been positive for stocks. As is the idea that corporate America will likely resume buying back stock next year and also increase dividends. Then when you toss in the idea that foreigners continue to pile into U.S. stocks, Kostin argues that we should maintain an optimistic stance toward the U.S. stock market from a big-picture standpoint.
Thank you for joining us for another trading week and reviewing our weekly “Must Knows”! To receive and review our weekly, full-scale Research Report each Sunday and our State of the Markets weekly video analysis every Thursday, subscribe to our Contributor Membership level at just $7.99 monthly (Cancel any time)! With these two weekly deliveries, you’ll have all the unbiased and fact-driven market and economic data analysis at your fingertips. Don’t make capital allocation decisions based on headlines that brush the surface of what is and isn’t affecting markets. Let our deep-dive analytics supply you with bottom-up and top-down analytics. You won’t be disappointed. Upgrade today!!


