

Research Report Excerpt #1
Seriously, investing/trading is hard. Nothing worth doing well is easy, and if it’s something we really enjoy or desire to master/perfect we tend to make it more difficult, given the passion we employ for the activity. So just know these factoids of life apply for investors just the same. All good things come in time; you just have to be willing to spend the time. Not sure how many colloquialisms, which are also truisms, we’ve articulated in the first few segments of this week’s Research Report, but there must be a point in doing so, right? So here’s a possible reason that I often mentor my fellow youth ministers with: “Someone needed to hear this today, even if only one person!”
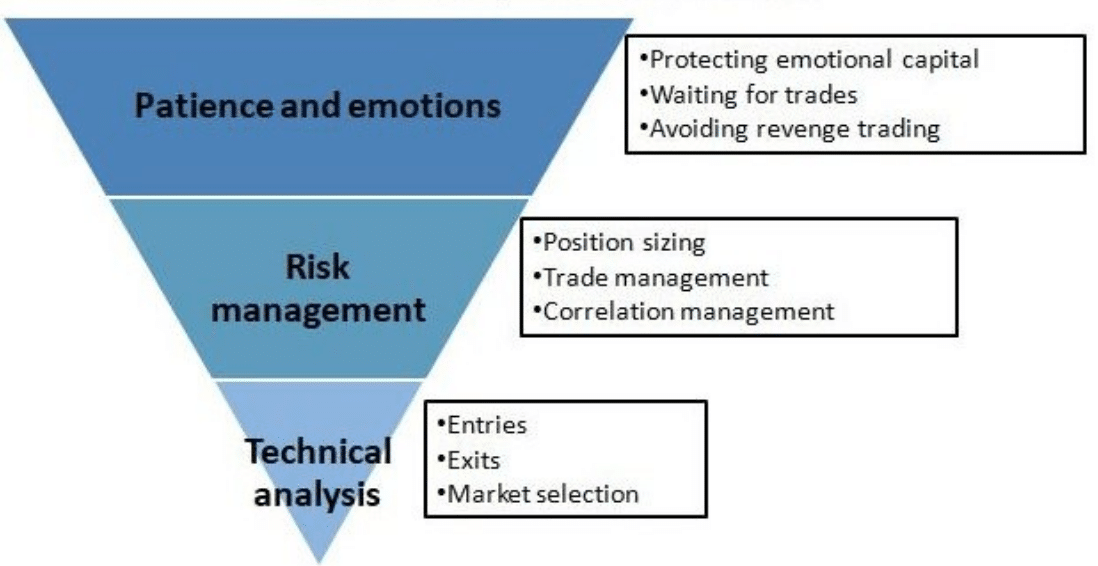
They say the trading hierarchy is 10% Technical analysis, 30% Risk Management and 60% Patience & Emotion management. If you lack patience, and can’t control and recognize your emotions, then you’ll likely find little to any progress with your investing/trading regiments. Technical/Fundamental analysis is the strategy/process and plan to employ. The hardest part is the execution of the strategy/process and plan. What is generally and widely overlooked is the resource-building and/or team the investor/trader surrounds themselves with. As I’ve said many a time before, “The lone wolf trader usually succumbs to emotional trading distress and finds themself out of the market within 2 years.”
Research Report Excerpt #2
This is the expectation, that when, and we don’t know when the Fed will announce its tapering plans, the markets would throw a hissy fit of sorts. Our psychology is already predisposed to this likelihood and our game plan is as follows:
 and the S&P 500 Index (dotted red line) in 2013. After the Fed announced tapering on May 22, 2013, rates and markets rose.")
- In 2013, the Taper tantrum led to a near doubling of the 10-year Treasury yield (solid purple line).
- While there was a modest 6% pullback in the S&P 500 Index (dashed red line) post-announcement, the benchmark was up approximately 30% for the year.
Research Report Excerpt #3

The NYSE % of stocks above their 200-DMA relative to the % of stocks above their 50-DMA helps us to define the strength of the interim trend. When the ratio is above 1.5%, the interim trend is weaker, vulnerable. When it is below 1.5% the trend is strong and/or strengthening. The recent spike in the ratio was cause for concern, but did not warrant panic. We recognized that the ratio did signal weakness in the overall trend in July, but it did not find markets pulling back more than a couple percent and before rallying again. Where this breadth indicator resides presently speaks to interim momentum and long-term stability.
Research Report Excerpt #4
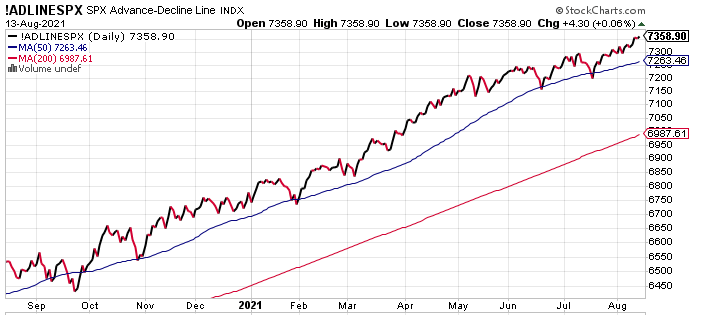
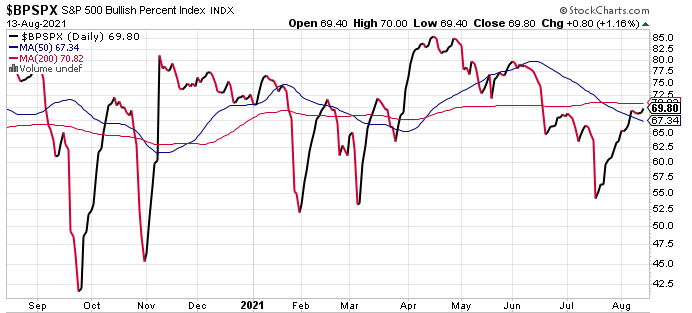
Unlike the NYSE A/D Line, the S&P 500 A/D Line has been confirming new all-time highs. Further more, the S&P 500 Bullish Percent Index is on the verge of firing a bullish signal when it touches 70 percent. (Both charts depicted below)
Research Report Excerpt #5
Here is a note from J.P. Morgan’s head of global equity strategies Marko Kolanovic, regarding Covid:
“We have argued that despite high cases, low mortality of the delta variant in vaccinated countries should help investors look through this – likely the last – COVID-19 wave. Constant Delta variant COVID-19 developments in India, the UK, the US, and China dominated sentiment. The UK Delta episode, where investors could see relatively low peak mortality and the fast timeline of a spike, was not enough to change the market sentiment, and it appears that investors are waiting for the inflection in US cases. This might be happening, and there are strong signs the US is starting to turn the corner in the Delta variant COVID-19 infections. A significant signal of the upcoming peak in US COVID-19 infections is the effective reproduction number (Rt) that is now declining in 40 out of 50 US states. For instance, in FL this indicator declined from ~1.4 to ~1 over the past few weeks, in a sign cases may start dropping soon. In fact, in several states with early Delta variant outbreaks, COVID-19 cases already started declining (Utah, Missouri, Alaska and possibly Nevada and Wisconsin). This makes us believe that the US inflection is days away, and that bond yields and cyclicals bottomed last week.”
Research Report Excerpt #6
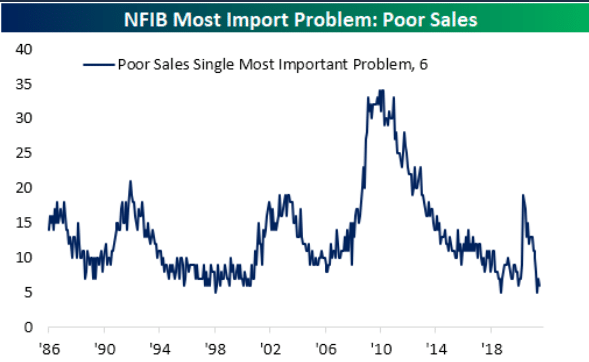
The NFIB labor market index is at a record and still soaring, as businesses scramble to hire, raise wages, and deal with labor shortages. While small business owners are disseminating the difficulties with finding new hires, they still aren’t finding problems with sales.
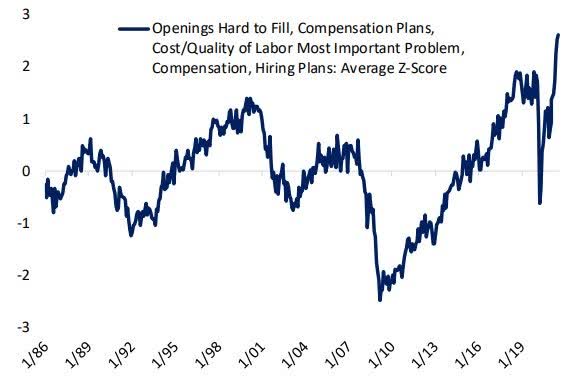
This is one of my favorite indicators and should help investors and economists discern between the noise in the NFIB index and the actual outcomes. There are rarely ideal or perfect small business conditions, but you know the economy is humming when hardly any businesses are citing “poor sales” as their #1 problem.
Research Report Excerpt #7
How do we know that higher prices aren’t impeding consumer spending? The latest Evercore ISI Retailer Survey leaves no ambiguity. Pricing Power amongst retailers is the strongest it has ever been and suggests that retailers have been able to increase prices without pushback from consumers. This may change as the Personal Savings Rate moderates lower into 2022, but Finom Group is of the opinion that CPI plateauing presently won’t demand further price increases by retailers. A $19trn economy has a way of balancing out in due time.

While CPI may be plateauing, supply bottlenecks are still impacting producers. The July PPI number ran much hotter than expected. Headline PPI popped 1.0% in July with the core rate up 1.0% as well, much hotter than expected, and both equaling the 1.0% jumps in June for each.
Research Report Excerpt #8
Research Report Excerpt #9
Digging deeper into VIX’s historical tendencies in August, and according to the Trader’s Almanac, we present the following table comparing the change in VIX in August to the performance of the S&P 500 in August since 1990. S&P 500 has been higher 54.8% of the time over the last 31 years, but its average performance in August has been a loss of 0.6 percent. VIX, as one would likely expect has risen 61.3% of the time in August with an average increase of 9.4 percent. Shaded in the table are the Augusts where VIX (on a closing basis) was up over double digits. Every double-digit VIX gainin August was accompanied by an S&P 500 loss averaging 5.8 percent.

With the exception of 1995, every double-digit VIX decline in August was accompanied by a S&P 500 gain. Single-digit VIX moves were generally not that well correlated with August’s S&P 500 performance. This is also not that surprising as the VIX is attempting to estimate expected volatility over the next 30 days from the time of each tick of the index.


