
How deep with the current market pullback become? That’s the question on many investor/traders’ minds as a 5% S&P 500 (SPX) has taken place under the premise of trade feud escalations. Both China and the U.S. have raised the stakes in their implemented tariff battle and while talks move forward with the hope of finding common ground. A deal is seemingly further off between the 2 economic superpowers, but even so, President Donald Trump has stated he has plans to meet with China’s President Xi at the G-20 Summit in late June. Additionally, late Monday afternoon, the U.S. President suggested that the U.S. Administration will know in 3-4 weeks if progress is being made with regards to ongoing talks and suggesting he expects them to produce positive outcomes.
With respect to the depth of the market pullback going forward, Tony Dwyer of Canaccord Genuity discusses what could distinguish the current market swoon from that of Q4 2018.
In the CNBC interview Monday, Dwyer offers the key difference in the current pullback from the prior being interest rates and the Fed’s stance on interest rate expectations. In Q4 2018, the Fed was still hawkish, raising rates by .25 bps and forecasting 2 rate hikes for 2019. The Fed’s forecast and rate hike further spooked investors and resulted in the final leg lower in the market and until the risk/reward no longer supported the flight to safety, out of equities and into bonds. At its 2018 depths, the S&P 500 forward 12-month PE was roughly 14 with a 10-year Treasury yield of 2.35 percent. Fears were overblown and investors were forced to rationalize where the greatest yield was to be found over the next 12 months and that was likely to be born through the S&P 500/riskier assets. This resulted in one of the strongest snapback rallies in history.
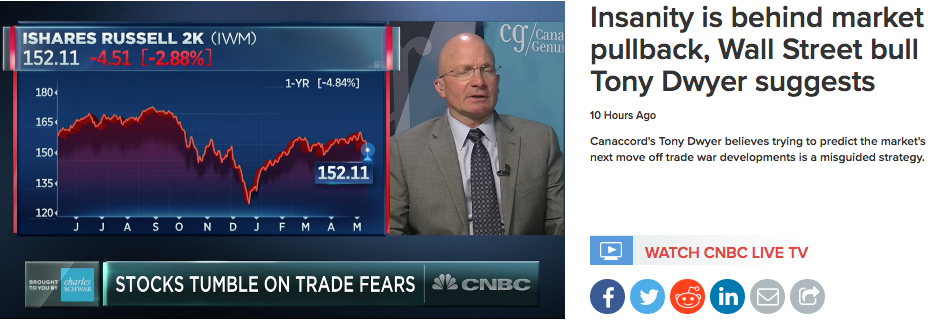
Dwyer distinguishes the current pullback through the lens of the Fed’s pivot to a dovish stance with the greater probability of a rate cut this year and in stark contrast to Q4 2018. As such, the depth of the present pullback still offers investors greater reward and value through the equity market. Dwyer is of the opinion the pullback has or is very nearly complete.
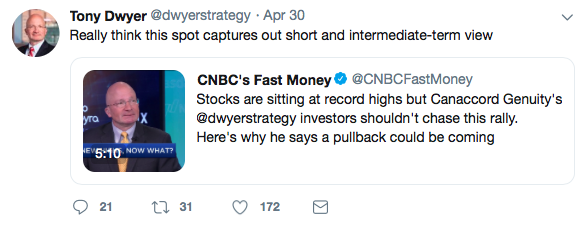
Finom Group suggests that while Dwyer may be proven accurate, caution is still warranted given the elevated levels of volatility in the market that triggers CTA’s and VOL-targeting strategies to sell S&P 500 futures during heightened levels of volatility, while purchasing long –VOL positions to hedge of risk further. Nomura’s Charlie McElligott, the quant analyst whose CTA pricing model has been eerily reliable at predicting stress points in the market, was there chronicling the action as he often does in his daily notes to Nomura’s clients. Having said that, we can’t discount McElligott’s failed “Ides of March” thesis that missed the mark. Nonetheless, his latest interview and notes are recently discussed in a YouTube video below.

McElligott’s model proved useful in showing that the 2,890 level, around where the S&P 500 ended last week, was significant for systematic traders recalibrating their leverage. McElligott sat down for a lengthy interview with MacroVoices host Erik Townsend Thursday night, where the two discussed some of the dynamics at play, including the VIX curve inversion, and the role that the ‘gamma flip’ – that is, where options dealers were forced to buy more volatility to hedge all of these short-vol positions.
“And particularly where we were last week – there were two really big observations – in, frankly, recent weeks. We saw the overall scale of the market gamma position, the gamma profile – in both S&P futures and SPY ETF options – the combined gamma profile reach some serious extremes. Both S&P, SPY, QQQ –representing the Nasdaq side – as well as the delta in the market.
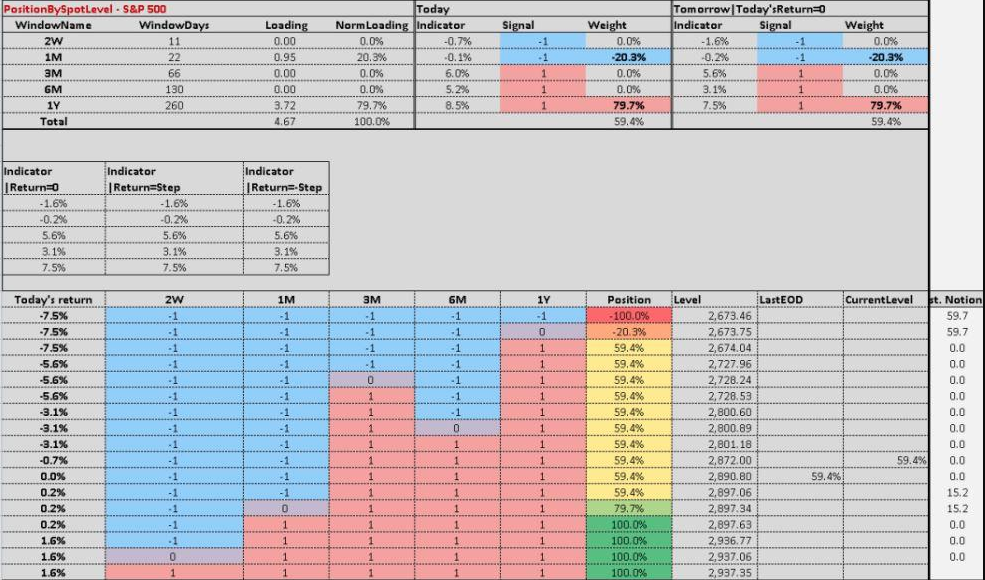
And, really, what was critical for me was that, when I see 99th percentile, 100th percentile gamma in the market, the next thing I do – and I know that we have extreme sensitivity to changes in underlying, let’s say.
From there, when I see that point in our, using our internal estimations, when the long gamma that’s been built into the market – and the long gamma is built into the market because in a trending, grinding, higher type of a market, generally speaking, you can assume that short-volatility strategies are proliferating, are growing.
More people are doing systematic roll-down. More people are selling condors. More people are selling straddles. All sorts of yield-enhancement strategies. You can call overwriting, put underwriting. You can assume that dealers are getting long gamma.
The key for me, though, is where is the point that we actually inflect towards short gamma? And knowing the scale of what Trump tweeted, I knew at an approximation on where we –calculating a flip to short gamma, which means that (I think most readers know), as the market goes lower, dealers are getting wrong-sided and have to actually keep selling more to maintain their hedges.
So that’s where you can get in a short-gamma environment, get these really slippery moves. The convergence that I talked about, though, was the fact that on a gap move lower, which I knew we were going to get – generically I “finger in the air” assumed a 1.5% selloff for the Monday – was that that gap lower was going to gap us down to where our momentum trend, CTA trend model, actually was roughly anticipating the next deleveraging levels.”
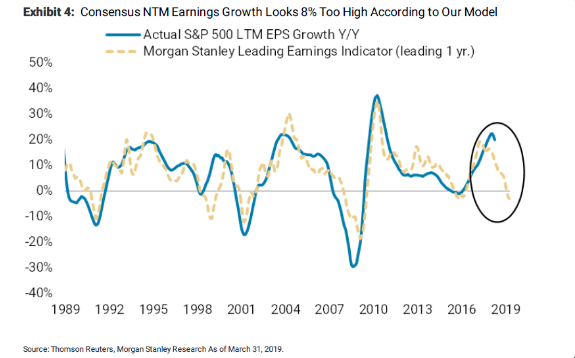
Equity futures are attempting a rebound in the 6:00 a.m. hour on Tuesday on the heels of more positive comments coming out of the White House Administration with regards to trade negotiations. What remains in doubt is whether or not the U.S. will elevate the trade feud by slapping another $325bn in tariffs at the 25% rate in the coming weeks. Such a move by the Administration is the greatest concern for investors as it relates to the outlook for corporate profits. And this is where Morgan Stanley’s chief U.S. equity strategist Mike Wilson offers yet another warning to investors. Like McElligott, the equity strategist’s former warnings were proven inaccurate and investors whom had abided by Wilson’s warnings since late January would have missed out on the S&P 500 rally in 2019. Finom Group previously outlined Mike Wilson’s warnings and his latest mea culpa to markets issued in a CNBC interview just a few weeks ago.
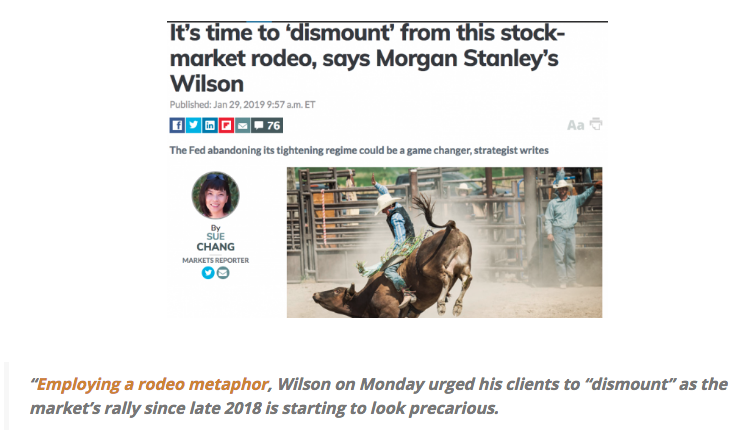
Mike Wilson is back to his old tried and true bearish ways in which his former analysis indicated a Q1 2019 earnings recession and now finds the rhetoric revisited, but under the guise of raised tariffs. In notes to clients and for the CNBC audience Monday Wilson offered the following:
“The U.S. economy could fall into a recession if the country’s trade war keeps escalating. Higher U.S. tariffs on Chinese goods will become a headwind for corporate earnings as companies struggle to offset the negative effect of those levies on their bottom lines.
If the U.S. puts tariffs on the rest of China’s imports, there could be especially dire consequences.
Given other cost pressures and stubbornly low inflation, we are unconvinced that companies will generally be able to fully offset tariff costs through raising prices or through cost efficiencies elsewhere, meaning tariffs will press on margins.
With trade resolution now looking like a ‘show me’ story for US corporates and the market, lack of resolution will be a material potential drag on earnings growth that will be harder to mitigate than the market expects as other costs rise in tandem,” Morgan Stanley’s Wilson said. “While at some point a market “circuit breaker” may make concessions more likely on both sides, this path requires market stress and volatility precede de-escalation … and add to an already difficult earnings growth environment”.
It remains an uncertain environment with regards to the future path of trade talks. Will a deal be reached and at what cost to corporate earnings and ultimately the equity markets? The range of analysts’ sentiment and revised outlooks will continue to march into public view for which to digest and make decisions. Given the uncertainty, investors are likely best found servicing their portfolio by maintaining a watchful eye on markets with a larger cash position and developing their shopping list while lightly dipping into those stocks on pullbacks.
With the notable flight to safety in bonds over the last week, the 10-year Treasury yield had dipped below 2.40% on Monday. Additionally, the 3-month to 10-year yield inverted once again and for the second time in the last 4 trading sessions.
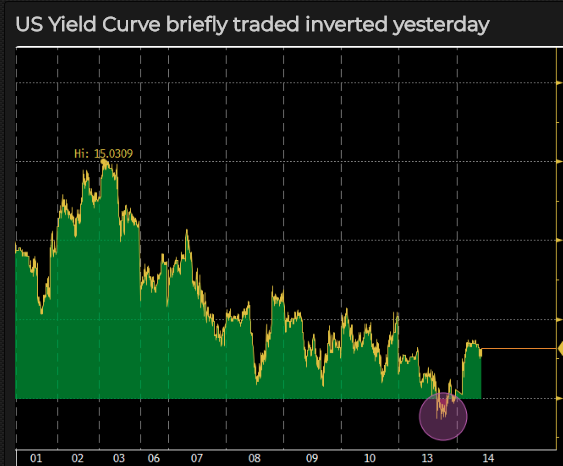
Such yield inversion will of course grab the attention of those remaining with a bearish outlook on the economy and further signal the Fed’s next move. Boston Fed President Eric Rosengren on Monday tried to calm investor fears over the escalation in the U.S.-China trade dispute, but acknowledged the longer it goes on, the more uncertain it becomes.
“The U.S. economy is strong enough to withstand the trade issue coming up now,” Rosengren said, in an interview with Boston radio station WBUR.
Rosengren said the Fed would take a wait-and-see approach to the dispute. How long the dispute lasts is key, he said, with uncertainty rising the longer the fight lasts.
“If it’s only for a few weeks, it is not going to have much impact at all. If it starts to be a situation where we expect tariffs to be high for a long period of time, it does start to disrupt trade patterns.
My own expectation is that we will probably not have a recession,” Rosengren said. While the economy would likely grow more slowly, fiscal and monetary policies are supporting activity. The one uncertainty is trade.”
Earlier Monday, Minneapolis Fed President Neel Kashkari also counseled calm in regards to U.S. -China trade.
“Right now, I’m in a wait-and-see mode,” he said, in an interview on CNBC.
“There has been a lot of bluster on both sides about trade over the past couple of years. We haven’t seen much evidence that it is showing up in the aggregate economic statistics. I’m hopeful that cooler heads will prevail and this won’t go down a very nasty path.”
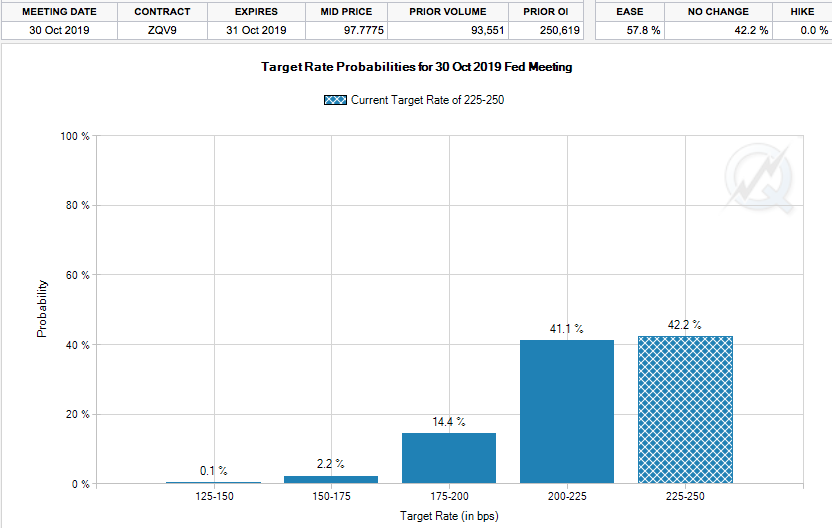
With the Fed increasingly being drawn into the geopolitical skirmish, the market is increasingly calling for a rate cut by the end of 2019. In fact, there is now a greater than 50% probability of a rate cut being heralded by October 2019, according to the CME’s FedWatch Tool.
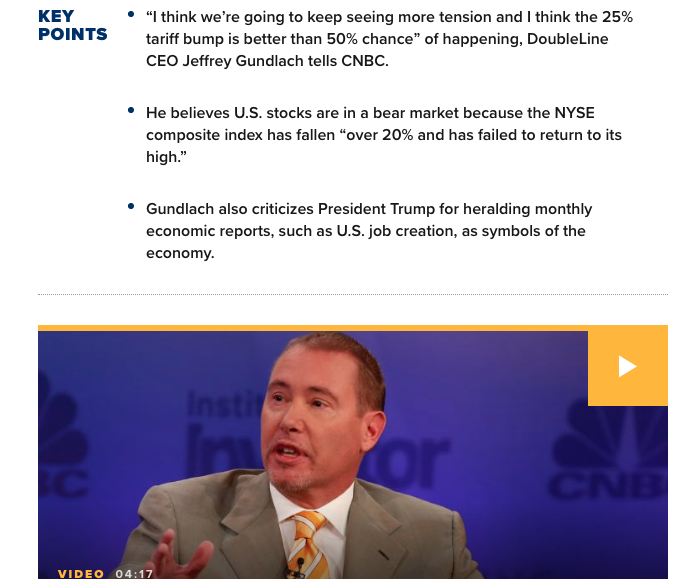
So we’ve from several analysts/strategists and even Fed members, as it pertains to the impact on equities and the economy from elevating the temperature on trade feuds. But let’s take a breath for a moment and rationalize the former offerings against a rational backdrop with recent market expressions and experiences. It is important to recognize that trade news alone isn’t likely to cause the type of devastation that tends to occur in bear markets. And despite Jeffrey Gundlach’s suggestion that we are still in a bear market, the true definition of a bear market falls shy of his rationale in characterizing a bear market.
So far at least, the action doesn’t even resemble the near-bear seen at the end of 2018. Hedge funds aren’t blowing up and causing forced selling. The Fed isn’t on the warpath i.e. raising rates. The economy isn’t in bad shape. Inflation isn’t a problem, even with raised tariffs. And valuations aren’t extraordinary relative to the last twenty years and after a 5% pullback having been realized. Here’s something Leon Cooperman recently said concerning the market’s reaction to the latest escalation in the trade battle:
“All I know is I don’t think we’re heading for a recession. Between valuations and other conditions that are normally associated with an important decline, we don’t have them.”
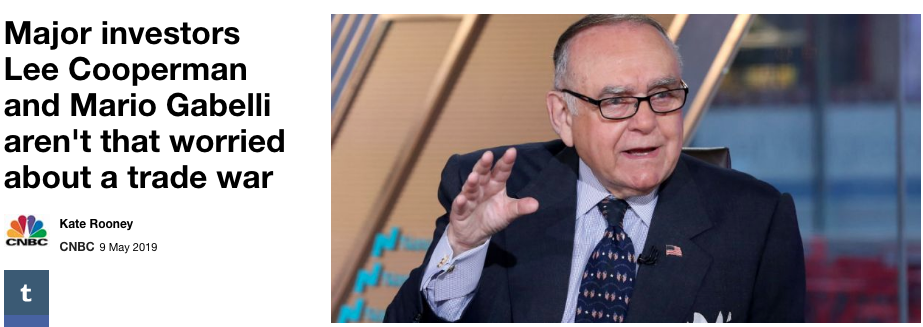
Cooperman said the Federal Reserve is now “the furthest thing from hostile” after its more dovish stance on raising interest rates this year. He also sees stocks’ valuations as “reasonable.” As a result, Cooperman said current market weakness is probably a 5% correction.
“The conditions for a big decline aren’t present”.
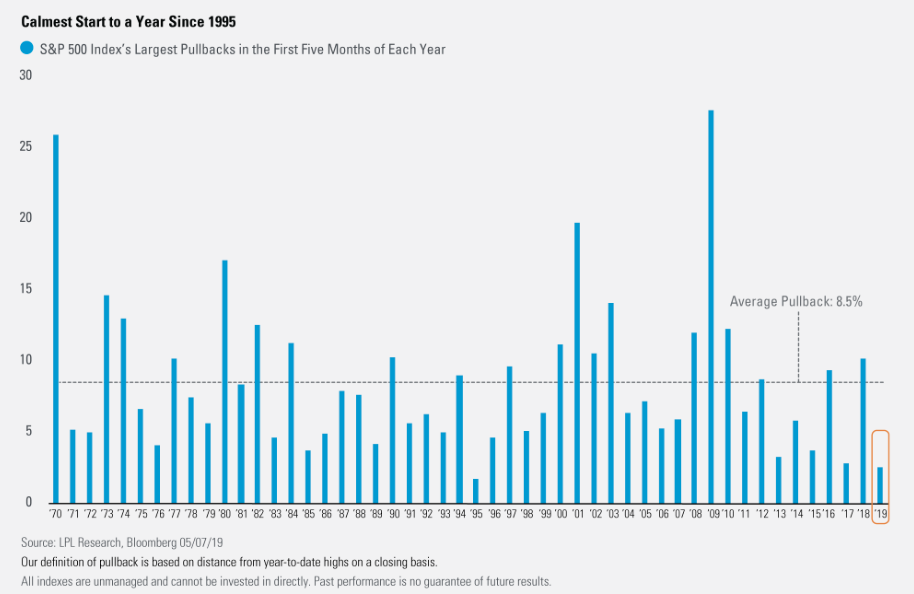
Finom Group can’t stress enough that investors should remain calm and simply modify their expectations for the market in the interim. While market pullbacks are always desired when the market is up trending, when a pullback does arrive, investors forget that former desire and allow negative sentiment to pervade their discipline. The bear market and recession voices loom large during such periods of market strife. Many permabears will claim victory during any market downturn as they refer to errand rationale that revolves mainly on the “eventuality” of a market pullback and not their individual analysis for causation. The reality is that pullbacks are a normal part of the bull market cycle. The S&P 500 has, on average, experienced corrections of at least 5% more than three times a year and has seen at least one decline of 10% or more in any given year. Thus, the current pullback of -2.5% on a closing basis and -5% on an intraday basis doesn’t appear to be anything out of the ordinary. The average year sees a pullback of 8.5% after the first 5 months of the year and this helps put into perspective how rare the start to 2019 has been. (LPL Financial chart)
What usually create anxiety amongst the investor community are not the magnitude of a market decline, but rather the rapidity of the market decline. Such has been the case with recent declines and since 2018, which found intraday Dow Jones Industrial Average (DJIA) losses of greater than 1,000 points in a single day. Such rapid moves are fuel that feed on investor fears, but such moves are have also proven to have equally large snap backs as seen the first trading day after the Christmas Eve market massacre of 2018.
It’s been a rough start to the month of May and certainly permabears are clinging to the “I told you to sell and May and go away” theory. With this in mind let’s take a look at the current situation using market studies. Since we’ve already discussed the Dow and S&P 500, let’s take a look at the Nasdaq (NDX) given it has suffered the largest drawdown to-date.
This is one of the worst starts to May, with the NASDAQ down more than -5 percent to-date. Throughout the NASDAQ’s entire history, such a miserable start to May has only happened 1 other time: May 2000. And yes we know the comparisons to the dot-com bust loom large given the number of unicorn-type IPOs surfacing of late. (Study from Troy Bombardia)
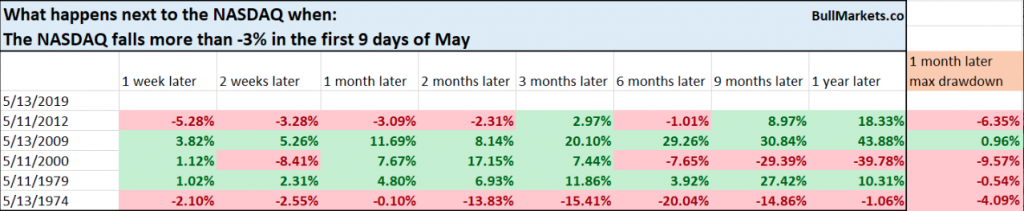
So while there are some bad short-term drawdowns in there, this is not a consistently long-term bearish sign. (Anytime you get a -5% rapid decline in 9 days, there will be big short-term drawdowns. The stock market chops up and down with high volatility).
Here’s the thing about such offered studies, none have the same set of circumstance for causing the drawdowns under scrutiny. In other words, every time is different for which every time there is a measurable difference in the market outcome. The causation for the current drawdown is measured by the elevated tariffs and fears surrounding future escalation of the trade feuds. This is completely unique to all other examples within the noted study. Natural slowing of economic growth or corporate earnings didn’t cause the drawdown, but rather an exogenous event, namely tariffs.
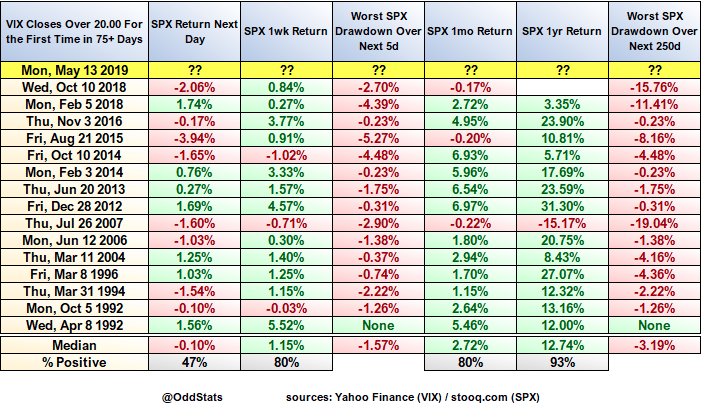
In rounding out our daily market dispatch, European markets are higher in the 6:00 a.m. EST hour and U.S. equity markets are leaning toward a positive open on Wall Street with the Dow Futures up 100+ points. Finom Group is doubtful of the gains holding once the market officially opens and through the trading day. With the VIX elevated and having closed above 20, we would need to see volatility tempered lower before suggesting any gains won’t be met with selling pressure. Having said that, the VIX closed over 20 for the first time in at least 75 trading days on Monday. This must be bearish for the equity markets right? Well, not exactly and as we see in the OddStats table below. Over the course of the next 12 months, the S&P 500 has offered a pretty nice return using the 75 trading day criterion associated with the VIX closing over 20.
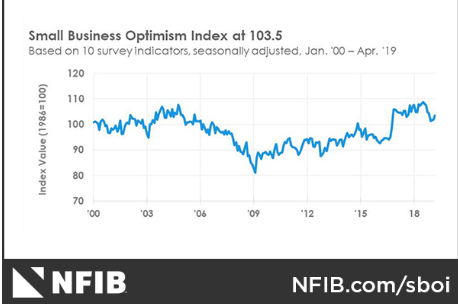
Ahead of the market’s open Tuesday, economic data comes to the forefront, although we wouldn’t expect it to remain front of mind with investors given the geopolitical issues looming. Nonetheless, the latest NFIB small business sentiment index rose in the month of April. The index rose 1.7 points to 103.5, with 8 out of 10 components increasing, led by earnings trends.
“America’s small and independent businesses are rebounding from the first quarter ‘shut down, slow down’ and don’t appear to be looking back. April’s Index is further evidence that when certainty and stability increase, so do optimism and action,” said NFIB President and CEO Juanita D. Duggan. “The continued economic boom is thanks, in a major way, to strong growth in the small business half of the economy.”
We’ll see how things play out for investors/traders Tuesday, but we wouldn’t be too concerned about missing potential upside near-term. Chasing moves higher in the interim may prove unwise, at least until the S&P can recapture 2,900. If you find yourself in need to trade, so be it, but do so lightly and with the impetus to hold positions longer-term if the market should dictate.


