
September being the worst month of the year historically for the S&P 500, declines are largely expected. For the coming week, the expected move for the S&P 500 is $42, much greater than the previous week’s move of just $30.
As we mentioned in last week’s reporting, over the previous 22 weeks the expected move has only been breached 3 times, which is highly unusual and indicative of quant finance and/or mechanical trading. The programs are moving stocks, which create more efficient or inefficient market moves depending on where and when moves are occurring. The problem with quants/mechanical trading is that when the markets achieve greater correlation to the upside or downside, they really get moving and moving quickly. We saw this in January when the S&P 500, Dow and Nasdaq did nothing but move higher; this was good. And again we saw this in February when the major averages broke down in a rather spectacular way; this was ugly.
The S&P 500 fell just about $30 or the expected move last week. So now, out of the last 23 weeks, the expected move has only been breached 3 times. Knowing the expected move for the week can prove advantageous as the week nears its end. If by Thursday the majority of the move has already been made, Friday may prove a trading opportunity centered on the expected move.
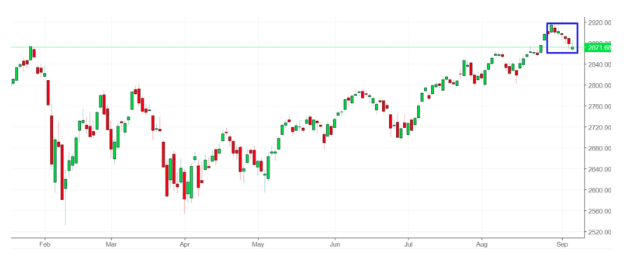
The S&P 500 began last week just above 2,901 and finished the week just above 2,871. The S&P 500 lost nearly 1.5% last week, but was not the laggard as the Nasdaq lost 2.6% for the week. Again, $42 is the expected move this coming week for the S&P 500, which indicates a large leap in volatility either to the upside or the downside. Of course, the implied volatility move is also dependent on whether or not the S&P 500 expected move falls in-line.
Seasonal Volatility
Looking at the historical average level of the VIX we can see that the CBOE Volatility Index tends to be higher around this time of the year.
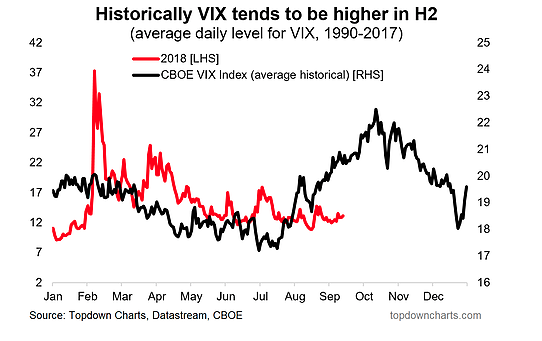
The chart above identifies the historical/seasonal pick-up in volatility in late summer through the autumn time period. While this was not the case in 2017, as the VIX made record level median lows during the same time period, historically we recognize the median move in the VIX. The following chart depicts the VIX from August ’17-Sept ’17.
One quick note with respect to VIX options trading activity to put forth: On Friday, with 2 weeks left to go on the Sept 20 calls, traders were very actively trading these contracts. Some 30,000 contracts traded just this past Friday. Of course we can see the heavy volume produced through the rise in the CBOE VIX of VIX Index or VVIX. VVIX finished above 100 for the week. Typically, VVIX above 100 spells higher volatility to come for the markets.
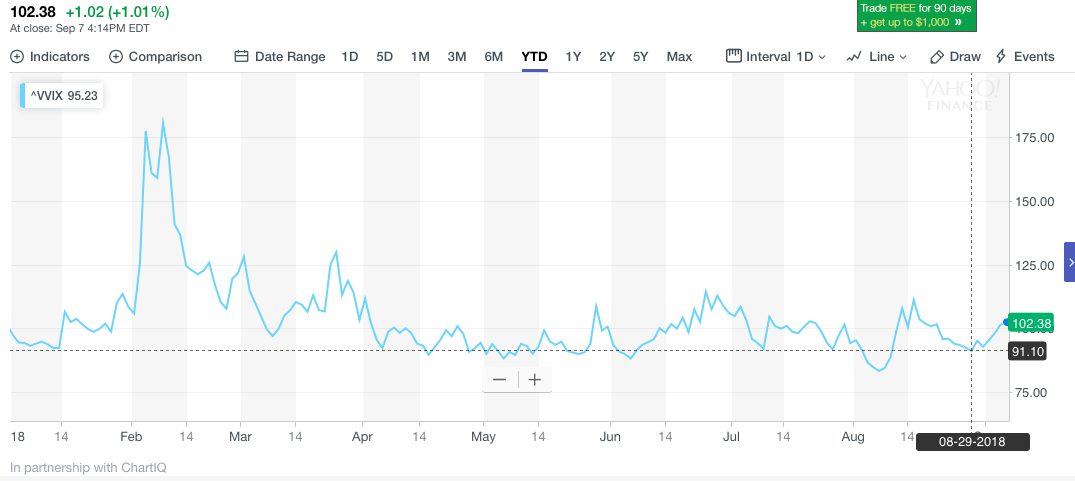
What we can see in the chart of VVIX above is that the 91-level has been a gravity point for VVIX and traders over the last several months. The gravity point was only breached meaningfully back in early August and most recently bounced off the gravity point at the end of August.
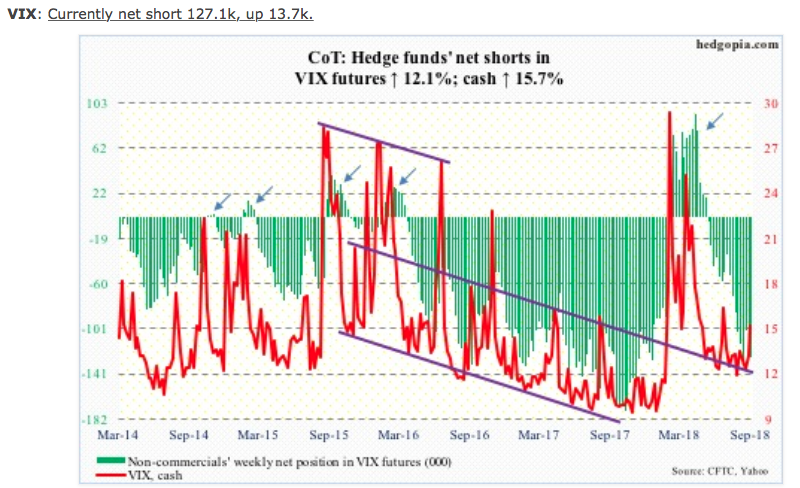
In general, charting volatility to any degree or with efficacy is not advisable. The VIX and the volatility complex of instruments/tools are derivatives. Some are derivatives to the 9th degree. As such they are dependent and reactionary, thus making technical analysis less effective than traditional asset classes and/or markets. With that said, the following chart of VIX-futures net short interest and VIX cash depicts a possible near-term event risk.
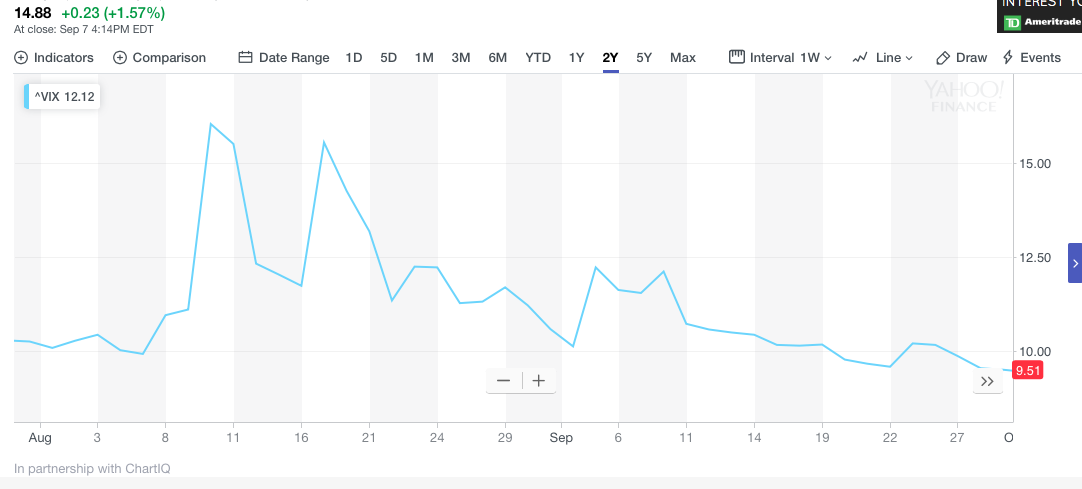
On the weekly chart, the VIX (14.88) just developed a potentially bullish crossover. The last time there was one such crossover was in January. Additionally, when we look back at the month of August, we also understand that even with all the warnings surrounding a potential uptick in volatility heading into the month, it actually proved to be the calmest August since 1967 by some measures. The median average VIX reading in August was 13.6, lower than the five-year average of 14.6.
Goldman Sachs’s Christian Mueller-Glissman recommended investors buy short-dated S&P 500 put spreads to hedge correction risk that may present itself in September or October.
“We see some catalysts for a pick-up in volatility. Compared with last year’s low vol regime, the macro backdrop is less favorable, with global growth momentum negative, monetary policy tightening and more uncertainty on economic policy.”
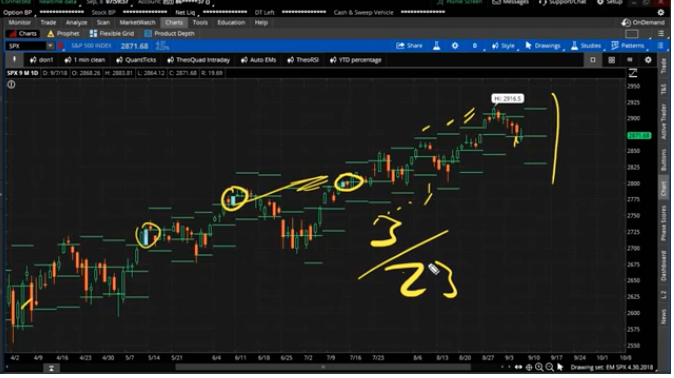
The S&P 500 has completed the first trading week of September with much too be desired and after already giving up 1.5% with a 15% uptick in the VIX. Given the first trading week’s weakness and weakness since the S&P 500 hit roughly 2,920, the chart of the S&P 500 has presented an interesting flag.
Fed Tightening and Tapering
As we edge closer and closer to the next rate hike (due at the FOMC meeting Aug 25-26), investors will likely be bombarded with headlines and market commentary surrounding the yield curve, Fed tapering impact on markets and the like. Recent notes from Barry Bannister, head of institutional equity strategy at Stifel suggest a bear market resulting from the Fed raising rates too quickly. He forecasts a bear market in the next 6-12 months.
“We see stocks falling faster than the Fed can react. Stocks are in “the danger zone,” based on the equity risk premium, or the earnings yield of the market minus the yield of the 10-year U.S. Treasury note. When the premium nears extreme levels, “a short, sharp bear market often occurs.”

“If the central bank hikes rates twice more, which it could do by December, in his analysis, then the fed-funds rate, minus the neutral rate, could cross the “bear market trigger.” The neutral rate is the level at which monetary policy neither cools down the economy nor stimulates it.
Given Bannister’s negative outlook for equities, let’s take a look at the Fed’s tapering activity by way of the following graphic:
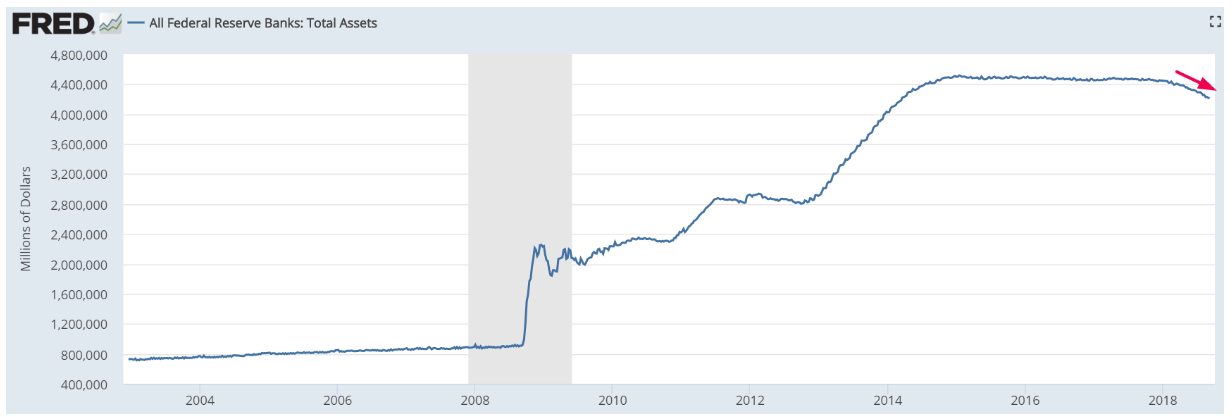
What we see in the chart above is the rate at which the Fed is tapering. It is so extremely slow when compared to the growth in the economy that it fails to impact the economy or the markets. Does Fed tightening and tapering have the potential to impact financial markets and the economy, certainly! The real question is, however, “To what degree and what is the probability given the unique circumstances underpinning the markets and economy?”
S&P 500 Earnings
S&P 500 earnings have grown nearly 25% in the first half of 2018 with double-digit revenue growth and net income. For the Q3 2018 period, earnings are still expected to grow some 20% or better.
According to FactSet, for Q3 2018,the estimated earnings growth rate for the S&P 500 is 20.0 percent. If 20.0% is the actual growth rate for the quarter, it will mark the third highest earnings growth since Q3 2010 (34.1%). The forward 12-month P/E ratio for the S&P 500 is 16.7. This P/E ratio is above the 5-year average (16.3) and above the 10-year average (14.4).
According to Thomson Reuters, the estimated earnings growth rate for the S&P 500 for 18Q3 is 22.2 percent. If the energy sector is excluded, the growth rate declines to 19.3 percent. The S&P 500 expects to see share-weighted earnings of $340.8B in 18Q3, compared to share-weighted earnings of $278.9B (based on the year-ago earnings of the current 505 constituents) in 17Q3. The forward four-quarter (3Q18 – 2Q19) P/E ratio for the S&P 500 is 17.0.


