

Research Report Excerpt #1
What will definitively prove consequential is how an investor reacts or doesn’t react to the seasonal weakness. Does one hunker down, reduce exposure, hedge, pray & hope… or do they continue to lean into the longer-term probabilities and execute their game plan? Historically speaking, and based on my own experience, only one means of participating proves foolproof: lean into the longer-term probabilities and execute the game plan. Let’s consider each of the options mentioned with the following bullet points:
- Reduce Exposure: Stifling your plans to buy dips and remain with existing exposure or reducing exposure holds an aspect of market timing. Why? We would be selling at a lower price than it was formerly, and assuming these are investments, we would be hoping to buy back at a lower price. The fear that caused the sales in the first place are unlikely to abate when prices are cheaper and, therefore, the logic of this exercise is faulty, which is why the exercise usually fails when compared to dip buying.
- Hedge: If we have the cash to hedge, and simply attempting to lessen a drawdown in the underlying with the logic that the market will bounce back, why not increase allocations at cheaper prices, compounding gains for that investment position. If the principle usage of a hedge is to mitigate intermittent drawdowns with smaller, adversarial positions that will demand timing the entry and exit for the hedge, how confident does one feel about there abilities to do so when the general confidence in the underlying investment has proven otherwise? This is why hedging proves a rather poor exercise. Confidence in one position is shaken by market sentiment and countertrend, but somehow an investor will find confidence in a hedge position???
- Pray & Hope: While prayer may be fruitful for spirituality, praying and hoping for things to go well in the stock market simply discourages the disciplines of investing and trading. Do your due diligence!
- Execute game plan: The hardest exercises are often the most logical exercises for an investor to maintain. It’s easy to suggest buying the dips, harder to execute, but always proven the most advantageous for investors/traders (index level). The market has always bounced back, it is just a matter of time.
Research Report Excerpt #2
For all instances of 2 week selloffs heading into the “Weakest Week” (next week), market returns for the Weakest Week were not positive, not positive at all.
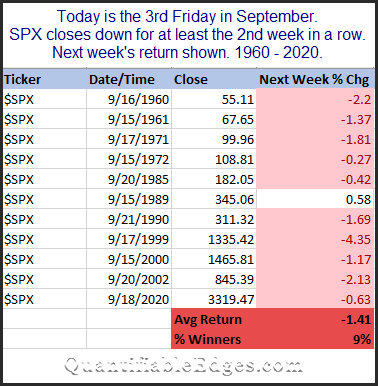
Only 1 time since 1960 has the market been positive for the Weakest Week with a 2-week losing streak going into the Weakest Week; 1989. That’s a lot of red on the screen, a rather substantial average loss during the Weakest Week (next week), and an extremely low % positivity rate. The study was performed by Quantifiable Edges and should be considered by all investors/traders alike. Having appropriate market expectations is just one of the better ways to maintain one’s Emotional Quotient. If the market declines further next week, based on this data point/study, that’s simply normal and to-be-expected. When the market is validating human behavior according to history, it is more easily engaged with one’s game plan. But, but, but… and boy do I got big ole butttttt!!!
Research Report Excerpt #3
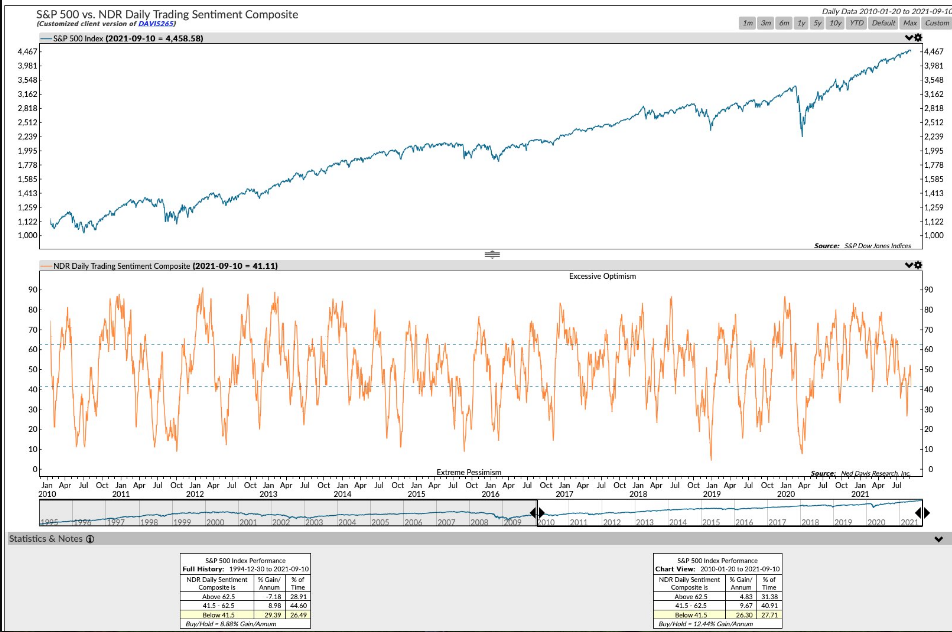
The bottom panel is the NDR Daily Trading Sentiment Composite Index dating back to 2010. The top panel is the S&P 500’s performance over the stated time period. What we want to know is how the market best performs, at different bullish or bearish levels. At the very bottom is the data which defines the lower the sentiment reading, the better the annual gains and positive % rate.
- Coming into the trading week, the NDR Sentiment Index was at roughly 40. Readings above 62 have delivered -7%+ returns per annum. Readings 41.5-62.5 have delivered almost 9% returns per annum. Readings below 41.5 delivered 29%+ returns per annum dating back to 1994.
- As you might have assumed given market price action this past week, the Sentiment Index did fall further and below 41.5 this past week.
- This study and historical data gives relevance to “buy on weakness”.
Investors should not perceive the sentiment data as a signal for WHEN to buy price weakness, but rather TO buy price weakness.
Research Report Excerpt #4
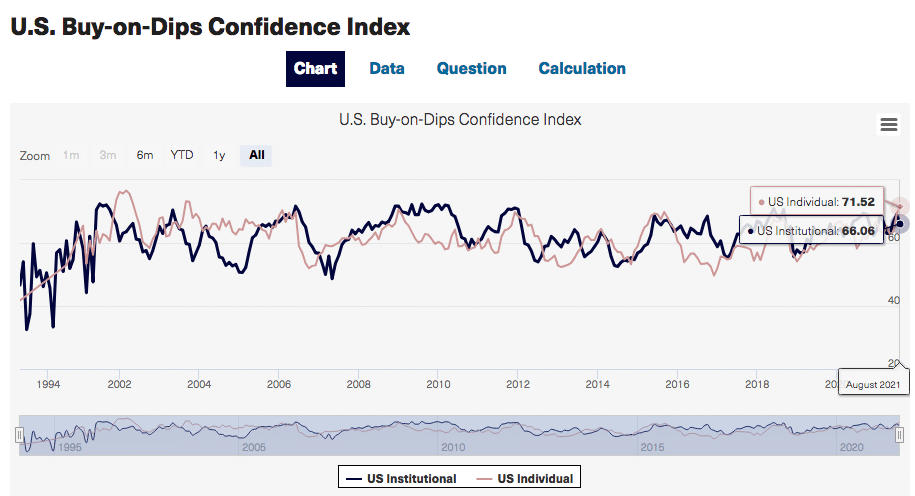
The latest update from the Yale International Center for Finance suggest that institutional dip-buyers have been reluctant to buying price weakness, although individual investors have continued to press forward with the exercise (Data through August). This is a huge distinction that helps to solve the September Effect puzzle that Edward hinted toward atop this week’s report.
Research Report Excerpt #5
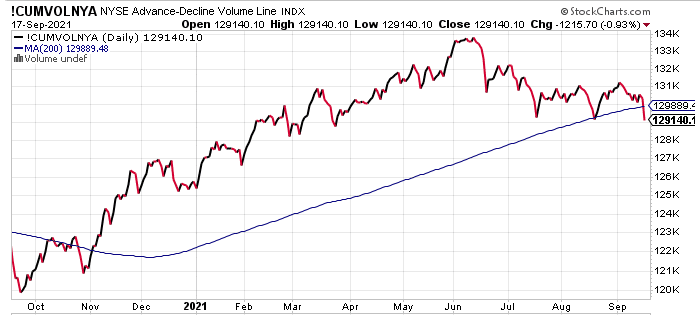
It’s been understood, that through much of the Q3 2021 period, large-cap/growth/tech/FAANMG has been driving the market higher, while small and mid-cap stocks have continued to consolidate. The Russell 2000 even broke below its 200-DMA briefly, a couple of weeks ago and before rebounding. What the NYSE A/D Volume Line above informs is that indeed, the selling pressure/declining volume has been robust since advancing/volume prevailed and the A/D Line peaked in June. Indeed, the market has wanted a bigger drawdown based on the declining volume outpacing advancing volume, but for the sake of large-cap market performance, the S&P 500 has not been able to achieve a bigger drawdown.
Research Report Excerpt #6
Recall from our April 25, 2021 Research Report as follows:
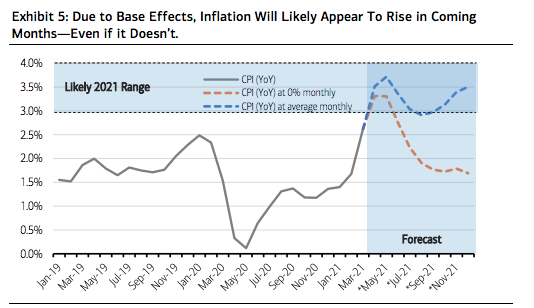
“As the economy rapidly accelerates out of the coronavirus-induced recession, some lingering effects need to be understood. An important one is the near-term trajectory of inflation. The depths of the crisis saw 3 months of deflation as measured by monthly changes in the Consumer Price Index (CPI). March, April and May of 2020 saw price declines of -0.3%, -0.7% and -0.1%, respectively. Three consecutive deflationary readings is unusual, happening only 3 other times in the past 7 decades (Global Financial Crisis, Tech bubble, and Saving & Loan Crisis). These low CPI readings lead to what economists term “base effects.” Since the base on which CPI is measured was so low one year ago, future YoY CPI readings will be relatively high. In fact, even with no inflation at all, exceedingly unlikely, YoY CPI will likely register above 3% in both April and May! If inflation simply averages the same monthly rate it has since 2019, still a conservative estimate, CPI should be in the 3% to 4% range for 2021 in our view, averaging 3.3% on the whole of the year. (Merrill Lynch)”
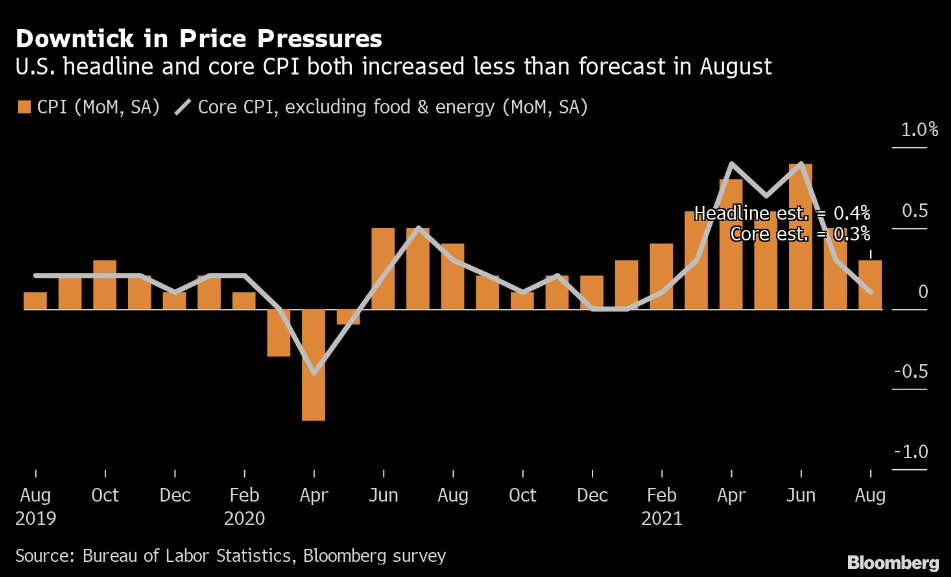
- Inflation update: 1) CPI +0.3% in August 2) Core CPI +0.1% 3) CPI YOY +5.3% 4) Core CPI YOY +4.0%.
- This is already the second report that comes in a bit below expectations,too soon to claim victory, but Team Transitory is still ahead. From a Fed perspective, it doesn’t change the tapering outlook but it gives ammo to Powell to continue to fend off calls for 2022 hikes.
From this point forward, market participants will best be positioned monitoring the monthly CPI data, but remaining flexible as there could prove acceleration and deceleration periods ahead. There remain both headwinds and tailwinds to all inflation data. Wage inflation is still a tailwind for inflation.
Research Report Excerpt #7
There are a great many reasons to remain optimistic about the economic cycle, despite the prevailing headwinds. Shipments of core capital goods suggest CAPEX is booming!! The level of shipments far exceeds the previous peak. New orders of core capital goods are running at a 16% & 13% annual rate over the last 3 & 6 months, respectively, suggesting CAPEX expansion is carrying momentum in the second half of 2021.
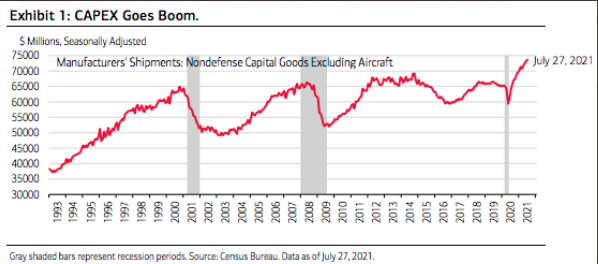
Business investment will likely continue to prove strong into 2022. Mike Zaccardi a former finance and economics professor at the University of North Florida outlines 3 reasons why capex will continue to boom going forward:
- A significant contributor to the need for increased capital spending is capacity utilization which has only grown tighter as 2021 progresses. With global PMIs having recovered, we foresee firms realizing the need to invest in their businesses to prevent future waves of backlogs. Google search trend volume (worldwide) of “Supply Chain Disruption/Backlog” is well off the 2020 peak, but remains higher than pre-pandemic levels.
- Another macro condition that serves to bolster capex optimism is loose lending standards. Banks are willing and able to dole out credit to companies to a degree not seen in the last 30 years. Historically, when bank lending standards are this easy, S&P 500 firms pounce on the chance to invest. So far, there has only been a minor uptick in capex spending, but it has turned the corner. We expect continued upward momentum.
- The average age of fixed assets (government) eclipsed 25 years recently. (Compare that to the mid-20th century average of about 13 years.) Not surprisingly, government investment as a percent of GDP has drifted back near all-time lows as shown in this week’s featured chart. Of course, we know that legislation will likely be passed in the coming weeks to boost spending, but investors might be under appreciating the powerful combination of macro factors driving both public (government) and private (corporate) investment.

In piggy-backing on Mike’s analysis and opinions for the Infrastructure Bill, Finom Group is of the opinion the passage of such a bill is unlikely ahead of the debt ceiling being raised in October. In fact, the two may prove tethered at the hip, so to speak.
Research Report Excerpt #8
Having said that, what was the maximum drawdown and drawdown average from the most recent Chris Ciovacco study?
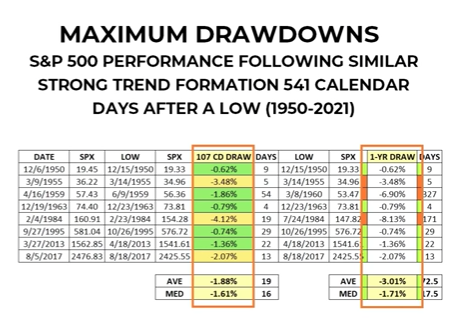
Over the next 107 days, the maximum drawdown in each of the annual years with a like S&P 500 pattern to-date was 4.12% in 1984. The average maximum drawdown was just 1.88 percent. Since the date of the pattern study, the S&P 500 was down on both September 16th and 17th for a total of just over 1 percent.
Research Report Excerpt #9
I have said that at this stage of the uptrend, if the market is going to hold a bigger drawdown, it would have to see the right conditions or be presented by way of a catalyst. No catalyst has been presented, but the conditions may be in the works by way of downward pressure on the most heavily weighted stocks in the market.
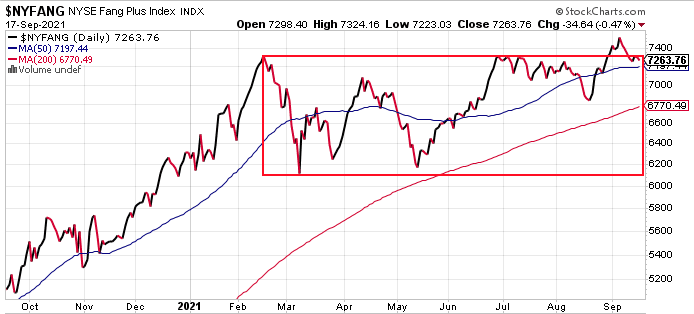
In early September, with the market making a record high, the NYSE Fang Plus Index made a new all-time high and broke out of a nearly year-long consolidation phase. Since then, however, the Index has retested the upper-levels of the consolidation box. These are the large and mega-cap stocks, which have recently come under pressure, creating the appropriate conditions for a bigger pullback in the S&P 500.


