
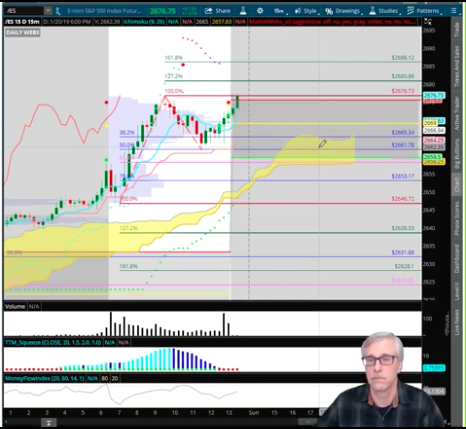
Wayne Nelson brings us his latest daily, technical market recap as Amazon delivers results that beat on top and bottom line, but revenue guidance disappoints. Please click the link to access the video.
Don’t forget, Friday morning ahead of the opening bell is the all-important Nonfarm Payroll report. Like the latest Initial Jobless Claims, there may be some seasonal factors that impact the latest Nonfarm Payroll report.
“The surge in seasonal hiring is going to reverse. That’s seasonally adjusted but it’s larger than usual hiring,” said Diane Swonk, chief economist at Grant Thornton. “We could have a larger than usual seasonal layoff. Leisure, hospitality, warehousing, transportation are all areas that had a big move up in November and December.”
Swonk expects 170,000 jobs were added in January. “There’s a real risk it could come in on the weak side because of all these factors, not just the shutdown but it’s the revision to the mean.”
The following table indicates the anticipated economic data and expectations from the data to be released Friday.

In terms of the January 2019 market performance, WOW! The S&P 500 jumped 7.87% this month, its best January performance since 1987, and its biggest monthly gain since October 2015. The Dow rose 7.17% in January, its largest one-month rise since 2015 and biggest January gain in 30 years.
“The market is now “thinking about what is the next catalyst,” Lafferty of Natixis said. “It doesn’t feel, to me, like this pop in January is the beginning of a big new move. It feels like it was just a rebound from oversold levels.”
“Markets are rebounding and some recession fears are fading. Central banks have blinked, moderating their hawkish stance,” Alberto Gallo, head of macro strategies at Algebris Investments, wrote in a note. “If we look at monetary policy today, there are relatively low risks that the Fed may turn aggressively hawkish, ending the cycle prematurely.”
The S&P 500 has officially entered overbought territory. As it was during the Q4 2018 period, markets can remain oversold and/or overbought for longer than people think. Recall from December 2018 and within Finom Group’s weekly research report (subscribe for access) that we indicated the market was oversold for a period of 2 weeks. While initially entering oversold territory, the market took some time to snap back, but it eventually did so. We stress and revisit this subject matter now that we are presented with overbought conditions. This is NOT a sell-signal, but rather a market condition that warrants prudence on the part of investors/traders. Better prices are likely to present themselves in the future for traders.
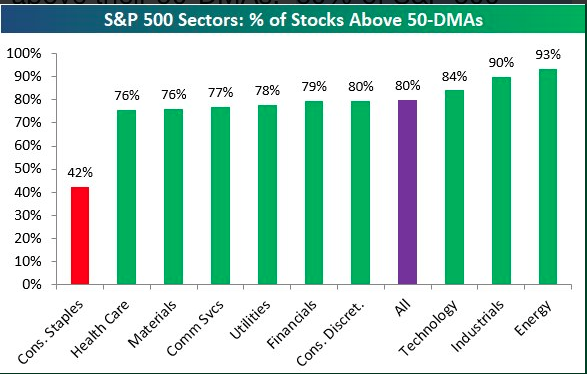
What is one of the ways we define a market as being overbought presently? Nearly 80% of S&P 500 stocks are now above their 50-DMAs, the highest reading in a year. This is one way in which we define the market as being overbought. (See chart below from Bespoke Investment Group)
Naturally, we desire to understand what the probable moves for the market are once entering overbought territory. The chart below is provided by BullMarkets.co and offers a historic perspective on this subject matter.

Based on the table above, it turns out that historically the provided overbought criterion does in deed result in flat to negative returns over the next couple of months. However, the market also has a 57% chance of a positive return over the next 12 months. Given the overbought conditions and greater probability of a near-term pullback, it may prove prudent to raise cash levels and keep a watchful eye on strong earnings reports that deliver opportunity to put said cash to work in the near future.


