
We want to begin this week’s research report with a quick look back at what some might argue was the most important economic data from last week, the Nonfarm Payroll report. The report showed the U.S. adding 164,000 jobs and unemployment falling to 3.9%; the first time the jobless rate has dropped below 4% since the end of 2000. Average hourly wages rose just 0.1% and the yearly rate of pay increases was unchanged at 2.6 percent. With all eyes on the wage inflation component of the report that many blamed for the market correction, the data showed a lack of continued wage inflation.
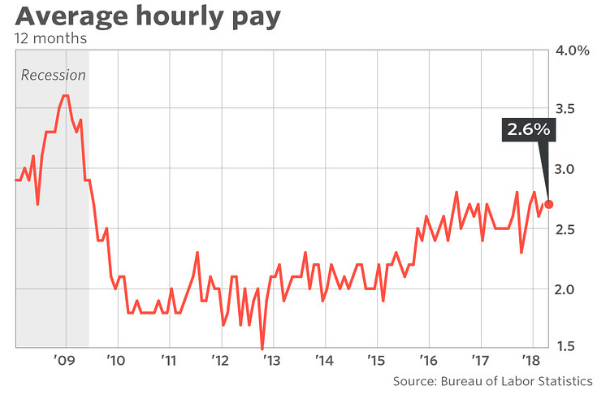
Hourly earnings have been increasing at about a 2.7% pace over the 12-month period, which is above the recovery pace but still short of where Federal Reserve officials are targeting. Although the Fed has struck a more hawkish tone under the leadership of Jerome Powell and as it takes action to wind down it’s balance sheet, there has been no change to the Fed’s dot plot or rate hike path for 2018.
Market Performance Last Week
With regards to the markets performance last week, the Dow Jones industrial average closed 332.36 points higher, up 1.39% at 24,262.51. The S&P 500 rose 1.2% Friday to finish at 2,663.42 after falling 0.4% earlier in the day. The Nasdaq composite rose 1.7% to close at 7,209.62, its first positive day in the last three sessions. On Thursday, both the S&P 500 and Dow Industrials both broke below their 200-DMA for a brief period before rallying sharply. The positive numbers on Friday did not offset weekly losses for the Dow and S&P 500, each down roughly 0.2% since Monday.
What’s Driving Market Activity?
Moreover and with a great deal of impactful economic data already out last week, earnings and geo-political trade issues will dominate market moves this coming week. The U.S. trade convoy of officials traveled to China last week in order to open the dialogue between the two nations and possibly lay a path toward fair trade agreements and policies. As reported by many media outlets on Friday, little progress was made in trade talks between Beijing and Washington officials so far, as neither side could find common ground on sweeping demands. The U.S. asked China to cut its trade surplus by $200 billion while the Chinese officials sought to get Washington to ease national-security reviews of Chinese investments. The trade war rhetoric that launched between the two superpowers nearly a month ago is already having an impact on steel and aluminum prices, not to mention soy bean prices and general sentiment within the World Trade Organization of alliance nations.
Despite geo-political concerns and a sluggish economy in the Q1 2018 period, most analysts believe markets are likely to finish the year with high single-digit gains, given the mostly solid earnings growth that has been reported thus far.
The other geo-political concern for the week ahead comes as the U.S. will decide whether to extend waivers on economic sanctions against Iran. If it doesn’t, the global market could lose about one million barrels of oil a day. The Trump administration has until May 12 to finalize its intentions. The sanctions on Iran were lifted under a 2015 agreement among a group of world powers, including the U.S. and Iran, aimed at curbing Iran’s nuclear activities.
The overarching concern as it pertains to the U.S./Iran sanctions is of course the price of oil. Iran’s current oil production stands at 3.8 million barrels a day, up almost one million barrels since the sanctions were lifted, says Jay Hatfield, portfolio manager of the InfraCap MLP exchange-traded fund. So if the U.S. decides to re-impose sanctions, the oil market could lose just under 1% of total global production, he says.
Whether it is trade with China or the Iran nuclear deal/sanctions that are still in search for resolution, all geo-political issues can be “trumped” by the fears of inflation/reflation. As such, investors and traders would be wise to monitor U.S. bond yields daily and Fed official speeches. Investors will hear from several Fed speakers, who offer more insight into the central bank’s monetary policy strategy this coming week.
The Fed is expected to hike rates in June and at least one more time by the end of 2018. While a 4th rate hike is still in question, the odds have increased with a greater probability as shown via the CME FedWatch Tool.

Marko Kolanovic Market Insights
Marko Kolanovic, global head of derivatives and quantitative strategies at J.P. Morgan Chase offered his latest thoughts on the market last week. It was back in early March that Marko and his team stated the following:
“After running through various negative narratives – inflation, stagflation, hyper growth, rollover of growth, large deficits, tariffs to reduce trade deficits – the most recent bear narrative is trade wars (and particularly one with China). We argue below that this risk is also very low, and if we take the 2015 turmoil as a template for flows from systematic and fundamental investors, markets are likely to reach all-time highs soon.”
Finom Group’s Chief Market Strategist, Seth Golden, agreed with most of the logic and rationale offered by Marko and his team back in early March as disseminated in our weekly research report titled Dominating Headlines Keep S&P 500 From Achieving New Highs. Where Golden and Finom Group didn’t find agreement with Marko’s team is the notion that “markets are likely to reach all-time highs soon”.
Soon, obviously being a subjective notion, our call into Marko offered greater clarity on the definition of “soon”. Their belief was the S&P 500 would reach an all-time high by late April as April tends to be a good month for equities and the market would regain its footing, as geo-political fears would subside. For a variety of reasons, Seth Golden didn’t think new highs would come as quickly as suggested by Marko and his team.
One of the forecasts both Marko and Seth agree on is the median VIX reading as Marko predicts an average VIX reading of 15 in 2018. Just last week, Marko offered 3 big predictions for the markets on CNBC’s Fast Money show.
- The market bottom is in at S&P 500 2,532
- Market volatility will subside (2018 VIX will average 15)
- S&P 500 heading to 3,000 within next 7 months
Earnings Outlook
And so that brings us to earnings once again and as it always should be! Earnings drive markets over time. Even as the current market environment has given way to the macro-fears on trade, inflation/reflation and geo-political tensions, so long as earnings continue to rise and the price-to-earnings multiple becomes cheaper there lay the opportunity for markets to surge in the future.
As noted in previous reports by Finom Group, earnings continue to come in better than expected week-after-week, forcing for agencies to revise their Q1 2018 S&P 500 earnings forecast higher. In the previous forecast, Thomson Reuters projected Q1 2018 S&P 500 earnings higher, from 20% prior to tech reports to 24.6% post tech-reporting season. Let’s now take a look at the latest forecast for Q1 2018 S&P 500 earnings.
Aggregate Estimates and Revisions
- First quarter earnings are expected to increase 25.7% from Q1 2017. Excluding the energy sector, the earnings growth estimate declines to 23.7%.
- Of the 409 companies in the S&P 500 that have reported earnings to date for Q1 2018, 79.2% have reported earnings above analyst expectations. This is above the long-term average of 64% and above the average over the past four quarters of 75%.
- First quarter revenue is expected to increase 8.4% from Q1 2017. Excluding the energy sector, the revenue growth estimate declines to 8.0%.
- 9% of companies have reported Q1 2018 revenue above analyst expectations. This is above the long-term average of 60% and above the average over the past four quarters of 69%.
- For Q2 2018, there have been 35 negative EPS preannouncements issued by S&P 500 corporations compared to 27 positive, which results in an N/P ratio of 1.3 for the S&P 500 Index.
- The forward four-quarter (2Q18 – 1Q19) P/E ratio for the S&P 500 is 16.1.
- During the week of May 7, 44 S&P 500 companies are expected to report quarterly earnings.
As has been the case since the beginning of the year, the consistent S&P 500 earnings revisions higher will likely be a net positive effect on markets in 2018, even though the present market environment is seemingly and endlessly consolidating. Now let’s look at valuations as indicated in the chart below:
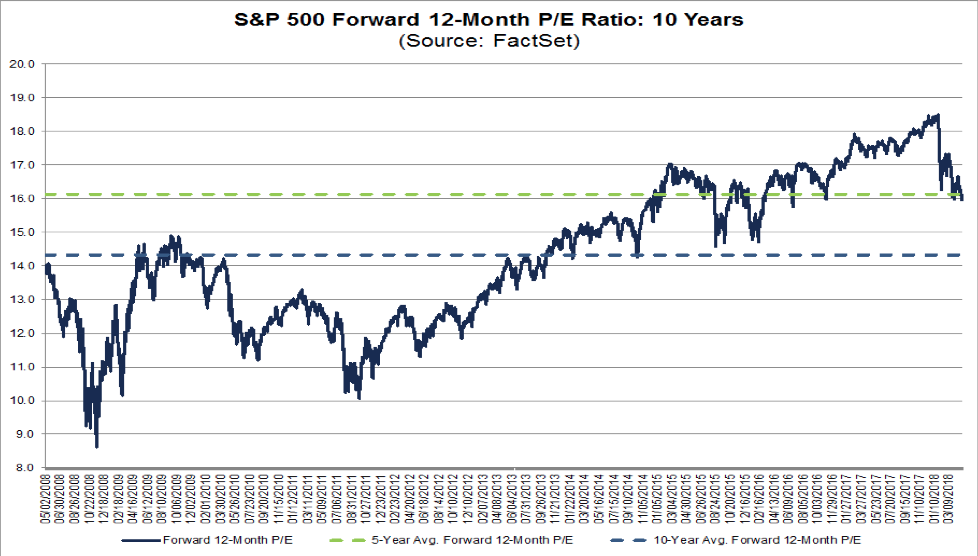
In terms of valuation, the S&P has become less expensive in the face of higher earnings growth. The forward 12-month P/E ratio is 16.0. This P/E ratio is below the 5-year average of 16.1, but above the 10-year average of 14.3. It is below the forward 12-month P/E ratio of 16.4 recorded at the start of the second quarter (March 31).
While the market undergoes this period of consolidation, Finom Group continues to trade what the market delivers and with many trade alerts. We offer these trade alerts on a daily/weekly basis through our private Twitter feed, which can be accessed by subscribers via the link. (subscription needed, hit follow button) Our final trade of last week is depicted in the following screen shot from last Friday. We chose to short shares of VXX as the market began to rally sharply and volatility began to decay.
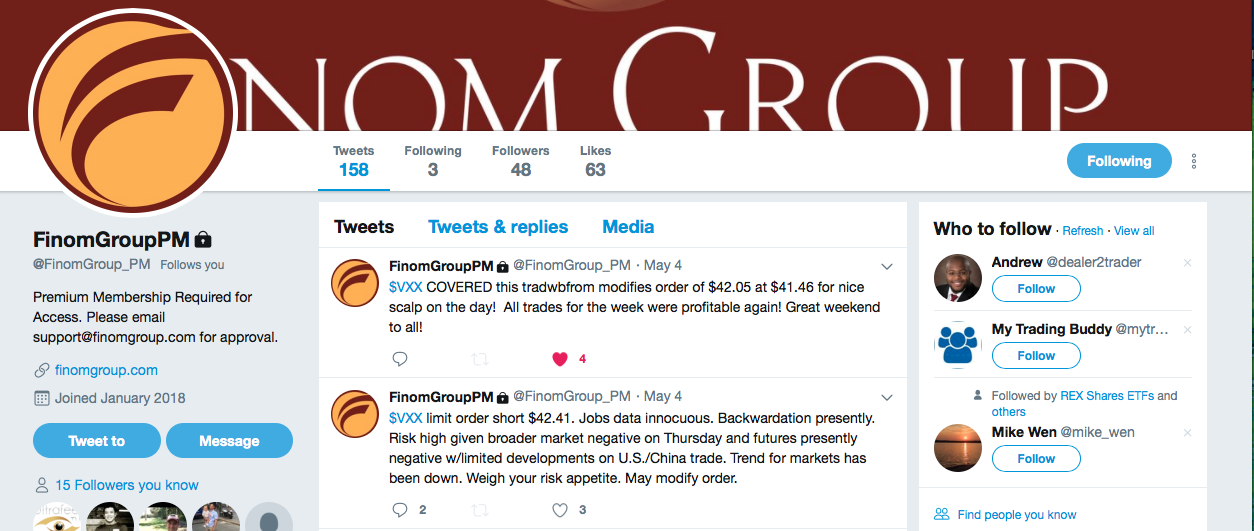
Finom Group’s core investing and trading strategies are centered on the VIX-complex. We will issue our latest insights and teachings on the VIX-complex in future articles.


