
Here we are, ready to close out the trading week and with the S&P 500 (SPX) quite literally exactly where it started the week, 2,706. Pretty unusual to find 4 trading days having been completed with a flat result, but nonetheless here we are. And with that being said thousands of options are set to expire Friday as the weekly expected move for the S&P 500 is $40/points. Unless we see the S&P 500 move beyond $40/points, it looks like the benchmark index with close within the expected move once again. So what brought the S&P 500 all the way back to its starting point on the week? A plethora of headlines stoking a risk-off day on Thursday found the U.S. indices in retreat, pursing the outsized declines in European equity markets that centered on the regions decelerating growth.
Headlines broke Thursday morning that pursued the slowing growth narrative within the European Union. The European Commission, the EU’s executive arm, revised down its growth forecasts for the country on Thursday. It’s now expected to grow by 1.1% this year, from a previous forecast of 1.8 percent. The Commission also lowered its prospects for the euro area as a whole. The region is now set to grow 1.3% this year, from a previous forecast of 1.9 percent.
“In the case of Germany we see that there are certainly some short-term factors in play,” Valdis Dombrovskis, vice president of the Commission, told CNBC’s Willem Marx in Brussels.
But headlines surrounding the EU’s growth only served as kindle to a rising geopolitical fire centering on U.S./China trade talks. National Economic Council Director Larry Kudlow on Thursday said there was “a sizeable distance” to go on trade talks with China. Speaking to Fox Business Network, Kudlow said previous talks covered “a tremendous amount of ground” but said enforcement will be very important, as well as technological and structural issues.
While these headlines were cause for concern, it wasn’t until media headlines confirmed that a meeting between President Donald Trump and President Xi would not take place by the March 2nd deal deadline that markets took a more significant leg lower.
Trump and Xi may still meet “shortly thereafter” March 2, said the official, who requested anonymity. Later Thursday, when asked whether he would meet the Chinese leader, Trump said: “Not yet.” Pressed further on whether he would meet Xi before the March deadline, Trump said “no” and shook his head.
U.S. Trade Representative Robert Lighthizer has said he and Treasury Secretary Steven Mnuchin would make a recommendation to Trump on whether to agree to a summit after the two return from their trip to China next week. A delegation of U.S. deputies will conduct talks beginning Monday, with Lighthizer and Mnuchin joining later in the week.
At its lowest point on Thursday, the S&P 500 was down roughly 1.6% at 2,587 and before rallying into the close, finishing well off the intraday lows.
As Finom Group has been discussing the breadth of the New Year rally, we’ve also been outlining the benchmark index had risen into overbought territory with nearly 88% of equities within the index having risen beyond their 50-DMA. (See Chart Below)
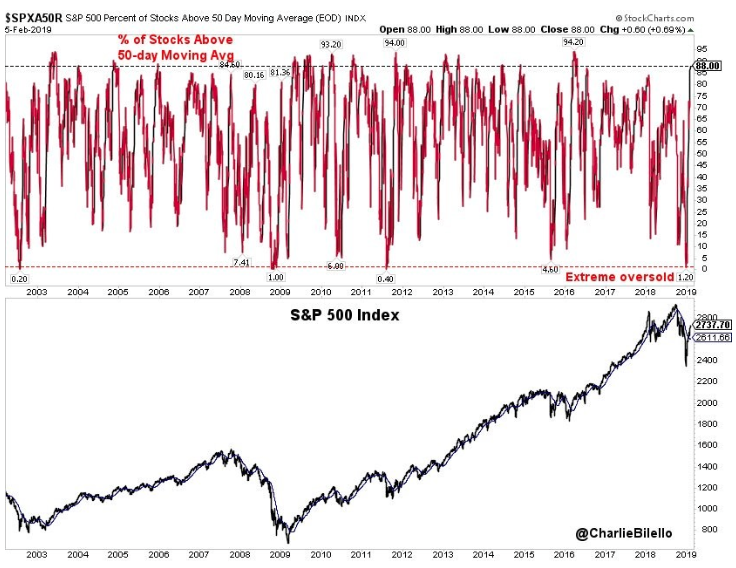
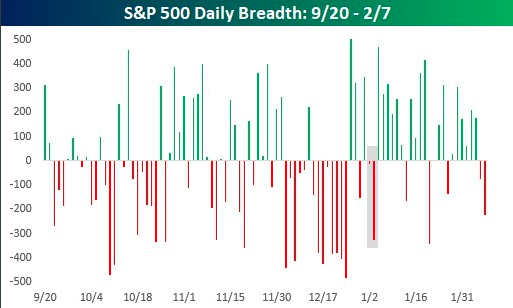
It’s been nothing short of a spectacular rally of the December 2018 lows. At the low in December, the percentage of stocks above their 50-DMA (1.2%) was the 13th lowest since 2001. As spectacular as the market rally has been and in sharp contrast to the December market breakdown, it does appear as if the market momentum is coming to a halt. Wednesday and Thursday proved to be the 1st back-to-back days of negative breadth in S&P 500 since the first 2 trading days of the year.
Friday’s trading day set-up is not terribly favorable given the variables at play and with a relatively flat market week-to-date. While the U.S. economic data suggests stable growth from the Q4 period to present, there remain concerns for the economy on the balance of the year and largely due to the decelerating global growth outlook. The concerns over the U.S. economy have yet to stimulate any near term recession fears and/or recession indicative models, but if we look out to 2020 those models show an increasing probability of a recession next year.

As shown in the chart above from the N.Y. Federal Reserve Research, the probability of a recession in 2020 has increased to roughly 23 percent. That is still a relatively low probability, but something that bears monitoring given all the geopolitical and macro-fundamental issues residing over the global economy. With that being said, the following chart refers to where the market is presently.
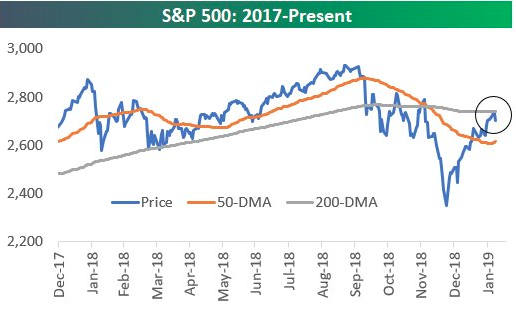
As shown, it appears as if the S&P 500 has failed to break above resistance at its 200-DMA, but time will tell whether or not the benchmark index can regain its momentum and/or breadth. In looking at the charts, Fairfield Strategies technical analyst Katie Stockton sees a ‘minimum’ 2 to 3 week stock pullback in the cards. Stockton said the pullback would hit stocks broadly, including emerging markets.
Finom Group largely agrees with Stockton’s analysis and has suggested such a pullback, within a 5-7% range, would be healthy for markets and the notion of market symmetry. Others believe a pullback has a more strategic and macro implication that centers on the FOMC.
Krishna Memani, chief investment officer at Oppenheimer Funds, told “Squawk Box” on Thursday that a “short” pullback could keep the “Fed at bay.” He added, “If the market just keeps going up, then it brings the Fed back into play. We don’t really want that.”
With the Fed reversing course and most central banks around the world on the sidelines for now, given the threat of a more severe global economic slowdown, it’s suggested that risk assets find greater favor. While this is historically proven an accurate assumption, earnings will ultimately lead markets over time. With earnings expected to range between positive and negative 1% for the Q1 2019 period, equity markets are likely to take their cues from headlines and longer-term historic valuation metrics for the time being.
The market was perceived to be too cheap at its December trough period with a forward 12-month P/E of 14 and now may appear too expensive or at least fairly valued with a P/E of 16 and given S&P 500 earnings estimates. Hence, the propensity for the market to pause and possibly pullback until either certain of the macro issues are resolved or the economic data points to improving growth. Speaking more specifically to U.S. economic growth or GDP, we don’t have Q4 GDP results yet, due to the past government shutdown. What we do have is the Federal Reserve Bank of Atlanta GDPNow tracking and forecast.
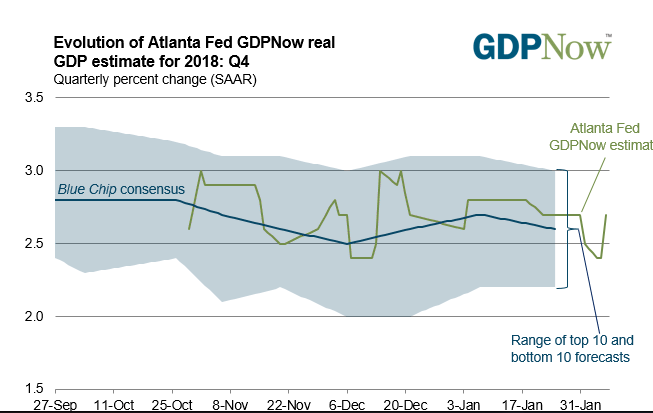
The GDPNow model estimate for real GDP growth (seasonally adjusted annual rate) in the fourth quarter of 2018 is 2.7% on February 6, up from 2.5% on February 1. The nowcast of the contribution of net exports to fourth-quarter real GDP growth increased from -0.52 percentage points to -0.23 percentage points after the latest international trade report from the U.S. Census Bureau and the U.S. Bureau of Economic Analysis.
When combined with the latest round of Initial Jobless Claims and the previous week’s Nonfarm Payroll report, it would appear as though the U.S. economy is on sound footing. This being stated, that does not preclude the notion of a natural slowing of economic growth in 2019 and post the large tax reform, stimulus to the economy in 2018. But how much slowing growth will the U.S. economy express remains a hot topic of debate and reason enough for concern amongst investors, given the longevity of the economic expansion cycle.
As we wrap up our Daily Market Dispatch we’ll take an overview of the market going into the final trading day of the week. Our market theme and/or focus for 2019 continues to center on the acronym E-F-G or Earnings, FOMC, Global Trade. We remain of the opinion all 3 contingents will prove a tailwind for the S&P 500 in 2019 and largely resolve favorably going into 2020, before… well that’s a tune for another tale.
For now the immediacy of market moves seem to be reflexive as correlations come into focus. We’ve mentioned periodically that the U.S. Dollar strength would either provide support for equities or prove an impediment. With nearly 40% of S&P 500 revenues coming from overseas, the strong USD has been bearish for equities, pressuring revenues and earnings. The FOMC moving into a dovish, more accommodative stance should put pressure on the USD longer-term, but that hasn’t born fruit just yet.

A little more than a week ago, the FOMC surprised markets with an even more dovish than expected policy announcement. One would normally expect the USD to sell-off following a more dovish than expected FOMC, and it did. Unfortunately, that sell-off has quickly reversed. In fact, post the day of the FOMC meeting announcement, the USD has been higher every single day and is now well above levels it was trading at before last week’s FOMC meeting.
One of the main reasons for the USD strength since the FOMC meeting can be associated with the concerns coming out of the European Union coupled with a still unresolved Brexit. Of course, we can also fashion the ever-present U.S./China trade negotiations being called into question to the USD strength. In short, the USD remains a safe haven according to investors and this has finally seemed to proven an impediment to the S&P 500 advancing.
The other correlation we tend to look at when it comes to the S&P 500 directional move is Crude Oil. As shown in the chart below, the two have a very distinct directional correlation. Since peaking recently around $55 a barrel, Crude Oil has since retraced some of its monthly gains.
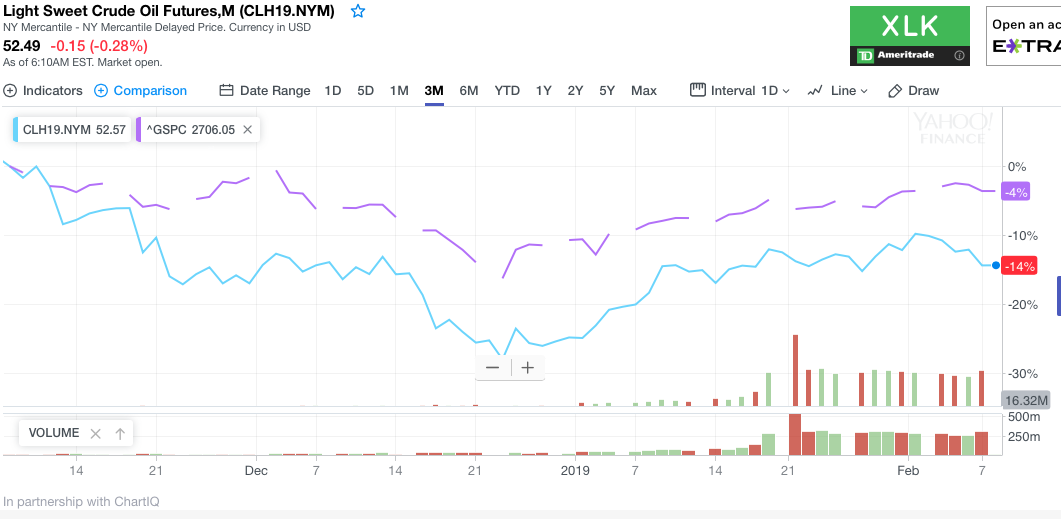
Taking the USD strength in combination with the retracement in Crude Oil and all the aforementioned breadth and technical measures of the S&P 500, we think the index is set up nicely for a near-term pullback. That being said, time will tell. More importantly, are you positioned for either outcome over the next 30 days?
Subscribe today to our receive Finom Group’s Weekly Research Report, Daily/Weekly Trade Alerts and our State of the Market weekly video with Seth and Wayne.


