
The major indices soared yesterday by more than 2%, with little intraday pullback. It was a slow but steady climb post the closing of European markets. It appears as though the S&P 500 200 DMA did indeed prove to be supportive as the index narrowly held above the moving average last Friday. Any number of reasons could explain the rebound in equities yesterday, but in an era of electronic and algorithmic trading, the 200 DMA was likely the “line in the sand” type of support that spurred a rally. This is the second time that the S&P 500 tested the 200-day in the sell-off that began in late January. The S&P 500 bounced off its 200-day moving average on Feb. 12, after hitting lows on Feb. 9, 2018. But it will be key to see if the S&P 500 holds above the 200-day moving average, which is now at 2,586. The markets remain in an uptrend, but the coming trading sessions will define as to whether or not the 200 DMA proves worthy of yesterday’s rally. Jeff Saut, chief investment strategist at Raymond James, said he thinks the sell off is over.
“The correction is over, “unless you get hit with some exogenous news,” said Saut. He said fears of a trade war were over blown.
Saut said he expects that stocks have formed a “W-shaped” bottom similar to the one in the last major correction in late 2015 and early 2016, where the market hit a low in September and then another in February 2016.”
With trade war fears subsiding and the U.S. equity markets in rally mode, Asian markets followed suit with a strong showing overnight. European markets are also following the march higher in equities. Trade war fears were believed to be the catalyst that pressured equities all last week, but the tide may be changing if that is the causation. According to Reuters, China’s Premier Li Keqiang told a conference Monday that both the U.S. and China should continue talks, with Keqiang pledging to maintain open markets, in the hope of preventing a potential trade war.
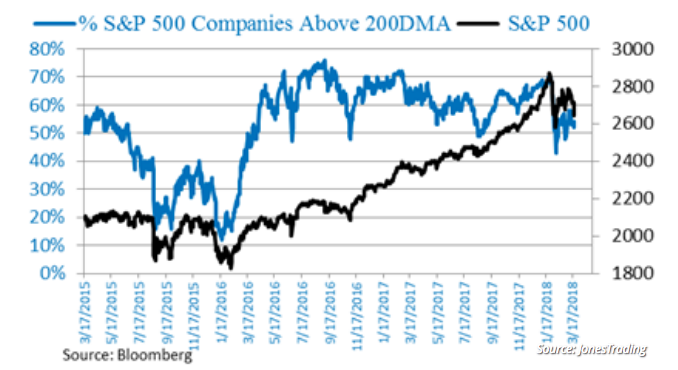
Reverting to the technical outlook, the picture isn’t pretty. Technical damage has occurred to the S&P 500 according to data from Michael O’Rourke, chief market strategist at JonesTrading. He explains that about 50% of the S&P 500 components were trading above their 200-day moving averages, with a break below indicating “notable technical damage has been done to this market. See the chart below.
While technical damage may have occurred recently to the benchmark index, another concern surrounding yesterday’s surging markets surfaced. The concern was in the bond market, which tends to move inversely to equities. The 10-year Treasury bond saw very, very tame action during yesterday’s substantial move in equity prices. Even today, the 10-year is barely budging. Below is a chart of the current yield for the treasury market.

The concern over a lack of movement in the bond market yesterday and over the last couple of weeks, as the 10-year bond yield has stayed in the 2.80s range, may be a bit overblown. What may prove to move bond yields is the upcoming Personal Consumption and Expenditure data due out this Thursday. This piece of economic data is the most relevant metric for the Fed as it forecasts inflation and primes for rate hikes in any given year. Core inflation is expected to tick up .2% with income rising .4% and spending rising 2% month-over-month. Today’s economic data calendar is limited to the S&P Case-Shiller House Price Index followed by consumer confidence at 10 a.m. ET, along with the Richmond Fed survey of manufacturing activity. Earnings from Lululemon Athletica, FactSet and Sonic are all expected to be announced today. On the central banking front, Atlanta Fed President Raphael Bostic is due to speak at the HOPE Global Forum annual meeting in Atlanta.
Whether it’s the technicals, the economic data of the day or trade tariff proclamations; the VIX is telling investors and traders that the market has not stabilized since the February 9, 2018 lows. At present, the VIX is above its historic 19 median average reading, signaling moves of greater than 1% daily in the S&P 500 index. Furthermore, as indicated in the chart below, VIX term structure remains in a state of backwardation.
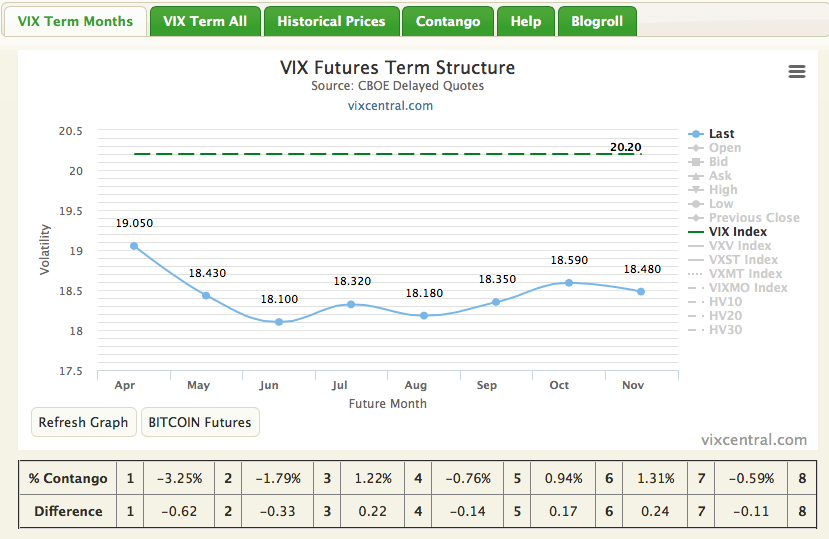
This has been the longest sustained period of backwardation for term structure since 2015. Until the VIX relaxes below 16 and for more than a couple of weeks, and until the S&P 500 captures the 50 DMA and holds above it for more than a couple of weeks investors and traders would be wise to maintain active portfolio management.


