
Welcome to this week’s State of the Markets with Wayne Nelson and Seth Golden. Please click the following link to review the SOTM video. We are in the midst of a full-blown, melt-up, Santa Claus rally into year-end and now within 19 S&P 500 points of achieving a 30% gain in 2019. We discuss the probabilities of a market pullback near-term, in 2020, as extreme breadth, sentiment and distance from the 50-DMA the S&P 500 currently resides. Economic data looks healthy and doesn’t suggest the yield curve inversion from earlier in 2019 points to a recession over the next year.
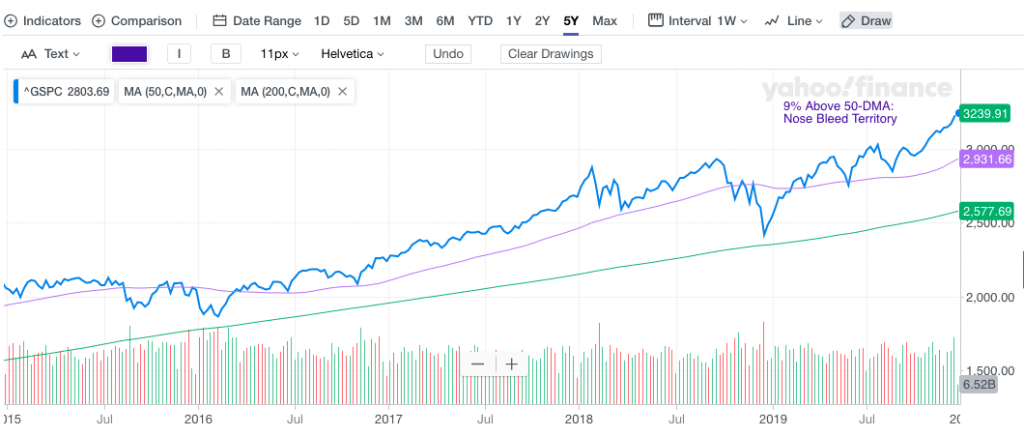
- S&P 500 is currently 9% above its 50-DMA.
- Has not been this much above 50-DMA since 1/22/2018.
- Very overbought, but that doesn’t mean go out and sell stocks.
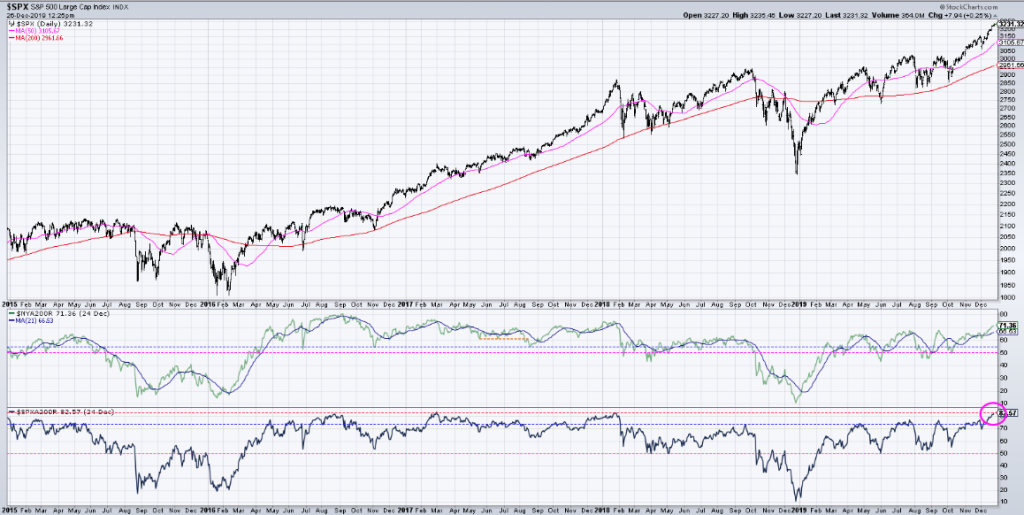
- Almost 83% of S&P 500 stocks above their 200-day moving average, and that is in line with readings at previous short-term tops.
- NYSE all-issue breadth was positive today for the 16th consecutive day. In the almost exactly 50 years of data, there was only one longer string of up days , 19 in January 1985.
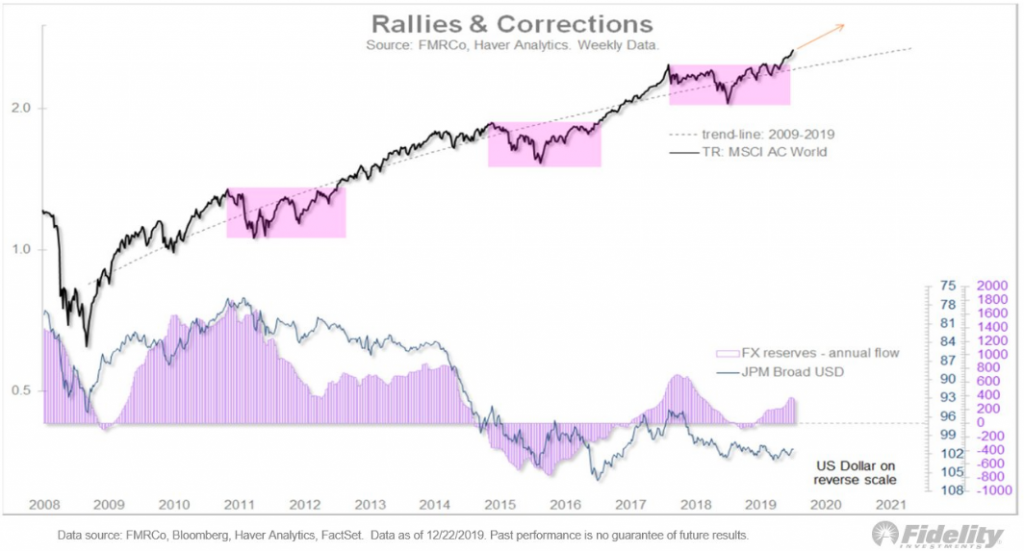
- Jurrien Timmer of Fidelity: “The melt-up in risk assets that many suspected could happen after 2019’s potent combo of strong gains, bearish sentiment and disappearing liquidity at year end—which is typical—is happening in what is turning out to be a mirror image of last year’s Q4 swoon.“
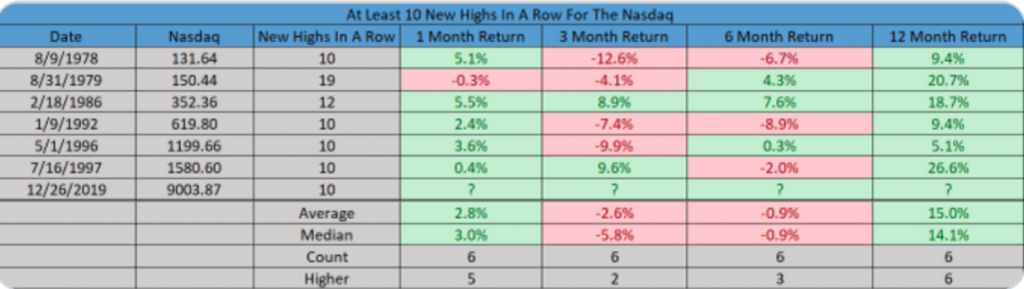
- The Nasdaq closed at 10 consecutive new highs on Dec. 26. This is quite rare and returns 6 months out can see modest weakness.
- A year later it has been higher every single time (6 for 6).
- Nasdaq hit 9,000 and closed above it on Dec. 26th for the first time ever.
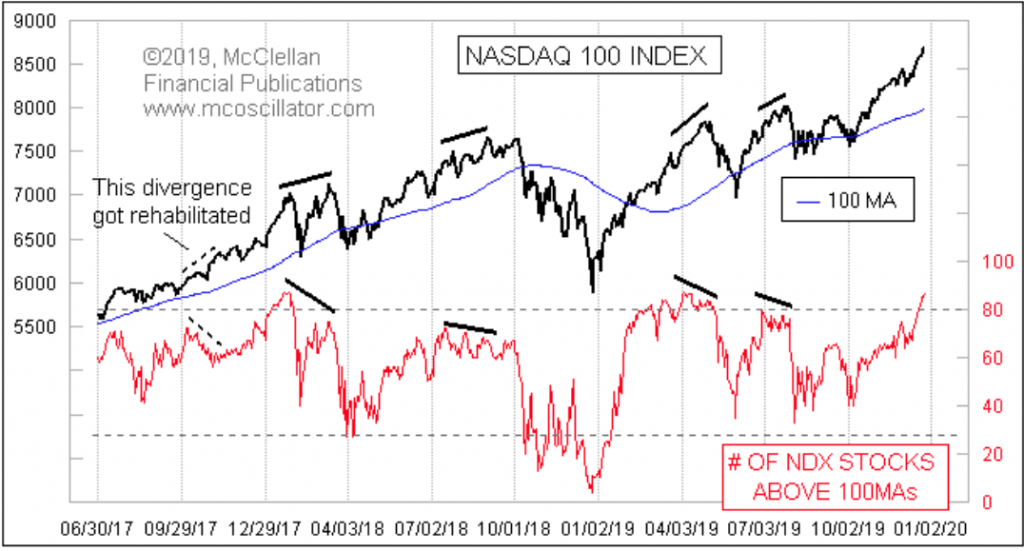
- Important price tops usually arrive with a divergence in this indicator, which is not yet evident: Nasdaq 100-DMA/# of NDX stocks trading above their 100-DMA. (See chart below)
- The overbought condition can bring a minor top anytime, but not a bull market ender (unless it’s different this time).
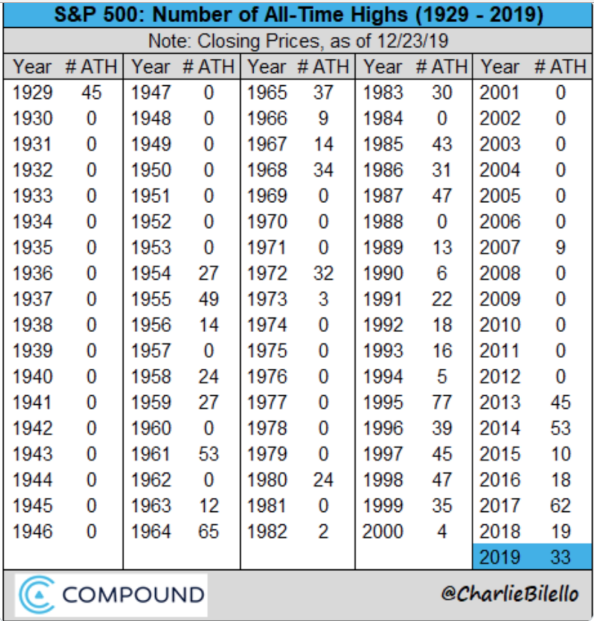
- The number of all-time highs for each calendar year dating back to 1929 is below.
- There are years with zero new highs, just be aware.
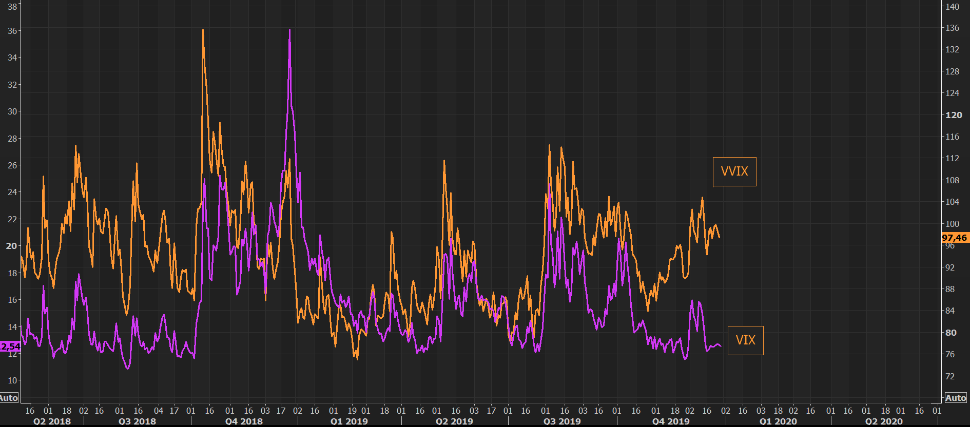
- VIX has remained stubbornly, without additional decay as SPX moves higher.
- VVIX remains elevated, in and around 100.
- SKEW also remains near all-time highs and in the 140 range.
- “I’m not going to spin my wheels dissecting such an illiquid and ‘noisy’ year-end market”, Nomura’s Charlie McElligott said, in a Friday note.
- Nomura’s SPX sentiment indicator “shows enormous percentile reversals across all factor inputs” from the doldrums of December 2018.
- Backtest shows that when the bank’s sentiment index is in the 89th percentile, the median return for the S&P over the next 12 months is 11.5%
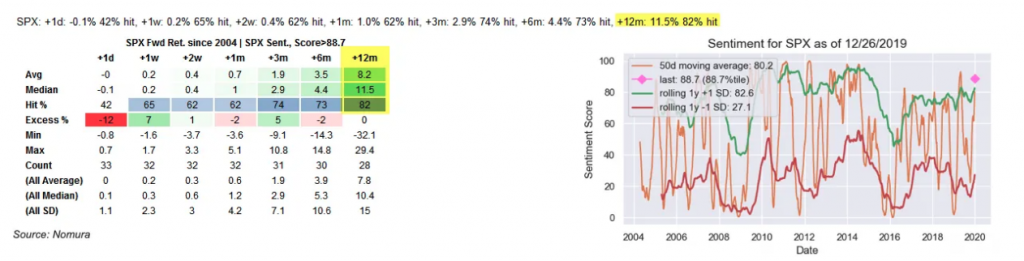
- “A macro-view that the sudden narrative “paradigm- shift” back-into a world of higher growth and reflation-like thematic position for 2020 has likely “over-shot” and that in 2020, I actually expect US Rates / USTs to hold firm and NOT sell-off as many are anticipating.“

- Super Saturday” (a couple of days ago) was largest U.S. shopping day ever.
- Shoppers shelled out $34.4b, slightly above Black Friday’s $31.2b
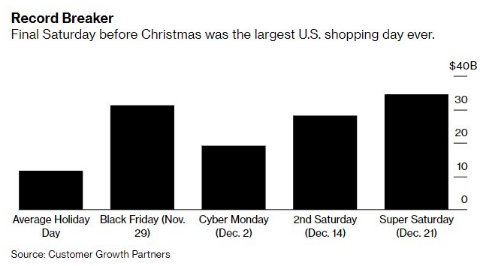
- The next biggest day was December 14th which had $28.1 billion; finally, there was Cyber Monday which had $19.1 billion in sales. 58% of sales growth came from online sales.
- According to Mastercard SpendingPulse, total U.S. retail sales from November 1st to Christmas Eve were up 3.4% compared to 2018. Online sales were up 18.8% and brick and mortar sales were up 1.2%. Online had a 14.6% share of total sales.
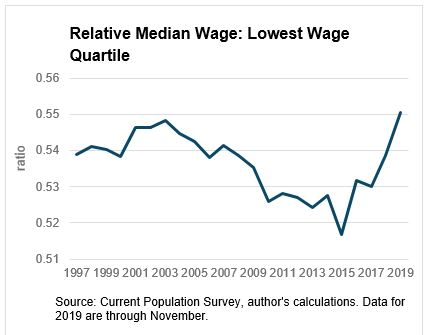
- Wage growth has improved for nonsupervisory and production employees.
- As you can see from the chart below, the ratio of the lowest quartile to the median wage is above 0.55 which is the highest since at least 1997. Low income workers are doing very well.
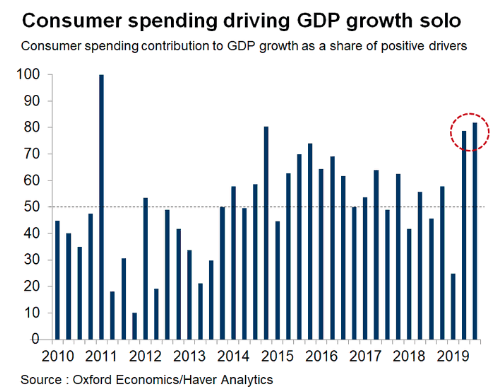
- Latest U.S. GDP report shows an even stronger contribution from U.S. consumer spending to GDP growth in Q3.
- As you can see from the chart below, Q2 and Q3 consumer spending’s contribution to GDP growth was close to 80% of the share of positive drivers.
- Not since the Great Recession has so much weight rested on the consumers shoulders. Be careful what you wish for as manufacturing is less and less a part of the U.S. GDP contribution.
- November’s PCE report showed better than anticipated income growth with below expectations consumer spending. This was largely due to the Thanksgiving calendar pushing the holiday out nearly a week from the previous year.
- This also resulted in the savings rate ticking up from 7.8 to 7.9
- Monthly real personal income growth was 0.5%, which beat estimates for 0.3%. The October reading was revised up one tick to 0.1%.
- As you can see from the chart below, yearly real disposable income growth improved from 2.88% to 3.12%.
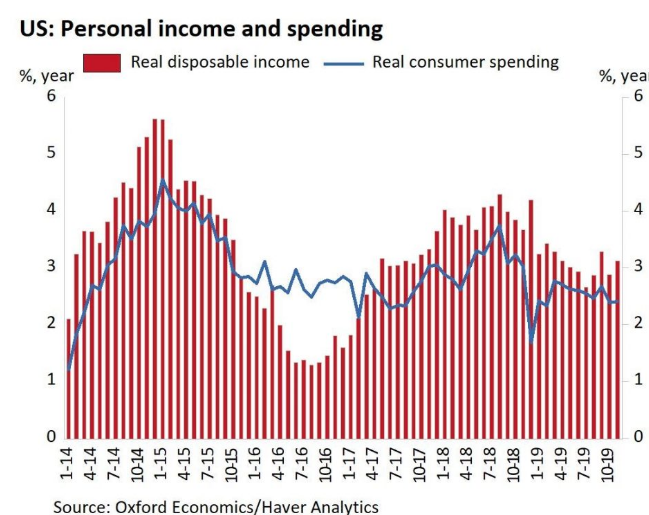
- Overall real personal income growth was a bit stronger as it increased from 3.04% to 3.34% which was the highest growth since February. The 2 year stack was up 6 basis points.
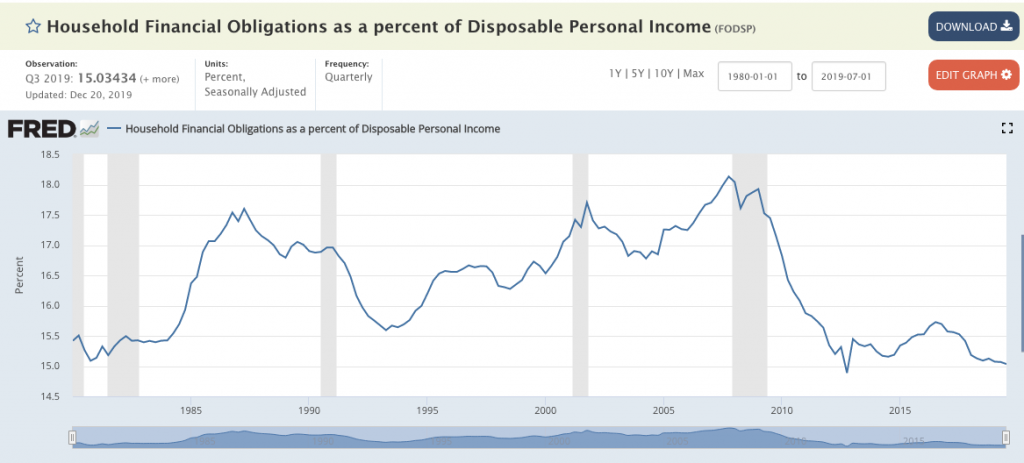
- Wages are rising, job growth/creation is steady and household balance sheets are the strongest they have been since the 1960s, so what could cause a recession as the yield curve inverting doesn’t seem to be the all-mighty signal it once was feared to be?
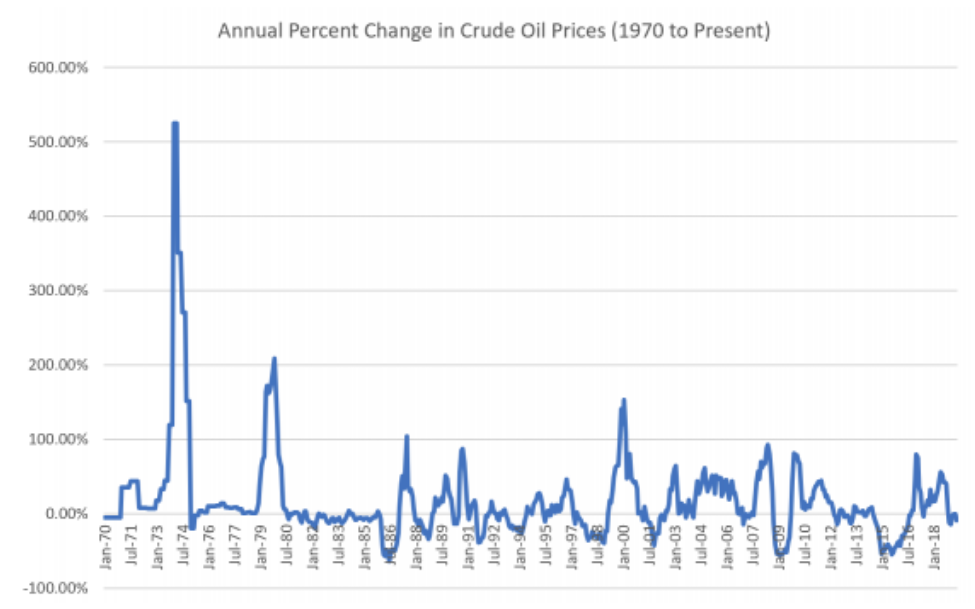
The U.S. has NEVER seen a recession (back to 1970) w/out oil prices 1st rising by +90% over a year.
- March 1974: +525%, from $2.08/barrel in the same month the prior year to $13.00/barrel
- November 1979: +209%, from $13.20/barrel to $40.75/barrel
- August 1987: +104%, from $9.62/barrel to $19.62/barrel
- October 1990: +87%, from $18.42/barrel to $34.50/barrel
- February 2000: +153%, from $10.75/barrel to $27.22/barrel
- June 2008: +93%, from $68.18/barrel to $131.52/barrel


