Welcome to this week’s State of the Markets. Please click the following link to review the SOTM video. Our emphasis in this week’s SOTM video concerns the latest FOMC rate cut announcement and what we might expect from the economy and market going forward. We look at certain analogues and past examples of rate easing cycles. Additionally, we discuss some of the more recent economic data surrounding the housing sector, which has proven to surpass economists’ expectations. Lastly, we wrap things up with a discussion on the VIX and volatility.
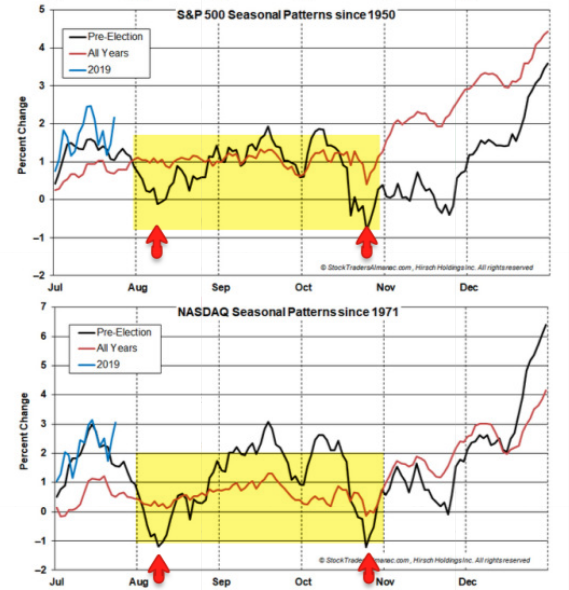
- Recall from last week’s Research Report the following: “If the seasonal patterns hold, there is an upward bias into mid-September for stocks, then a 2nd dump into October. The market is keeping equity investors on their toes in 2019 for sure. (From @AlmanacTrader)”
- Since 1950, September has been the worst month for the S&P 500 Index, which has dropped an average about 0.5% during the month. September’s track record has been a little better recently though: Over the past 10 years, the S&P 500 has averaged a 0.9% gain in September.
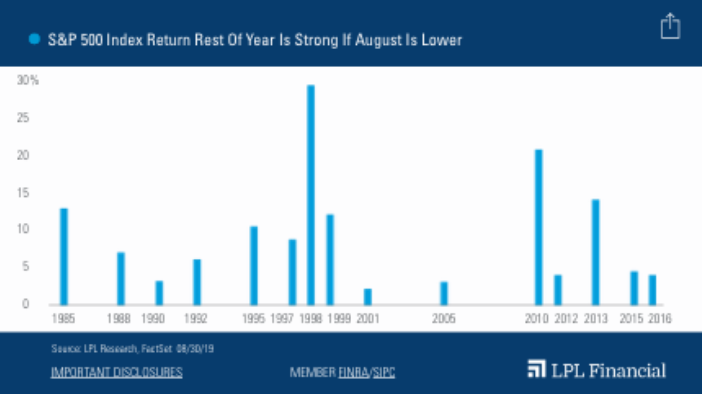
- “August was a burst of volatility for most investors, and we expect that to continue in September,” explained LPL Financial Senior Market Strategist Ryan Detrick. “But if you’re looking for some good news, the past 15 times stocks were lower in August, the rest of the year was actually higher every single time.”
- U.S. home sales unexpectedly rose to a 17-month high in August for a second straight month of gains, the latest sign that lower mortgage rates are encouraging buyers off the sidelines.
- The National Association of Realtors said on Thursday existing home sales increased 1.3% to a seasonally adjusted annual rate of 5.49 million units last month. July’s sales pace was unchanged at 5.42 million units.
- Economists polled by Reuters had forecast existing home sales declining 0.4% to 5.37 million units. Existing home sales make up about 90 percent of U.S. home sales.
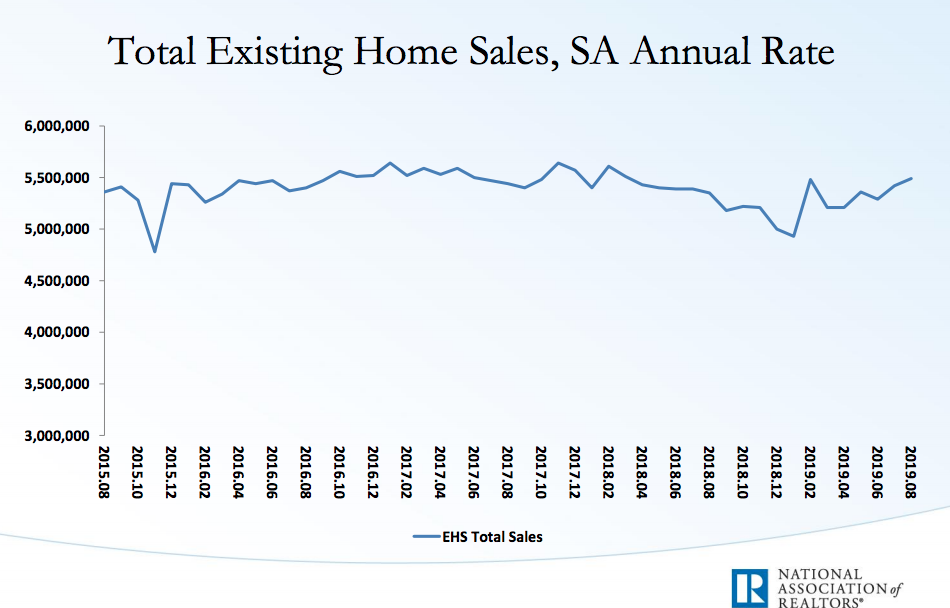
- Existing home sales were up 2.6% year-over-year (YoY) in August. This was the second consecutive YoY increase, following 16 consecutive months with a YoY decrease in sales.
- Inventory is still low, and was down 2.6% year-over-year (YoY) in August.
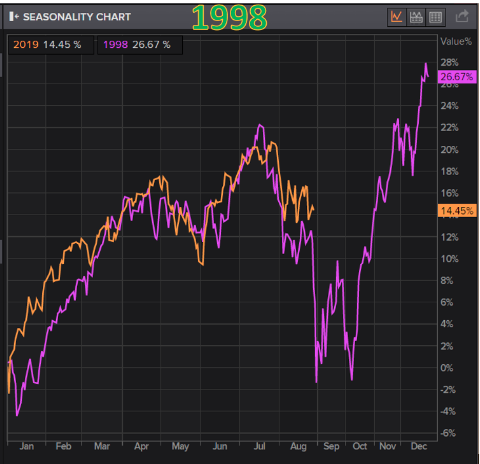
- Analogues don’t always prove to play out
- Based on the 1998 analogue above, the timing of rate cuts seemingly distinguished the 1998 period into September from 2019.
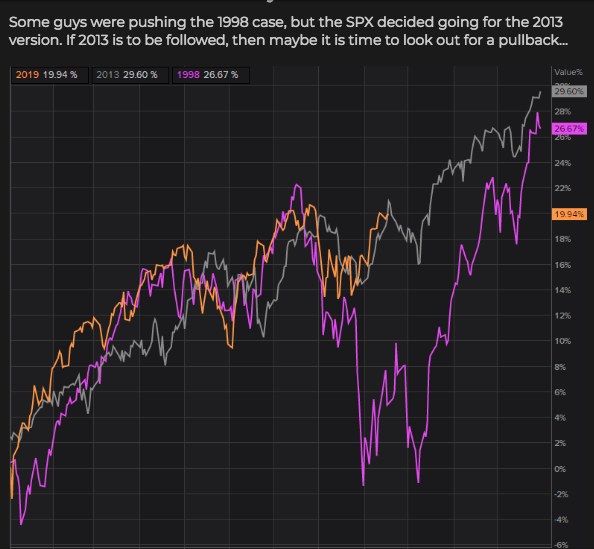
- There are some who are now assuming 2019 will look more like 2013. Only time will tell.
- Don’t be fooled into thinking the run in certain retail stocks over the last 2 weeks signals a shift in fundamental performance.
- KSS, M, BBBY and others have already rallied significantly in the first couple of weeks in September as sector rotation took hold.
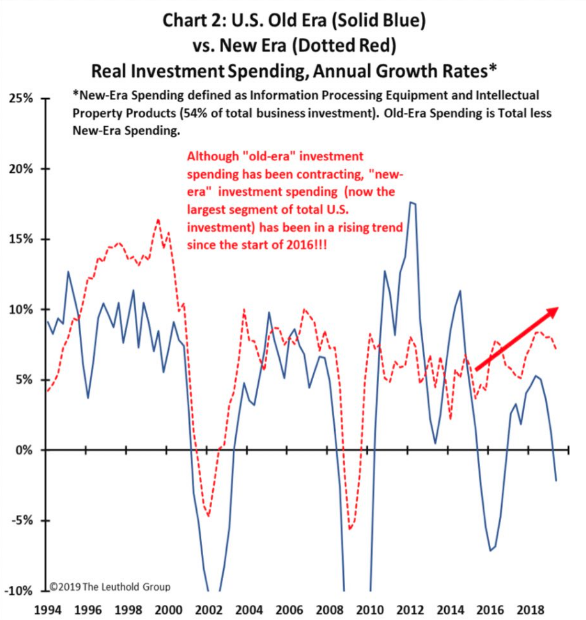
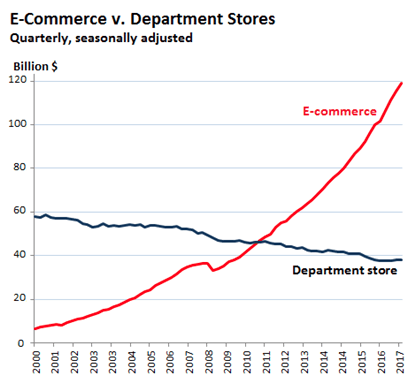
- The economy has shifted since the turn of the century. The chart above identifies the shift in spending by corporations which focuses on Information Processing Equipment versus prior periods where capital expenditures were aligned with hardware equipment, machinery and tooling.
- The Dow Jones Transport (DJT) had been a leading economic indictor, but the Semiconductor sector (SMH) may have taken over as chips are in most every computing and communication device.
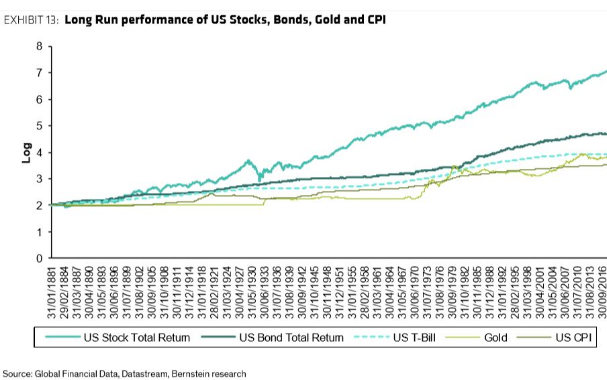
- As a long-term investor, you’re taught to ignore the daily grind, eyes on the prize! Backing that up, our call of the day from Bernstein Research says 10 years from now, you’ll still be better off in equities.
- Bernstein strategists, Inigo Fraser-Jenkins and Alla Harmsworth argued respective cases for the S&P 500 to reach 4,000 and 8,000 over that time frame. Where they agree is on this bottom line: even if the index is not going to keep rising at the pace it has over the last 40 years, equities are still the best asset class to beat inflation.
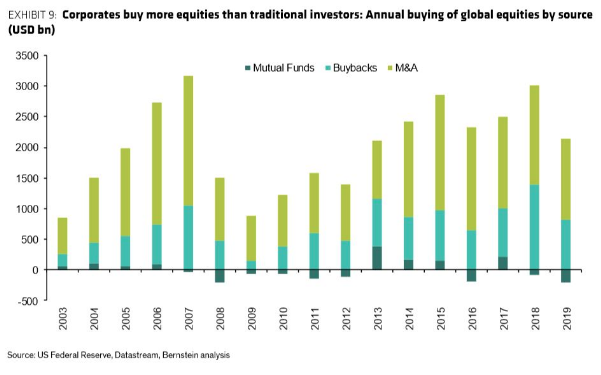
- Even if households don’t keep buying stocks, there’s plenty of proof companies will keep buying back their own shares, with some $820 billion announced this year alone, said Harmsworth. Microsoft and Target each just dropped news on this front.
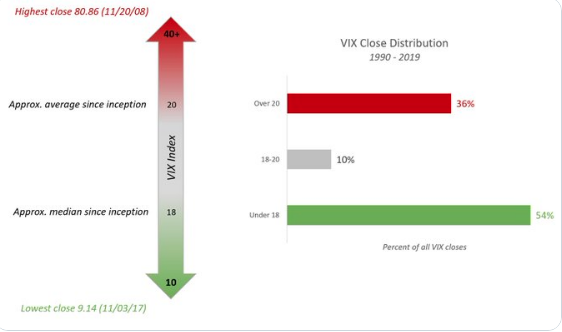
- The VIX isn’t mean reverting (~19.7) but rather mode reverting (~12.4). Big VIX spikes drag the mean up but the majority of the time the VIX is well below 15.