
Welcome to another trading week!! In appreciation of all of our Basic Membership level participants and daily readers of finomgroup.com content, we offer the following excerpts from our Weekly Research Report. Our weekly Report is extremely detailed and has proven to help guide investors and traders during all types of market conditions with thoughtful insights and analysis, graphs, studies, and historical data/analogues. We encourage our readers to upgrade to our Contributor Membership level ($7.99 monthly, cancel any time) to receive our Weekly Research Report and State of the Market Videos and take advantage of this ongoing promotional event today! Have a great trading week, be in touch, and take a look at some of the materials in this weekend’s published Research Report!
Research Report Excerpts #1
Making capital allocation decisions based on a valuation theory coming out of a bear market and recession tends to be a very poor idea.
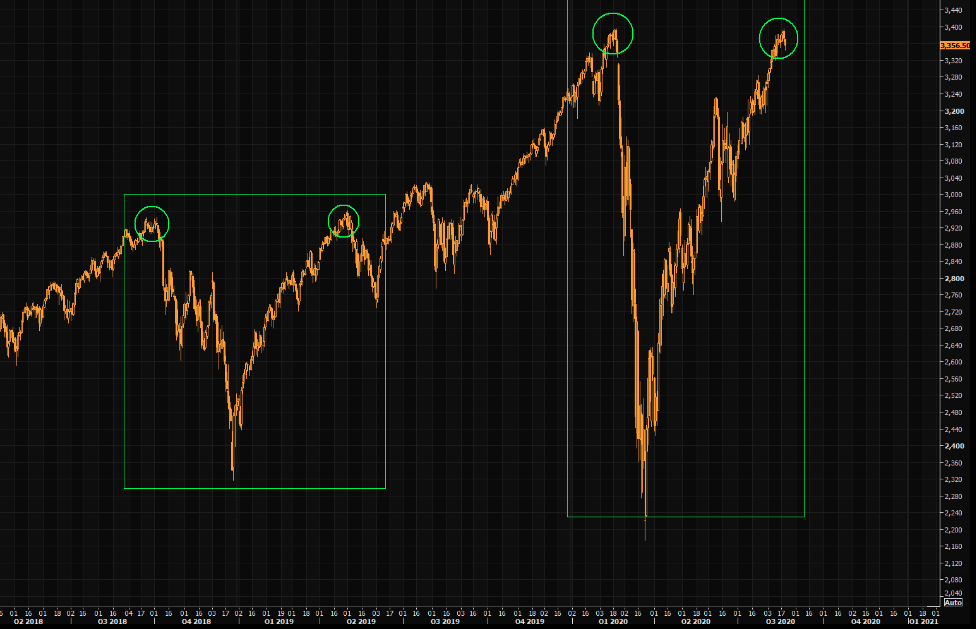
The chart of the S&P 500 “double-tops” from 2018 and here in 2020 looks rather enticing. The former double-top led to a brief pullback in May of 2019, but then significant gains through the remainder of the year and into the 2020 calendar year. So while the term double-top tends to evoke fear, there are actual multiple points in the chart above that denote they have been resolved with higher prices thereafter the double-top is achieved. In other words, new highs shouldn’t be added as an “issue” that has to be dealt with. Instead, they usurp many of the other concerns that underscore investor sentiment. New highs are a good thing, not a bad thing!
Research Report Excerpts #2
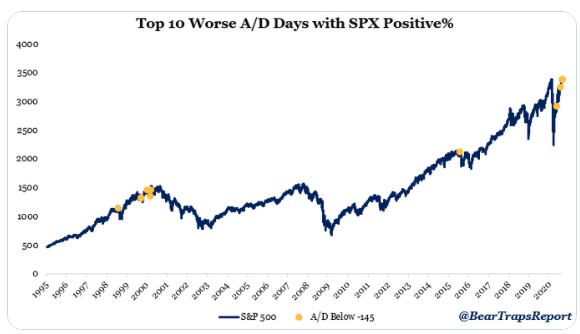
- Since 1995, here is the top 10 worst advance-decline days when the S&P 500 still closed positive. Thursday was the 3rd lowest decline with -193 and Tuesday was the 7th.
Friday of this past trading week proved another weak performance in terms of advancers vs. decliners on both the Nasdaq and the NYSE (NYA). The chart below is a snapshot of the end of day tally for both indices and stresses the potential for a near-term market top, as breadth is weakening below the surface.
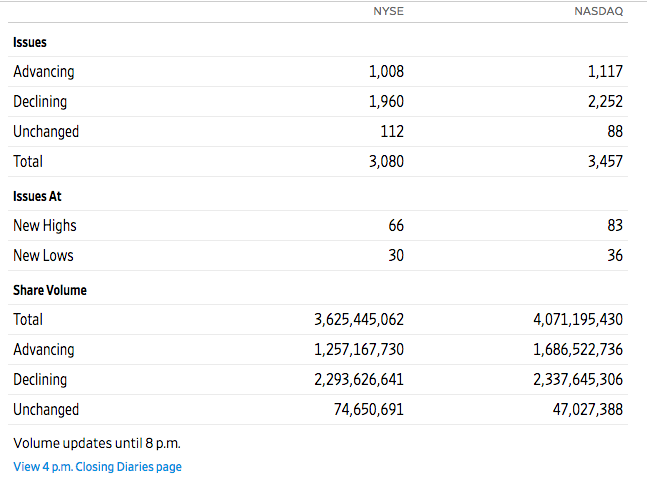
As we can see from the table above, both indices had roughly a ~2:1 ratio in favor of declining stocks vs. advancing stocks. This happened Friday even as all major indices rallied on the day and with the Nasdaq and S&P 500 hitting record level highs. As a reminder, breadth is very fickle and can change from one week to the next. We’ve seen that happen throughout the entirety of the new bull market trend and since April. Monitor. Evaluate. Game Plan.
Research Report Excerpts #3
While we’ve focused a good deal on breadth indicators for the S&P 500, least we not forget the A/D lines for the NYSE and Nasdaq were both weak for the majority of the trading week. As such, let’s look at the more rapid breadth reading of stocks trading above their 50-DMA for the Nasdaq before closing out our technical reporting:
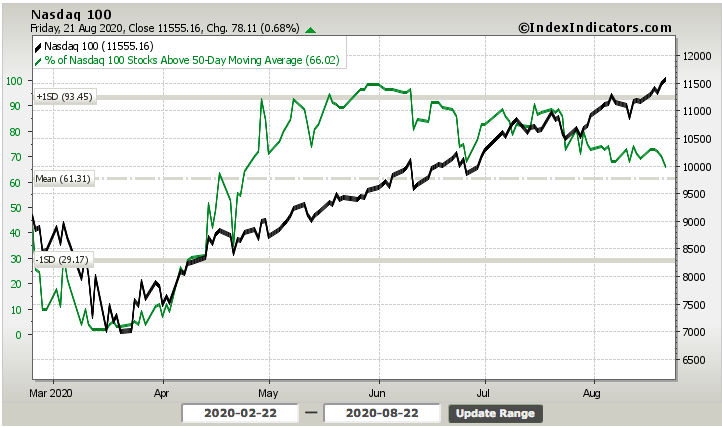
This is actually more concerning than what I see taking place in the S&P 500 breadth measures. Why? It’s thought that if Technology and the NASDAQ lead markets up in a concentrated manner, then it’s more important than ever to watch for when these start to fail, as they will likely start to lead us lower, S&P 500 and all. Highly concentrated markets are your friend when the markets are going up, and the enemy when markets are faltering it seems.
Research Report Excerpts #4
The Mortgage Bankers Association’s (MBA) latest Forbearance and Call Volume Survey revealed that the total number of loans now in forbearance decreased by 23 basis points from 7.44% of servicers’ portfolio volume in the prior week to 7.21% as of August 9, 2020. According to MBA’s estimate, 3.6 million homeowners are in forbearance plans.
“More homeowners exited forbearance last week, leading to the ninth straight drop in the share of loans in forbearance. However, the decline in Ginnie Mae loans in forbearance was again because of buyouts of delinquent loans from Ginnie Mae pools, which result in these FHA and VA loans being reported in the portfolio category,” said Mike Fratantoni, MBA’s Senior Vice President and Chief Economist. “In a sign that more FHA and VA borrowers are struggling with a very tough job market, more Ginnie Mae borrowers requested than exited forbearance.”
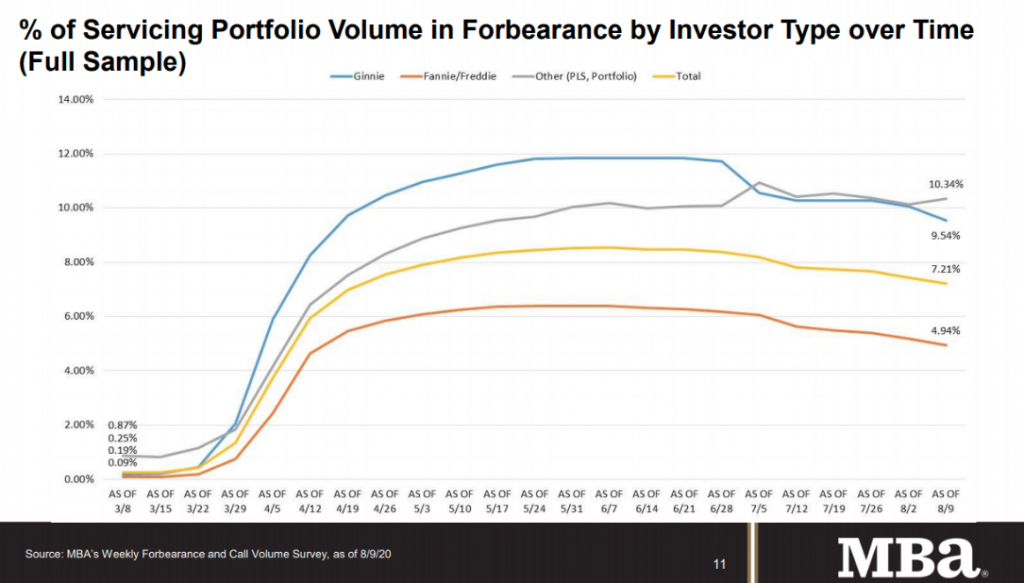
The big, positive takeaway from the housing data thus far is that there hasn’t been a pickup in forbearance activity related to the end of the extra unemployment benefits, which expired on July 31, 2020.
Research Report Excerpts #5
The U.S. weekly hotel occupancy hit 50.0% for the first time since mid-March, according to the latest data from STR.
- Occupancy: 50.2% (-30.0%)
- Average daily rate (ADR): US$101.41 (-23.0%)
- Revenue per available room (RevPAR): US$50.87 (-46.1%)
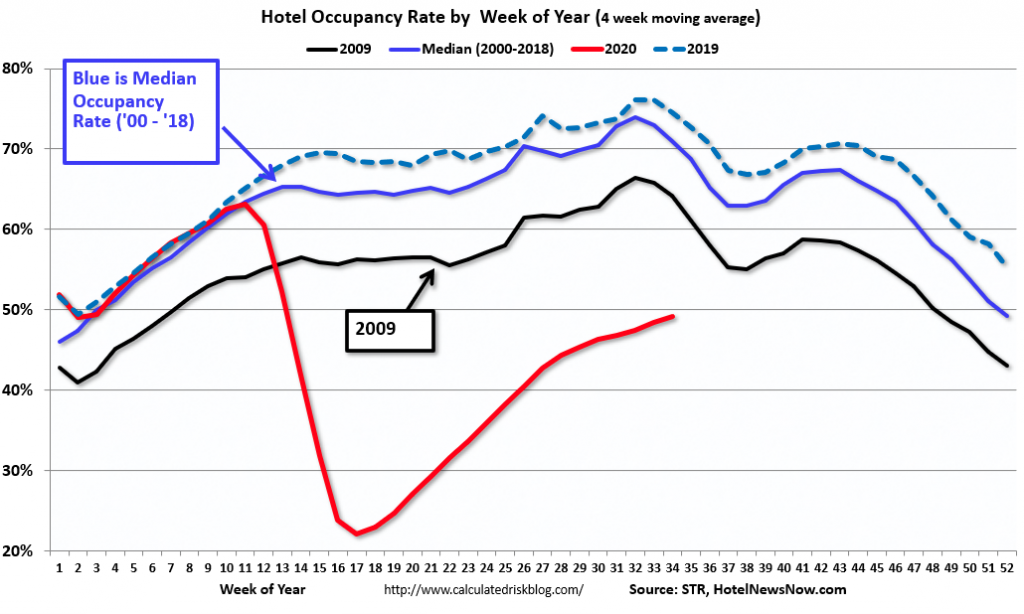
U.S. occupancy has risen week over week for 17 of the last 18 weeks, although growth in demand (room nights sold) has slowed. The week ending 14 March was the last with occupancy of at least 50.0 percent.
Research Report Excerpts #6
Take notice of the estimates, and the lower level orange line representing Q2 2020 EPS. Now let’s look at the latest WoW change below:
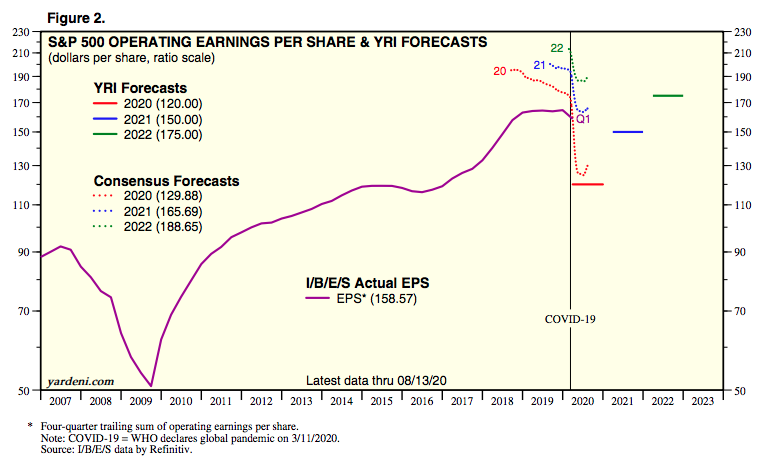
- The FY2020 EPS consensus estimate has improved from $124.79 in the previous week to $129.88 as of this past week.
- What if Q3 EPS estimates prove too low?
- Will we see another $5 increase in the FY2020 EPS consensus estimates?
- Is that why the markets continue to climb?
For 2021, we also see a positive revision from $163.61 to $165.69 a share. Like the economic data from recent weeks, the market has been front-running better than anticipated earnings.
Research Report Excerpts #7
It’s always a good idea to know what the analysts and strategists are thinking and what their price target objectives are, but it’s equally a bad idea to allow such considerations to guide your capital investing plans.
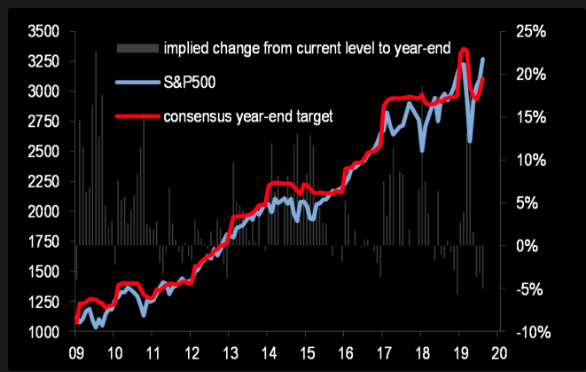
Based on consensus year-end price targets (chart above), the S&P 500 would need to decline by 5% into year-end to align with the consensus price target. That’s basically how “behind the curve” the analyst community has been. But more recently we’ve seen price target revisions to the upside from the likes of Canaccord Genuity’s Tony Dwyer, FundStrat’s Tom Lee and even Goldman Sachs’ David Kostin.
Research Report Excerpts #8
Here are some interesting statistics about partisan control of the White House and Congress from Dan Clifton of Strategas Research Partners:
- Since 1933, the highest returning partisan control combination for the S&P 500 has been a Democratic Senate, Republican House, and Democratic President where returns averaged 13.6% per year. In 2020, this would require a reversal for all three.
- Our current mix of Republican Senate, Democratic House, and Republican President averages a 10.8% return. This combination is likely if President Trump wins reelection.
- Under a Biden victory, the likely scenario is a Republican Senate, Democratic House and (of course) a Democratic President. Interestingly, this combination has not occurred since Grover Cleveland in the election of 1886! But if it does occur…
As shown in the LPL Chart below, the S&P 500 Index has been higher 9 of the past 10 times and 15 of the past 18 times Democrats controlled both the White House and Congress.

Thank you for joining us for another trading week and reviewing our weekly “Must Knows”! To receive and review our weekly, full-scale Research Report each Sunday and our State of the Markets weekly video analysis every Thursday, subscribe to our Contributor Membership level at just $7.99 monthly (Cancel any time)! With these two weekly deliveries, you’ll have all the unbiased and fact-driven market and economic data analysis at your fingertips. Don’t make capital allocation decisions based on headlines that brush the surface of what is and isn’t affecting markets. Let our deep-dive analytics supply you with bottom-up and top-down analytics. You won’t be disappointed. Upgrade today!!


