
The investing landscape couldn’t be any better for investors than it has proven to be in 2022. Now, before you stop reading for fear of lunacy of the author, let me explain. One of the foremost principles of investing is to “buy low and sell high”. In other words, value is the friend of the savvy investor, and the stock market is delivering its deepest value for investors since the 2020 Pandemic Crash with a greater than 20% bear market. Aside from value, the only other better friend of an investor is time. With value and time most greatly considered, if the two are in greater abundance then the investing landscape is most ideal in 2022.
While the aforementioned may not bring a whole lot of solace to the average investor who is experiencing a drawdown equal or greater to that of the major indices, the task at hand is to move from recognizing that bull markets are built on the back of bear markets.
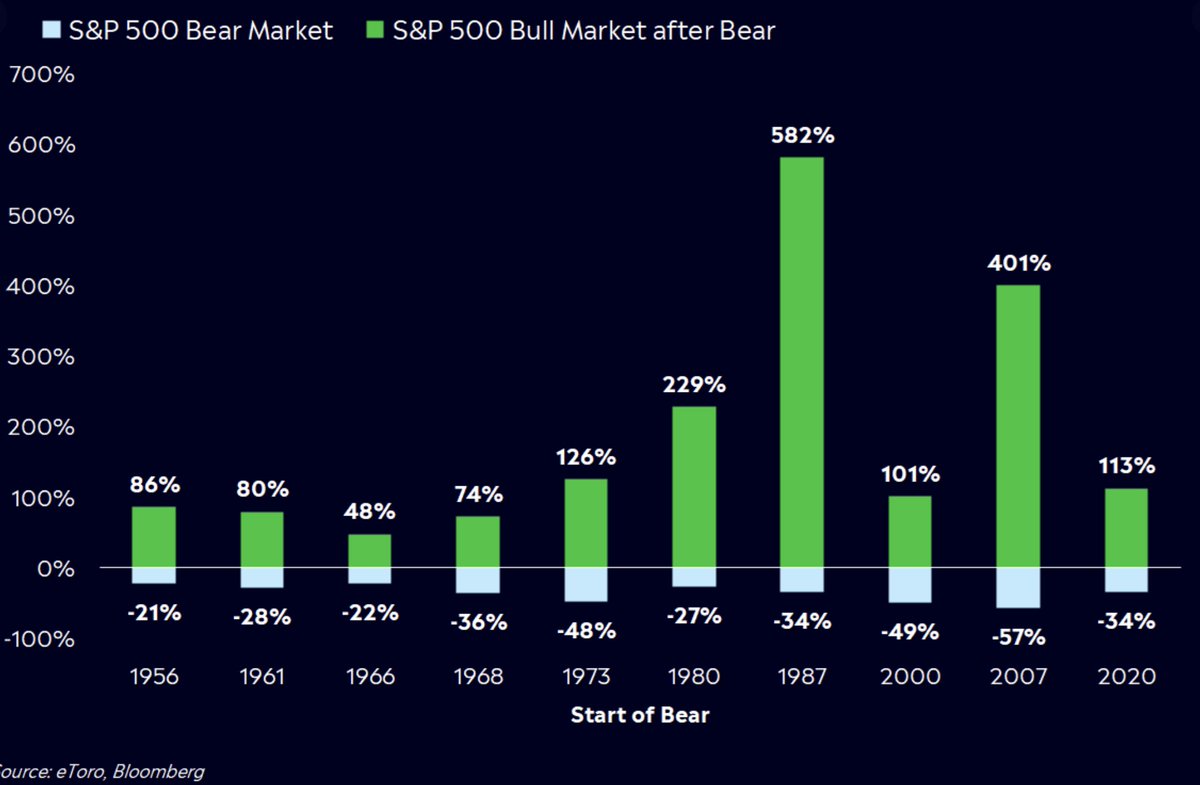
Since 1929, there have been 15 selloffs of greater than 20% in the S&P500: (Michael Antonelli)
- 1 in the 1930s
- 1 in the 1950s
- 3 in the 1960s
- 1 in the 1970s
- 2 in the 1980s
- 2 in the 1990s
- 2 in the 2000s
- 1 in the 2010s
- 2 in the 2020s… so far
The one thing these corrections and/or bear markets have in common is that they all led to substantial, positive returns for savvy investors. It was much more difficult to extrapolate the positive returns prior to the era of Exchange Traded Funds, of course. But since the invent of such structured products, investors have not been forced to rely on their stock picking skills as much, and in order to receive the index-level returns noted above. The chart above represents the S&P 500 returns sinces 1956, with bear market returns highlighted below the 0% level and bull market returns highlighted above the 0% level, of course. In every circumstance, after the bear markets were sizable bull market returns that would contribute to the stock market’s ability to generate wealth for the savvy investor (chart from E-Toro).
Many investors have thrown in the proverbial towel, in 2022. They’ve given up on investing, having heard the old adage, “Don’t fight the fed.” While it is true that fighting the Fed’s (Federal Open Market Committee) monetary policy program can prove a daunting task for any investor, context is key. Again, allow me to explain. When the Fed is committed to an “easy or easing policy”, such a policy is considered the friend to the average investor given the increase in money supply and/or financial system liquidity provisions/increases. Where there is greater liquidity from easier monetary policy, there are usually the appropriate conditions for greater risk-taking and overall valuations. In such an enviroment, risk is generally rewarded. On the other hand, when the Fed is committed to a tight or restrictive monetary policy, such a policy is considered the enemy of the average investor, given the reduction in money supply and/or financial system liquidity provisions doesn’t reward risk-taking and overall valuations to the same degree as an easing/easy monetary policy. In such an enviroment, especially one where a tightening monetary policy regime is accelerated by abnormally large rate hikes in succession, the rate of change (ROC) of such a policy regime can abnormally adjust the valuation equation and pressure risk assets to a greater degree than most care to consider.
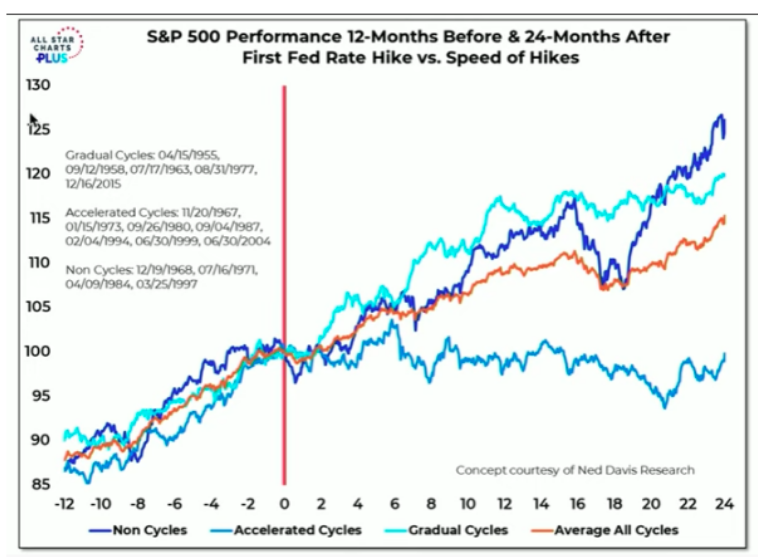
The chart above (All Star Charts Willie Delwiche) recognizes the different types of monetary tightening regimes. The bottom positioned trend line models accelerated rate hike regimes since the 1950s. It’s clear from the chart that this type of accelerated rate hike regime can produce the least of market returns over a 2-year time period. For the current rate hike cyle, note that it has already lasted 9-months in duration, and the trendlines represent an average of the accelerated rate hike regimes, not every individual rate hike regime. In other words, rarely does the average equate to “always”.
Moreover, that is the present day investing landscape, an accelerated Fed tightening regime. This is the battleground that few investors have chosen, but one that can eventually lead to greater investing returns in the future.
Remember the term “don’t fight the Fed.” If investing during a Fed tightening regime, fighting the Fed is exactly what the average and savvy investor would be doing, given what has previously been outlined. The savvy investor is essentially buying risk assets, knowing that the probability of a profitable return would prove lower than in an easing or easier monetary policy regime. But here is where the distinguishing principle of buy low and sell high comes into play, and why the don’t fight the Fed adage doesn’t apply to the savvy investor the same as it would to a short-seller/bear when the Fed is executing an easy/easing monetary policy. The reality is that know matter the Fed policy regime, the savvy investor is advantaged, it’s just a matter of time in the market, not timing the market. If the Fed is executing a tightening policy regime, market valuations are usually re-rated lower, i.e. cheaper valuations/prices, as interest rates rise. The savvy investor is getting an equity discount for which to obtain future profits. From this perspective, the Fed isn’t the enemy of the average/savvy investor, but the friend. We know from market history that, indeed, markets will travel higher over time; the savvy investor simply needs time. So no matter the Fed’s position on m0netary policy today, eventually it will reverse and higher valuatoins will be produced in the future. That’s simply not the case for market bears: Markets do not go down over time, regardless of monetary policy. As such, the market short-seller/bear is always in a position of timing the market, disadvantaged by time itself and heavily reliant on skilled-timing and/or luck. It’s a difficult strategy, indeed.
So let’s look at where we are today, from a historical context. The table below comes from Charlie Bilello. He recognizes the worst S&P 500 (SPX) performances through the first 187 trading days of a calendar year. The S&P 500’s return in 2022 ranks as the 4th worst performance through 187 trading days, since 1928.
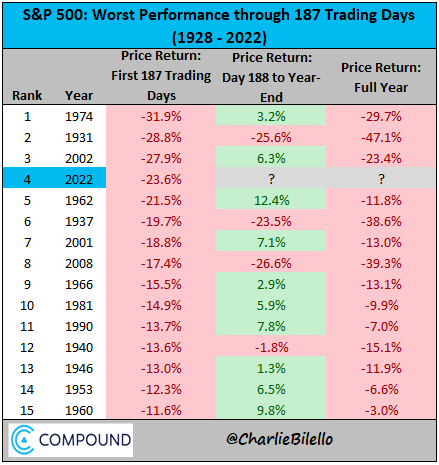
Based on the table of returns above, only 1931 found markets in even worse shape (delivering more downside) through year-end. It has proven a trecherous year-t0-date thus far, and there could be more downside ahead, but the odds actually seem to favor a retreat in the year-to-date drawdowns more so than additional downside, if considering the table above.
In certain of the Finom Group Research Reports this year, we have previously outlined that the worse the year-to-date declines over a 2 Quarter period, the greater the probability that the markets have priced in a number of variables. What are some of the variables we have considered?
- Forward earnings per share (EPS)
- Less Equity Risk Premium (ERP)
- Recessionary conditions
- Higher inflation and higher rates
The bullet points above are just a few variables the market may have or has been discounting, recognizing that the stock market is a forward discounting mechanism. With this in mind, we should always recognize that the market has generally already discounted that which is featured fearfully in the financial media for possibly causing “that much more downside” to come.
Referencing the biggest 2-Quarter declines/drops in the S&P 500 since WWII, the tables below from Bespoke Investment Group help to validate the overarching theme of this article, from a quantitative, savvy investor perspective.
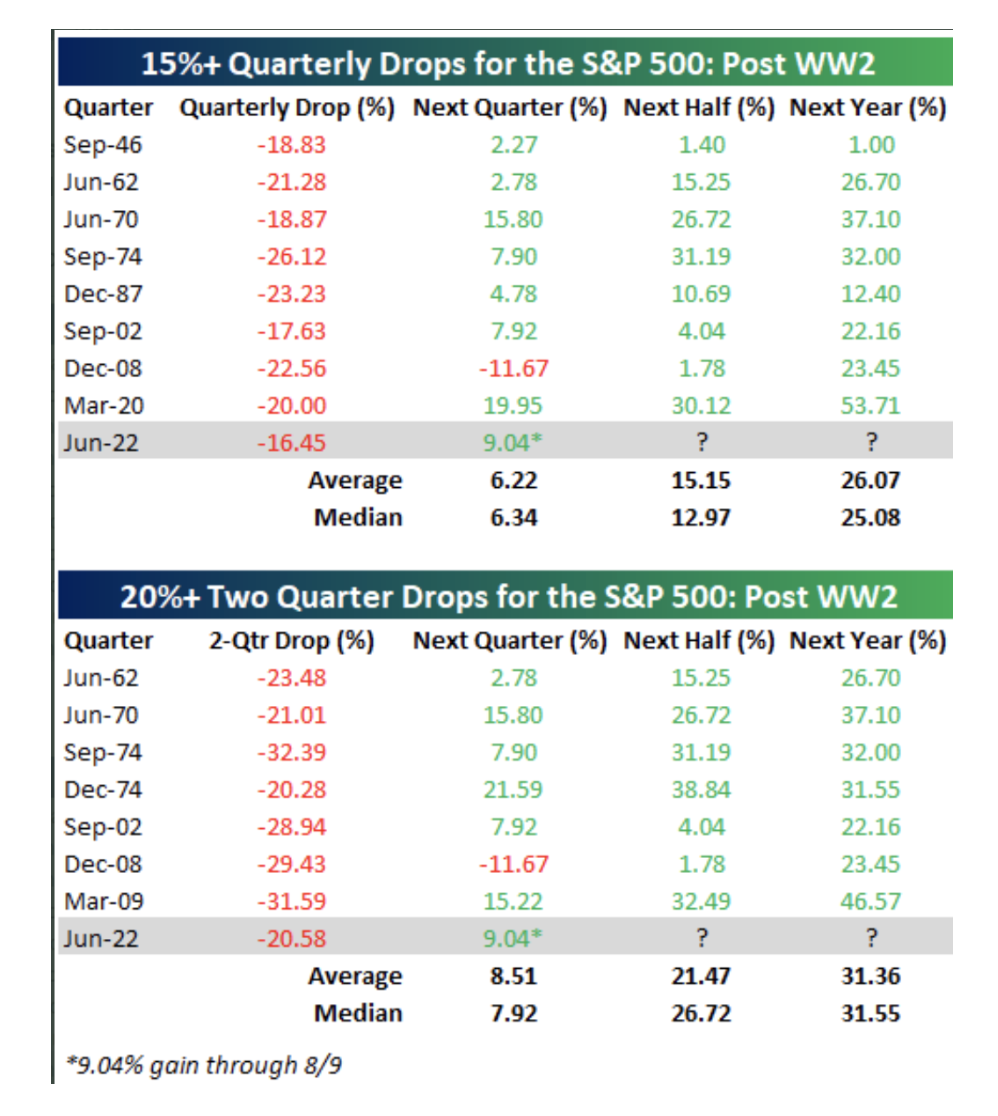
- Q2 fell 15%+.
- Q1 & Q2 combined fell 20%, in 2022.
- Historically, this has happened only 8 other times.
- Only 2008 had more declines after either a 1-Quarter decline of 15%+ and/or a 2-Quarter decline of 20%+, until 2022 of course.
- Given the data above, it would have been suggested that it was unlikely or a lesser probability that Q3 2022 would deliver a negative return, but it happened. We might consider the variable that helped to deliver even greater value for the savvy investor as being a causation of the tighter Fed policy.
- Nonetheless, two Quarters after a 2-Quarter drop of 20%+ the market has never delivered a negative return over the following two Quarters later, which would be the pending Q4 2022 period. In other words, the probabilities are that 100% of the time after a 2-Quarter 20%+ drop, the market has been higher two Quarters later.
- At the end of Q2 2022, the S&P 500’s price was 3,785.
- While the historic data is a reasonable guide, we can’t suggest it’s the Gospel.
- History suggests that such data proves consistent and the savvy investor should generally lean into the higher probability returns. If they don’t bear the fruit of such higher probabilities, time is still the best friend of the savvy investor.
- Lastly, note from the table above that all occurrences were positive 2, 3, and 4 Quarters later.
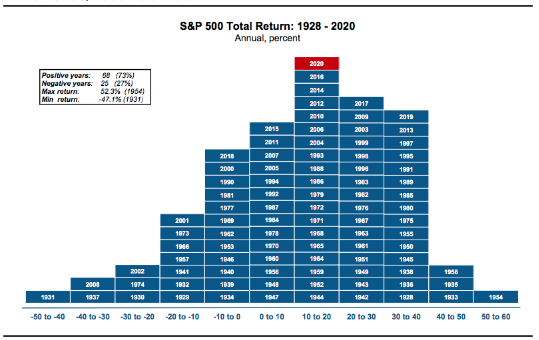
To round out this article on the current “state of the market”, we’ll offer this sentiment: Negative annual returns are rare. Since 1928, 73% of all years the market has delivered a positive annual return (not including 2021 (24%+ return)).
This helps to reinforce the fact that savvy investors aren’t fighting the Fed by taking advantage of a tighter monetary policy, but rather taking advantage of fleeting value creation for future wealth creation. As Chris Tucker famously said in the movie cult classic Friday, “Take advantage, take advantage man!”
It’s incredibly difficult for the S&P 500 to deliver a negative annual return, incredibly difficult. It’s proven even more difficult, throughout history, for the market to deliver a negative return over a 2-year time period. In the post-WWII period, the S&P 500 has only managed to deliver back-to-back down years… twice, that’s right, twice, and as outlined in the chart of annual S&P 500 returns below:
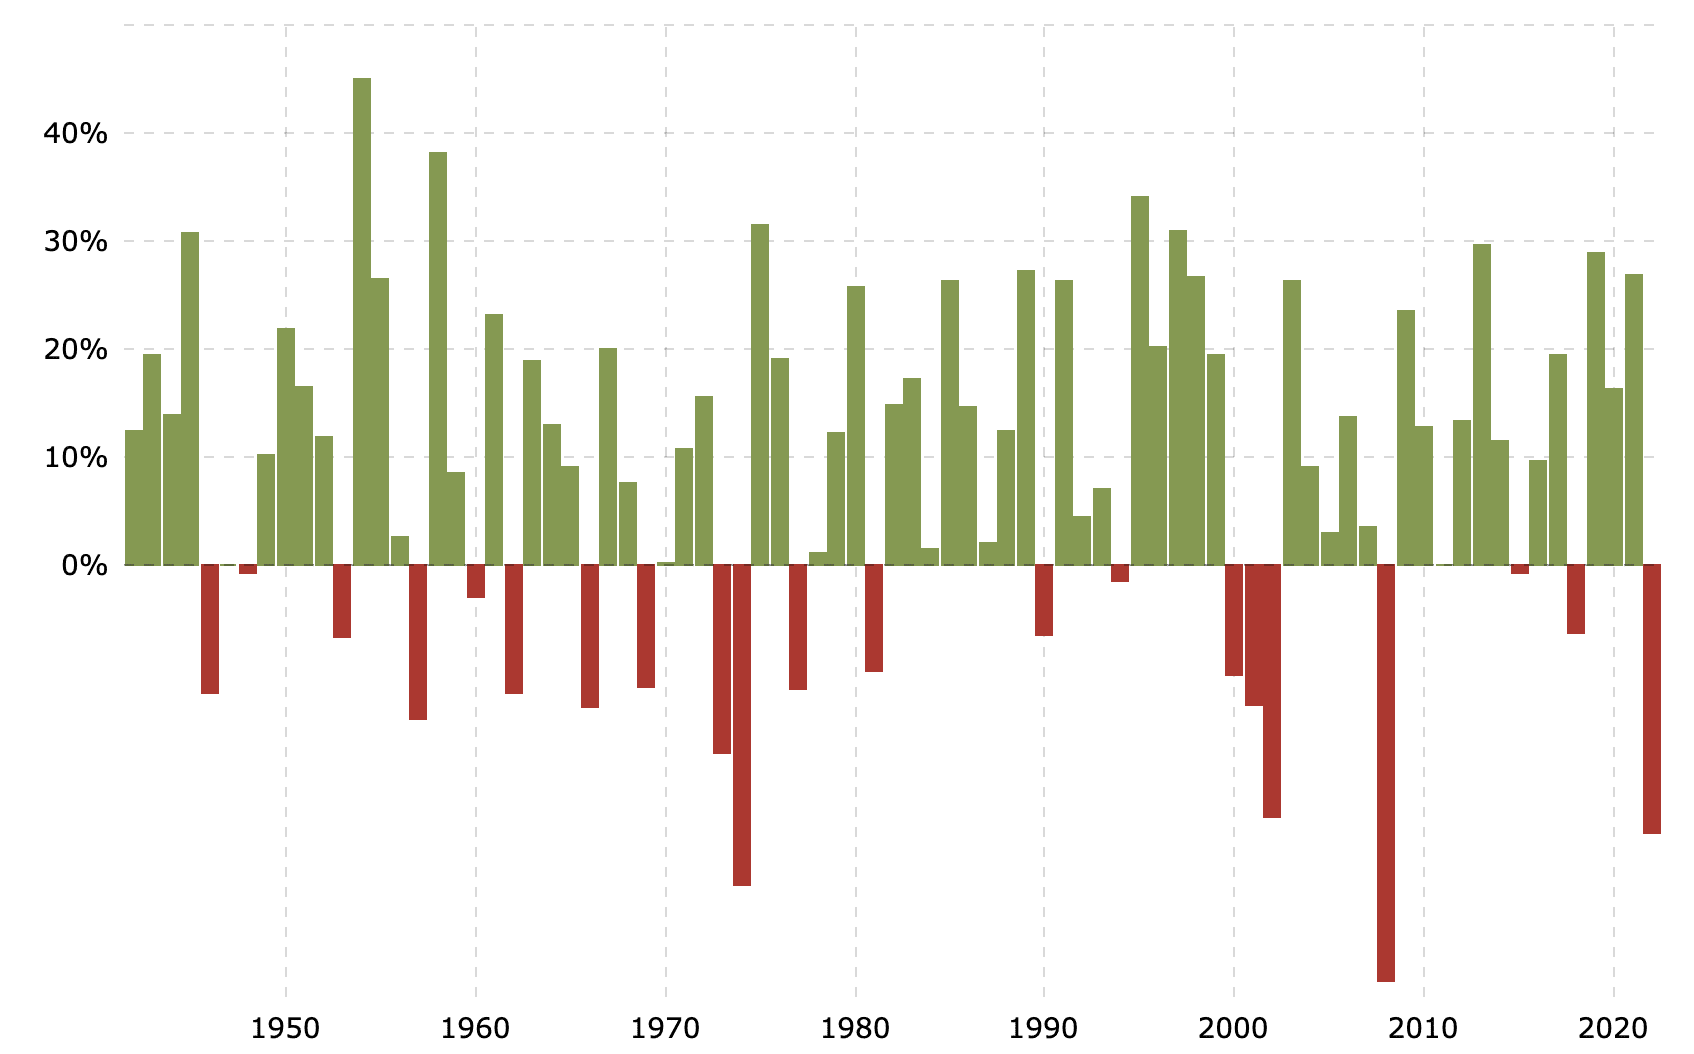
Only 1973-1974 and 2000-2002 produced consecutive down years for the S&P 500. Could that happen again from 2022-2023? It absolutely could, but it would be the least likely outcome, as demonstrated. The savvy investor leans into the higher probabilities for future returns, not the lesser probable outcomes. And as always, if the lesser probable outcome is still managed to prove the ultimate return, time is on the savvy investor’s side. Simply wait longer, manage cash wisely over the stated time period and dollar-cost-average further and for compounding future returns, as they will return.
Just how difficult is it to deliver a negative 1-year and/or 2-year negative return? Well, let’s see what we can discern from just a few variables that have and could possibly do so, shall we? If we are highly recognizing that Fed policy/regime plays an important role in the S&P 500’s performance, consider the table below of easing and tightening Fed regimes, juxtaposed with S&P 500 profit performance: (table from Richard Bernstein Advisors)
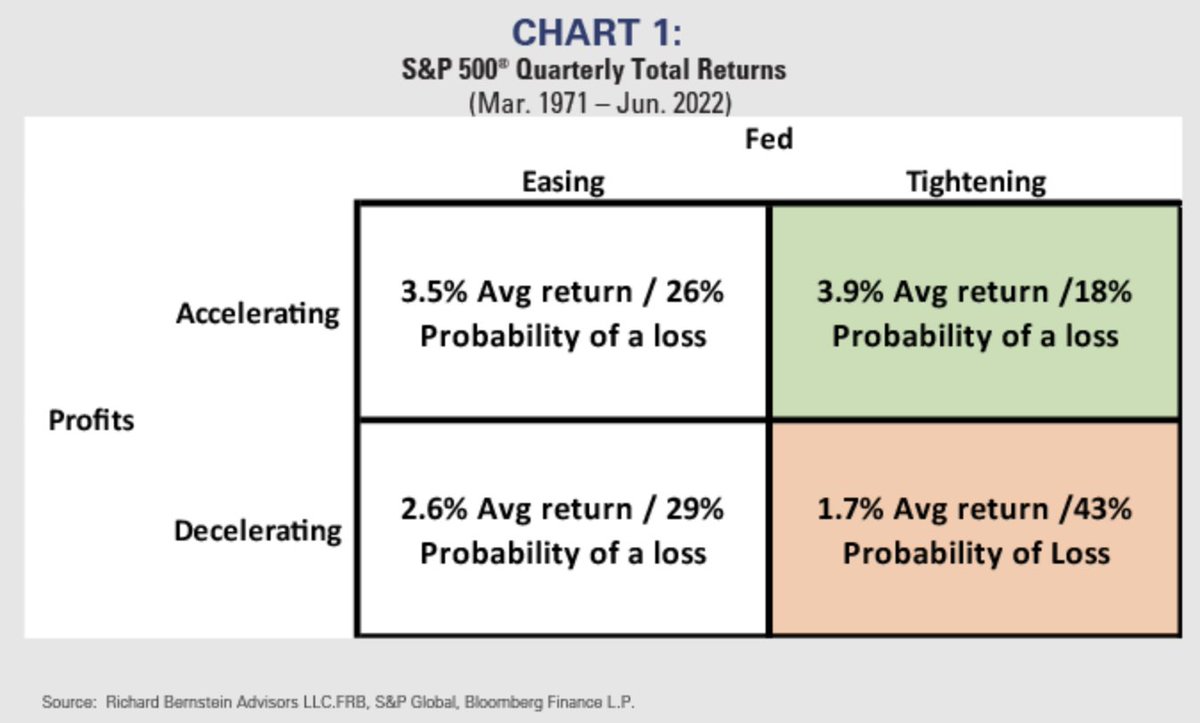
As the table shows, a combination of Fed tightening and profits decelerating has been the worst combination for equity returns of the 4 possible scenarios considered. That’s literally the environment/landscape in 2022. The probability of negative returns is the highest of the scenarios, at 43 percent. Take notice, however, that negative returns under this scenario are still less than 50/50. While the scenario holds the higher probability of a negative return, overall it is still a lesser probability, which is not advantaging investor returns in 2022. This helps to reinforce that some times, indeed, the lesser probabilites do occur, and investors will simply have to “wait longer” while continuing to take advantage of the discounts at-hand.
What if earnings actually move from decelerating to an outright year-over-year decline by 2023? Firstly, remember that markets are a forward discounting mechanism, and have likely been discounting this possibility already, and to one degree or another.
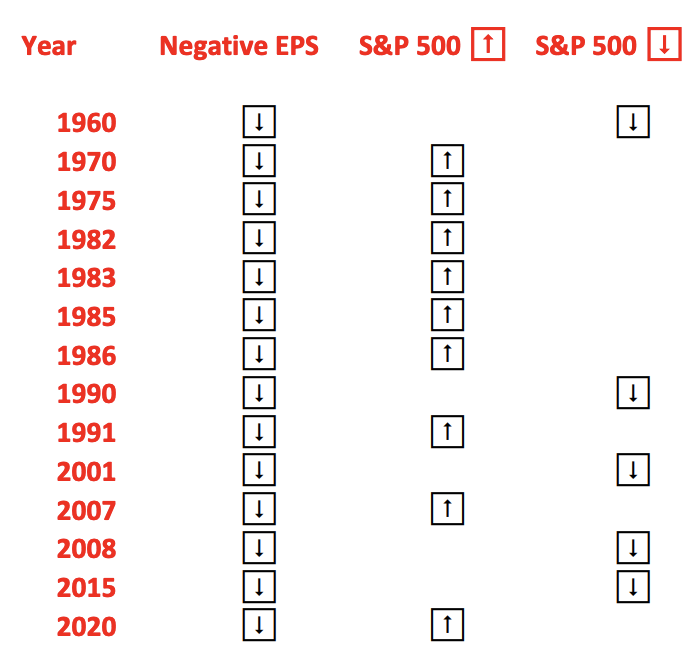
Yes and undeniably: Earnings growth is important, but it’s not everything. Since 1960, EPS has declined in 14 calendar years. Still yet, nine of those calendar years delivered S&P 500 gains .Only five calendar years delivered S&P 500 losses. This also helps to better understand another undeniable truth about markets: Price-to-Earnings or P/Es expand over time! So while you will almost inevitably hear about future earnings prospects dwindling going forward: 1) the market is likely discounting that probability already in 2022 and 2) earnings are not the only driver of price/returns in the interem.
Now let’s take a quick look at periods where S&P 500 EPS is being downwardly revision, akin to the present situation:
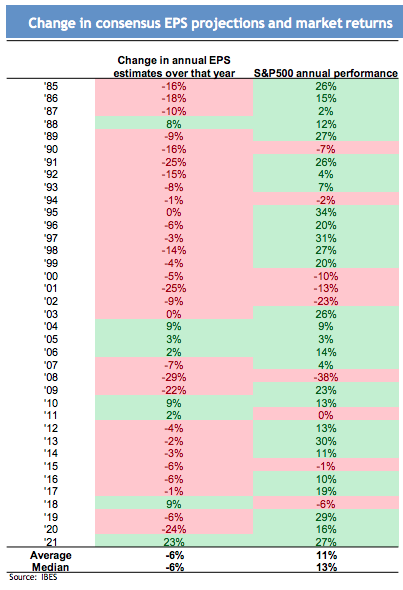
Yes, even when EPS revisions are negative, that was not historically a reason to be bearish on the market. Sounds counterintuitive, but the data does NOT lie. Realized EPS is what matters, more often than not! This continues to suggest that the biggest and most compelling factor for 2022’s market decline is a substantial and rather rapid tightening of monetary policy.
What about combining the current inflation regime with negative year-over-year earnings declining; a double whammy of headwinds for positive S&P 500 returns?
In the post-WWII era, there has typically only proven 3 causal factors cooresponding to reasons a negative annual S&P 500 return: Inflation/rising rates, Financial Crisis, and a war-driven economic imbalance (late 1940s). Earnings matter, but they are part of the “given”, with investing. Investors aren’t investing with today’s earnings potential in mind, but future earnings potential. The average long-term holding period for an investor is 36 months.
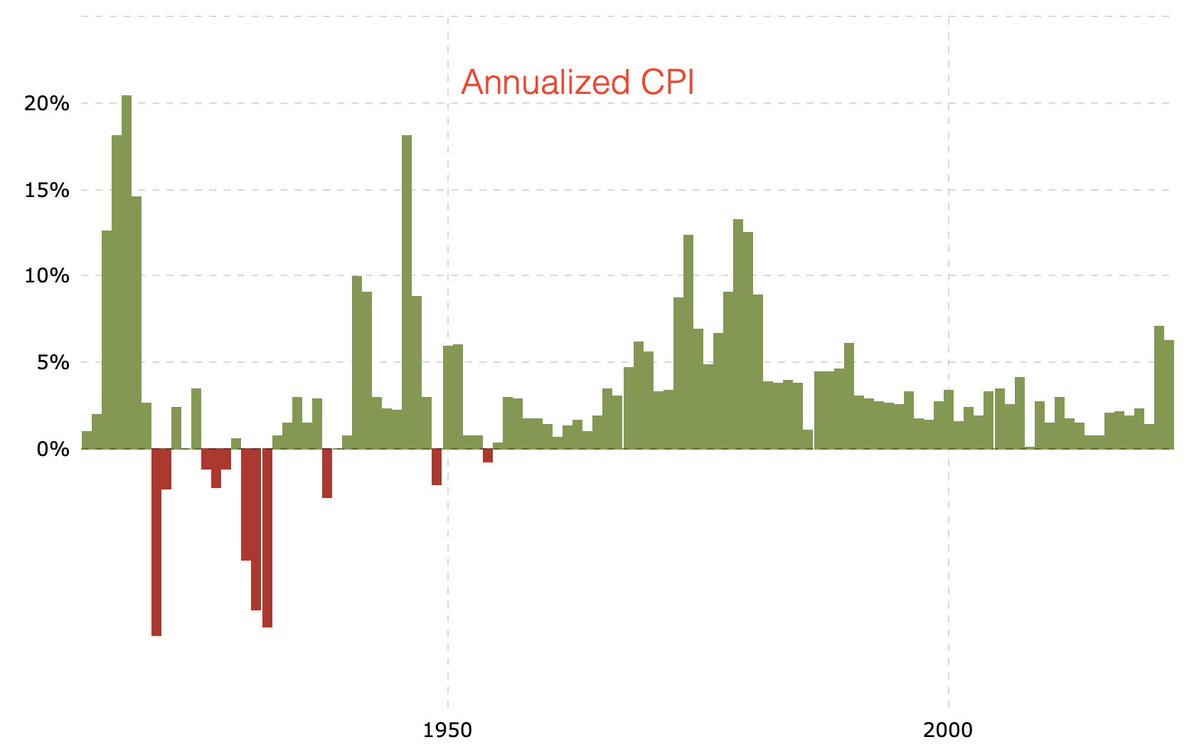
So considering both elevated inflation and a potential earnings decline or deceleration, here is what we discovered in our research:
- Years when CPI is above 5%+ and falling, as is the case presently, with EPS falling YoY, and no recession or recession ending.
- 1970 (ends)
- 1975
- 1982 (ends)
- 1991 (ends)
- The combination of elevated but falling CPI with earnings deceleration and/or outright falling are rare, but all years found the S&P 500 delivering a positive return.
Is it possible, then, that a recession may have not even started and would begin next year? Yes, that’s a possibility. Again, however, what do you think the market is/has been discounting, as earnings typically fall during a recession and on average roughly 13 percent. Furthermore, yes, we have outlined what would still be the most critical aspect of such conditions as it relates to future investor returns: managing cost wisely and dollar-cost-averaging for compounding future returns. History outlines the most important variables for the savvy investor no matter what dire scenario one puts before the savvy investor: cash and time. Maintain both variables and all that we might fear from the current state of the market will work itself out favorably for humanity, and future returns.
At the end of the day, investing can prove as difficult or as simplistic as we desire. We make it increasingly difficult when we elevate the fearful headlines of the day while pushing “back stage” the benefits of the compounding effects from taking advantage of the discounts featured in price today. The chart/table below illustrates the “compounding effects”, which we would hope investors absorb and push center stage when consider any further downside in markets that may lay ahead.

Lastly, but certainly not least… more downside ahead is certainly possibly, but less probable. It’s a midterm election year and typically bear markets end in October, typically, not always. One of the most reliable trends concerning midterm election years lay just ahead and commences post midterm election day.

We’re not going to explain the S&P 500 midterm election to April 2023 return table above, just try to find a negative integer in the right column, which should speak volumes.
If you’re not a member of finomgroup.com and have enjoyed/appreciated this big picture perspective piece, know that we offer deep-dive analytics on a weekly basis inside our Research Report and State of the Market weekly videos to our Premium and Contributor members. Consider a subscription today and invest/trade alongside our team!


